Where are the 60 Home Run Hitters?

There have been a lot of homers in baseball this season. Perhaps too many, as Jay Jaffe wrote back in June. At its current pace, the majors will average 227 home runs per team, clobbering the 2017 mark of 204 and coming in way ahead of last year’s 186 mark. When Barry Bonds broke the single-season home run record in 2001, the major league team average was 182. When McGwire and Sosa dueled, it was 169. When Roger Maris broke Babe Ruth’s record, the team average was 152. So how is it that we have a 50% increase in home runs from the time Maris hit 61, and a 22% increase over last year, and yet still don’t have a player likely to hit 60 homers?
Here are this year’s home run leaders through Tuesday’s games along with their projected total, their current pace based on team games, and the number of homers per 700 plate appearances (which will be more important later):
| Name | PA | HR | Projected | Pace | HR/700 PA |
|---|---|---|---|---|---|
| Cody Bellinger | 401 | 34 | 50 | 57 | 59 |
| Christian Yelich | 388 | 33 | 47 | 56 | 60 |
| Mike Trout | 402 | 30 | 48 | 51 | 52 |
| Peter Alonso | 394 | 30 | 45 | 52 | 53 |
| Edwin Encarnacion | 377 | 28 | 44 | 49 | 52 |
| Josh Bell | 408 | 27 | 39 | 47 | 46 |
| Hunter Renfroe | 304 | 27 | 43 | 47 | 62 |
| Franmil Reyes | 314 | 26 | 40 | 45 | 58 |
| Max Muncy | 381 | 25 | 38 | 42 | 46 |
| Freddie Freeman | 426 | 25 | 38 | 42 | 41 |
| Mike Moustakas | 382 | 25 | 38 | 42 | 46 |
| Jorge Soler | 395 | 25 | 37 | 42 | 44 |
Projections, which are admittedly somewhat conservative, expect there to be one 50-homer hitter at the end of the year (Cody Bellinger), as well as a handful of players with at least 40 homers. Even if we go by pace and the hitters hit exactly was well as they have up to this point, Bellinger and Yelich will have great seasons but fall a few homers shy of 60. Yelich and Hunter Renfroe are the only players on a 60-homer pace if they were to get to 700 plate appearances. While all the home runs being hit might make it seem like a 60-homer season should happen, the sheer number of homers in the game don’t actually dictate what the league leader might do. The graph below shows the average number of home runs by team per year along with the home run leader for that season:
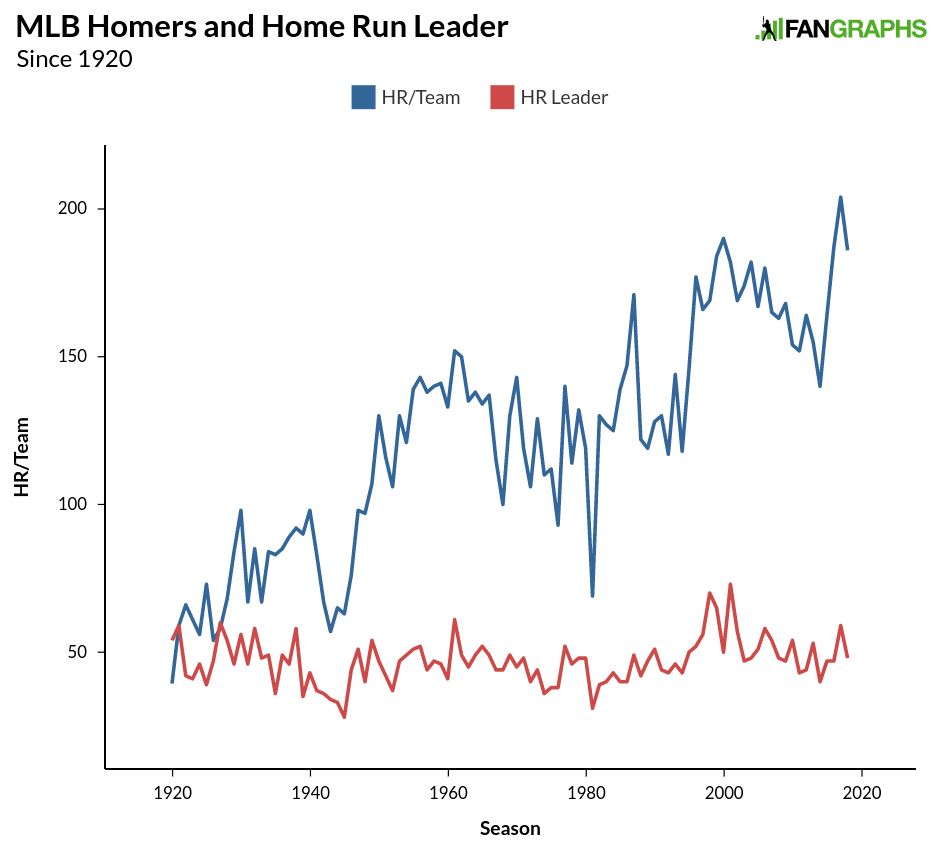
While the numbers can track together, league leaders have mostly stuck around the same place, even as homers league-wide have gone way up. The dip in 1981 is due to a less than full season; the two seasons right before the big jump in 1996 were also strike-shortened. To provide a more direct comparison, here’s the same information on a scatter plot:
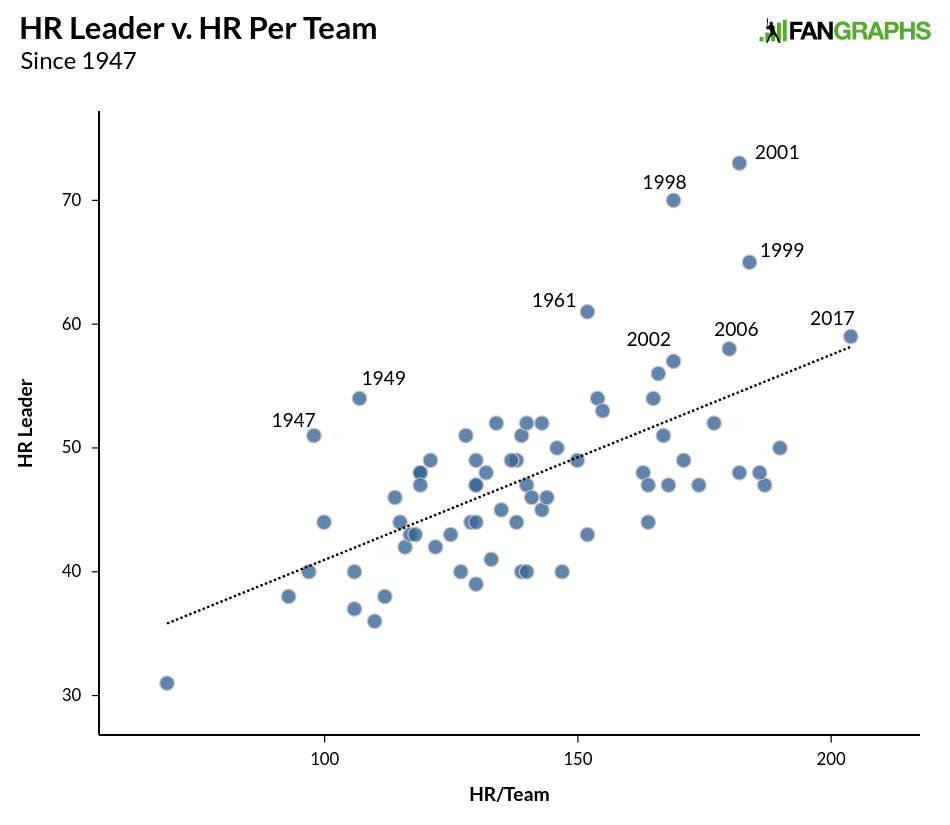
There is a bit of a relationship there, but all of the big individual home run seasons are outliers that don’t quite track with the general rise of home runs. There have been eight seasons with a team average of at least 180 homers. Four of those seasons featured league-leader seasons of at least 59 homers, but the other four saw the league leader end up at least 10 homers shy of 60. If we were to continue that line of reasoning and look at this season’s pace of 227 homers, we’d see it lines up with 64 homers, but based on prior seasons, we are just as likely to end up well below that mark as we are at or above it.
The short answer to why there isn’t likely to be a 60 home run hitter is that having a 60-homer season isn’t necessarily tied to league-wide homers. We can find further evidence when looking at this year’s particular crop of major league players. First, let’s take a look at older big home run seasons. There have been 19 individual seasons where a player has hit at least 55 homers. Those players are listed below along with their home runs per 700 plate appearances in the three seasons preceding the 55+ homer season, as well as the single-best HR/700 PA season in those three years:
| Name | Season | PA | HR | 3-YR HR/700 PA | 3-YR High HR/700 |
|---|---|---|---|---|---|
| Barry Bonds | 2001 | 664 | 73 | 48 | 57 |
| Mark McGwire | 1998 | 681 | 70 | 64 | 66 |
| Sammy Sosa | 1998 | 722 | 66 | 42 | 52 |
| Mark McGwire | 1999 | 661 | 65 | 70 | 72 |
| Sammy Sosa | 2001 | 711 | 64 | 59 | 64 |
| Sammy Sosa | 1999 | 712 | 63 | 51 | 64 |
| Roger Maris | 1961 | 698 | 61 | 34 | 47 |
| Babe Ruth | 1927 | 691 | 60 | 47 | 51 |
| Giancarlo Stanton | 2017 | 692 | 59 | 55 | 59 |
| Babe Ruth | 1921 | 693 | 59 | 43 | 62 |
| Mark McGwire | 1997 | 657 | 58 | 61 | 66 |
| Ryan Howard | 2006 | 704 | 58 | 43 | 44 |
| Jimmie Foxx | 1932 | 701 | 58 | 37 | 39 |
| Hank Greenberg | 1938 | 681 | 58 | 37 | 40 |
| Alex Rodriguez | 2002 | 725 | 57 | 48 | 51 |
| Luis Gonzalez | 2001 | 728 | 57 | 28 | 30 |
| Ken Griffey Jr. | 1998 | 720 | 56 | 52 | 56 |
| Ken Griffey Jr. | 1997 | 704 | 56 | 51 | 57 |
| Hack Wilson | 1930 | 709 | 56 | 36 | 41 |
| AVERAGE | 698 | 61 | 48 | 53.5 |
The reason I’ve used home runs per 700 plate appearances is because to get close to 60 homers, batters generally need around 700 plate appearances, McGwire and Bonds notwithstanding. Outside of the three seasons in the 1930s, Maris’ record-breaking campaign, and Luis Gonzalez in 2001, every player averaged at least 40 homers per 700 plate appearances over the prior three seasons. While Maris had a relatively low three-year total, he did have a shortened season during which he was on pace for 47 homers. In addition to Maris, Gonzalez, and the ’30s trio, only Ryan Howard didn’t have a prior season where he was on a 50-homer pace per 700 plate appearances.
Given that information, we can look at the profiles of players who might fit that bill this year. I looked at all players with at least 1,000 plate appearances over the last three seasons. There were only eight players with at least 40 homers per 700 plate appearances from 2016 through the 2018 season. The players are listed below along with their season-high HR/700 PA:
| Name | PA | HR | HR/700 PA 2016-2018 | High HR/700 PA 2016-2018 |
|---|---|---|---|---|
| Joey Gallo | 1139 | 82 | 50 | 54 |
| Khris Davis | 1916 | 133 | 49 | 51 |
| J.D. Martinez | 1655 | 110 | 47 | 64 |
| Giancarlo Stanton | 1867 | 124 | 46 | 60 |
| Aaron Judge | 1271 | 83 | 46 | 54 |
| Gary Sanchez | 1128 | 71 | 44 | 44 |
| Nelson Cruz | 1903 | 119 | 44 | 45 |
| Edwin Encarnacion | 1950 | 112 | 40 | 42 |
Admittedly, it would be hard for Gary Sanchez to get to the 700 plate threshold as a catcher. Cruz and Encarnacion are also older and unlikely candidates. Of those not on the list, Cody Bellinger came in with around 38 homers per 700 plate appearances with a 50-homer per 700 PA season back in 2017, so he comes pretty close in these categories. Yelich’s three-year numbers are under 30 homers and even last year, he was under 40 dingers. If we extended the three-year PA threshold below 1,000, we would add players like Rhys Hoskins, Matt Olson, Jesus Aguilar, and Hunter Renfroe, but none of those players have any single season with more than 300 PA where they had even a 45-homer pace. I took the players above and added a column that seems particularly relevant:
| Name | PA | HR | HR/700 PA 2016-2018 | High HR/700 PA 2016-2018 | IL in 2019 |
|---|---|---|---|---|---|
| Joey Gallo | 1139 | 82 | 50 | 54 | Yes |
| Khris Davis | 1916 | 133 | 49 | 51 | Yes |
| J.D. Martinez | 1655 | 110 | 47 | 64 | No |
| Giancarlo Stanton | 1867 | 124 | 46 | 60 | Yes |
| Aaron Judge | 1271 | 83 | 46 | 54 | Yes |
| Gary Sanchez | 1128 | 71 | 44 | 44 | Yes |
| Nelson Cruz | 1903 | 119 | 44 | 45 | Yes |
| Edwin Encarnacion | 1950 | 112 | 40 | 42 | No |
Six of the seven best candidates to hit 60 home runs this season have been injured at some point in the season. Edwin Encarnacion hasn’t been hurt, but he barely makes the threshold and hasn’t had a big HR/PA season over the last three years. J.D. Martinez certainly looks like a good candidate, but if he’s the only reasonable and healthy option to hit that still-magic number, the odds of it happening aren’t great. We might still get a 60-homer season out of somebody this season, though the odds look slim. If the top five players on the list above were all healthy all season long, we might have had that special season. But with those players sidelined and potentially dealing with injuries even while playing, 60 homers is more fantasy than reality.
Craig Edwards can be found on twitter @craigjedwards.
Basically boils down to needing around 700 PA (i.e. not getting hurt) and having a few crazy hot streaks.
So it makes sense that it doesn’t happen all that often
And not getting walked a ton, particularly closer to the end of the season.
I like to daydream about how many homers Trout would hit if he walked even half of how often he does currently.
Probably about 4 more, since (this year) he homers about once per 10 AB, and he’s walked 77 times.