Why Does Jeff Samardzija Give Up So Many Homers?

Jeff Samardzija will call The Cell his new home, and this shark has never regularly infested waters as unfriendly as these before. After calling neutral or pitcher-friendly parks and leagues home so far in his career, the former wide out is is now in a tighter spot. And he’s already given up homers so far in his career. But why? Why has he been homer-prone?
It’s not immediately obvious why the guy with the big fastball and the diving splitter(s) has had an issue with the homer. His career ground-ball rate (46.2%) is above average and has been trending upward. He’s averaged over 94 mph on his fastball every year as a starter so far, and 95 mph is traditionally a benchmark for lowered home run rates on the fastball. Over the last three years as a starter, his walk rate has been better than league average. Even his release point has been about as consistent as the one that propelled Corey Kluber to greatness.
Why does Jeff Samardzija give up home runs?
I thought I’d check his fastball location. Looking at the heat map, it could be a thing:

Even if it looks like the throws down the middle a lot, according to Baseball Savant’s zones, only 1.2% of his overall pitches end up in the smallest middle box. That’s actually in the bottom 10% — he throws about a third as many pitches down the middle as David Robertson, for example.
And yet, when they do go down the middle, his pitches get hurt. Take a look at where Samardzija’s homers have been, thanks to Daren Williams at Baseball Savant.

Even if the league gives up homers on pitches down the middle, that’s a little worse than average. It still doesn’t really tell us *why*, though.
Samardzija does throw more high fastballs than average. His average height on the four-seam is about an inch higher than league average. He throws his fastball up in the zone about as much as John Lackey, a little bit less than Yordano Ventura. Here’s the thing, though: average fastball height has no correlation with home run rates. Looks like it’s just a thing that matters to each pitcher in a different way (Samardzija’s average fastball height has been fairly steady).
When seen by percentages, Samardzija’s splitter gives up the second-most home runs in his arsenal. Perhaps it flattens out? Here’s a look at his splitters since 2012. Confirming what he said back then, he does look to have two versions of the pitch — one is faster and has more fade and less drop (green dots on left side of graph), while the other is slower and has less fade and more drop (red dots on right side of graph).
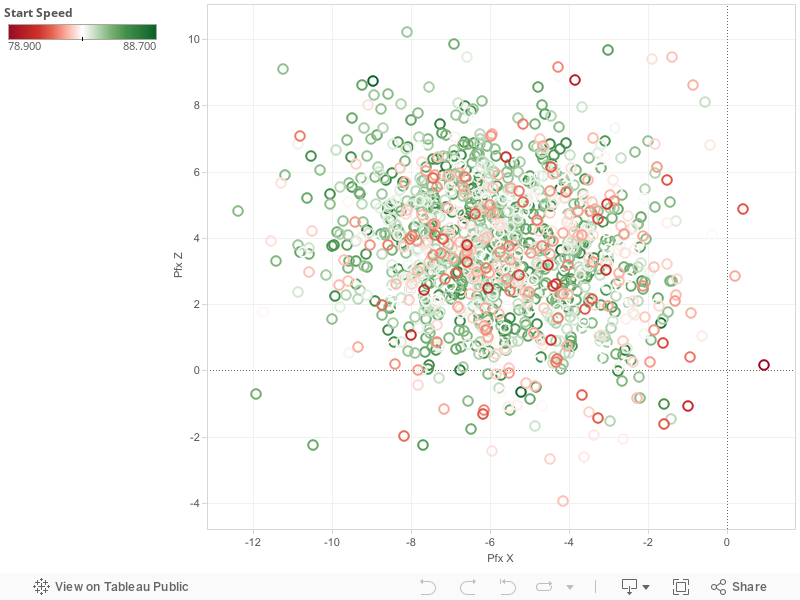
Let’s split his splitters into two. He’s thrown 623 splitters 85 mph or faster, and he’s thrown 650 slower than that benchmark. Of the 100 balls in play from the faster splitters, five have been homers. Of the 99 slower splitters he’s allowed into play, three have been homers. Hard to say that a flat splitter is the cause.
The pitch that has allowed the most home runs for him has been the cutter. It’s a good pitch in terms of whiffs (11% swinging strikes, average is below nine), but it still has the worst homer rate. If we repeat the analysis with the cutter, we see the same pattern. A harder cutter with more ride and a slower cutter with more drop.
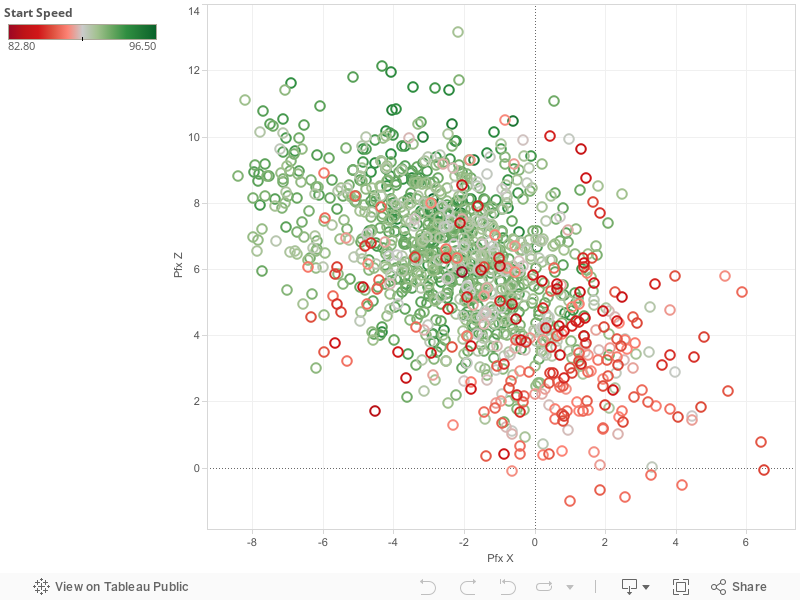
Some of those slower cutters are probably sliders, especially since he didn’t mention a cutter when asked about his arsenal in 2013. If we just look at the 14 home runs he’s given up on pitches that were called cutters, it’s possible we see a pattern.
| Result | PFx_x | Pfx_z | Velocity |
|---|---|---|---|
| Homer | -2.77 | 6.84 | 91.01 |
| All | -1.95 | 5.63 | 91.04 |
Despite having almost the exact same velocity, the cutters that have gone for homers have dropped over an inch less than his average cutter. That might be what you call a hanging slider.
Watch Jeff Samardzija, and you know that he occasionally loses command of his pitches. Those bouts probably lead to more home runs. Unfortunately, there’s not a great way to attack this issue with the tools we have now. All they really say is that, yeah, he throws the ball up in the zone a little, maybe down the middle a bit much, and every once in a while he hangs a slider.
That doesn’t seem like the sort of thing that would give him the worst home run rate among pitchers with better than a 47% ground ball rate and more than eight strikeouts per nine over the last three years, but maybe it that’s all it is. (And it’s not likely to get a lot better in The Cell.)
With a phone full of pictures of pitchers' fingers, strange beers, and his two toddler sons, Eno Sarris can be found at the ballpark or a brewery most days. Read him here, writing about the A's or Giants at The Athletic, or about beer at October. Follow him on Twitter @enosarris if you can handle the sandwiches and inanity.
If we can’t find a reason for it, could it be a possible candidate for regression?
Knowing why it happens wouldn’t have any impact on regression.