You Can’t Fake Exit Velocity
Last week, I spent a few articles idly hunting for hitter breakouts. I centered my search on players with admirable top-end power numbers but who reached that summit rarely. I found that when those players increased their contact rate, they improved their overall line significantly. I think that finding tracks with intuition in addition to having data to back it up, so I’m overall pleased with that research.
That said, all this downloading and scraping of exit velocity data made me wonder about the opposite side of this spectrum: can hitters add power and break out from the other direction? Hitters who make a ton of contact but don’t hit the ball with much authority feel somewhat capped offensively; in my head, Luis Arraez has a 0% chance of turning in a 20-homer season. I didn’t have the numbers behind that, though, so I gathered up the same pile of data I’d used before and started hunting.
The main thing I learned from the data is something that you’ve heard over and over again: maximum exit velocity (and 95th-percentile exit velocity, which I’m using) is sticky. How hard you hit the ball in one year does a great job of determining how hard you’ll hit the ball in the next year.
More specifically, I took a sample of players with at least 100 batted balls in two consecutive seasons. I sampled from 2015 to ’22, which gave me seven year-pairs, though the ones involving 2020 were light on qualifying players thanks to the abbreviated season. From there, I asked a simple question: how much did each player’s 95th-percentile exit velocity change from one year to the next?
Obviously, players improve their exit velocity every year. Even if their true talent never changed, a laughable assumption, random variance would make some hitters get to their best efforts more frequently in games from one year to the next. The question, then, is how much a given player can improve their exit velocity by, and how likely that improvement is.
I came up with a test that I think is simple and informative. The question I’m asking, essentially, is how often a hitter moves from one tier of contact quality to another, as measured by 95th-percentile exit velocity. I measured the standard deviation of 95th-percentile exit velocity across the entire population of hitters with 100 batted balls in each year. Then I checked what percentage of the hitters who played in both that season and the next improved (or declined) by at least one standard deviation.
That might all sound like a jumble, but consider it this way: standard deviation is a good measure of how widely the population varies. If you have a statistic with huge variation from player to player, you’d expect that statistic would also be noisier for a given player on their own. If, on the other hand, there’s almost no variation across the league as a whole, an individual player changing theirs is more impressive. Indeed, exit velocity changers are rare: only 4% of hitters saw their 95th-percentile exit velocities change by at least one standard deviation from one year to the next.
“But Ben,” you might say, “I have no idea what that means.” That’s a valid point. What’s 4% compared to 6%, or 2%, or any other number I could pick out of a hat? We need to compare it to something more familiar to understand whether 4% of the population displaying a big change is a significant result.
To do so, I enlisted a little help from other statistics. I considered launch angle tightness, average exit velocity, maximum exit velocity, chase rate, contact rate, walk rate, strikeout rate, and even wRC+. I used a 150 PA minimum for the non-batted-ball statistics and stuck with my 100 batted ball minimum for the rest. This gave me a baseline number to compare the changes in 95th-percentile exit velocity against.
If you want to know why analysts focus more on top-end power than average exit velocity, here it is in a nutshell. In a given year, 15.8% of batters see their average exit velocity improve or decline by at least a standard deviation. It’s a noisy statistic, in other words; you might think that you can tell the difference between two hitters based on their average exit velocities, but there’s a decent chance that you’re being deceived by variance. Hitters change their average exit velocities by a whole standard deviation four times as frequently as they change their top-end power. One year’s data point could easily be a mirage.
What about launch angle tightness, a method for estimating consistent contact? That’s even more variable than average exit velocity: 25% of hitters saw their launch angle vary by more than a standard deviation from one year to the next. One note here: a change in the way that Statcast collects data led to a meaningful change in launch angle tightness measures from 2020 to ’21 (Hawkeye cameras capture a higher percentage of batted balls, so meaningfully fewer batted balls had imputed launch angles, which changed standard deviation significantly). Accordingly, I tossed that pair (changes from 2020 to ’21) out of the dataset.
When it comes to batted ball metrics, 95th-percentile exit velocity stands alone at the top. For the record, maximum exit velocity is too noisy; 13% of hitters changed theirs by at least a standard deviation from year to year. I think that’s a measurement issue, as it’s easier to crush one batted ball than to crush enough to move up your 95th-percentile mark. That difference matters even more over less-than-complete seasons; 95th-percentile exit velocity scales with sample size better than maximum exit velocity.
When compared to swing-based metrics, 95th-percentile exit velocity stands out again (I’m just going to call it EV95 from here on out because I’m tired of typing it). 10% of hitters change their chase rate by a standard deviation or more from one year to the next; 7.3% of hitters change their contact rate by a standard deviation or more; 12.3% change their zone contact rate by a standard deviation or more. None of those compare to the roughly 4% mark for EV95.
Naturally, PA-level statistics lag the field; they’re the noisiest, which doesn’t surprise me. Per the data, 23.3% of hitters change their walk rate by one standard deviation or more from one year to the next, and 11.4% change their strikeout rate by a standard deviation or more. wRC+ is the noisiest: a whopping 33.8% of hitters see it change by a standard deviation or more. That makes total sense to me; it’s trying to summarize how good you are at hitting in one number, so innumerable different changes all feed into the same result.
In table form, you can see EV95’s pre-eminence when it comes to year-to-year stability:
| Metric | Average | St. Dev | %Changes >1SD |
|---|---|---|---|
| EV95 | 105.2 | 2.9 | 3.9% |
| Max EV | 110.3 | 3.3 | 13.5% |
| Avg EV | 88.0 | 2.5 | 15.8% |
| LASD | 28.4 | 3.4 | 30.6% |
| Chase% | 31.1% | 6.1% | 10.0% |
| Contact% | 77.4% | 6.1% | 7.3% |
| Z-Contact% | 85.7% | 5.1% | 12.3% |
| BB% | 8.5% | 3.1% | 21.3% |
| K% | 21.9% | 6.2% | 11.4% |
| wRC+ | 99 | 27 | 33.8% |
One nitpicky procedural note on the above table: the average and standard deviation numbers I displayed there are calculated across the entire population for all years from 2015 to ’22. When I did the actual calculations of which batters changed by a standard deviation or more, I calculated each year’s standard deviation individually and compared changes to the year-specific numbers.
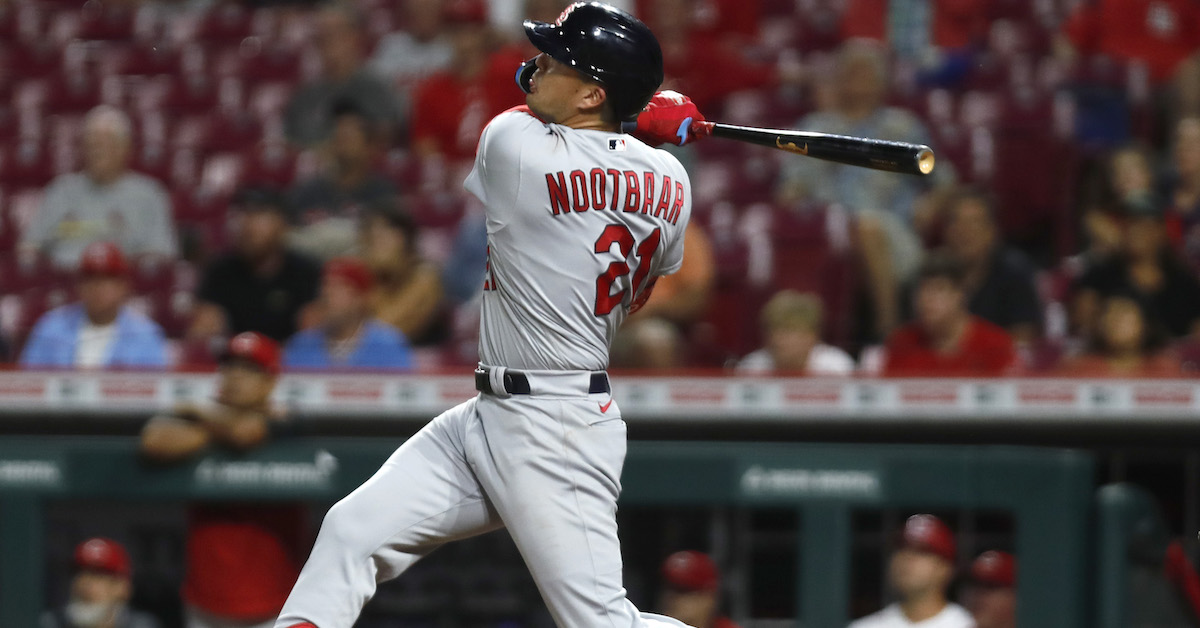
To be clear, this doesn’t mean that players can’t change how hard they hit the ball. It’s right there in the numbers; plenty of players do it every year. My favorite example of this is Lars Nootbaar, who started clubbing the ball when he was already a major leaguer. But if you start out thinking hitters can develop patience or contact more easily than power, you’re probably coming from the right place.
There are some meaningful caveats to this analysis. This data is for major league hitters; robust minor-league batted ball data, perhaps adjusted for level of competition, might show that it’s much easier for hitters to develop power earlier in their professional careers. I also completely ignored anything other than production numbers. A more nuanced look might find different results for some body types or swing shapes. Nootbaar, for example, always looked like he had more power in him; he’s 6-foot-3 and strong.
“You can’t develop power” is the wrong takeaway here; “it’s hard to develop power” is closer to the truth. That holds true whether you’re hunting for fantasy breakouts or trying to sign a free agent. If you’re looking for a major league metric to trust, 95th-percentile exit velocity is a good bet. More so than any other statistic I could come up with, what you see is what you get, and what you see does a good job of telling you how dangerous a hitter can be when he’s at his best.
Ben is a writer at FanGraphs. He can be found on Bluesky @benclemens.
Where did you find EV95? I have been looking for this for the better part of a year, because I’m convinced it is a better measure of raw power than max EV (and certainly more so than average EV). Is there a way to get it on the baseball savant page? Is there a way to convince the powers that be to add it to a table here at FG?
I am assuming Ben is downloading the pbp data straight from Savant and then calculating it from there. If you are somewhat tech savvy the baseballr package can get that data for you.
In all honesty I’ve been meaning to upload the data to my github, I can do that and write a script that gets 95th percentile later this evening if you are interested and not tech savvy
Chris Clegg has found the values:
https://lookerstudio.google.com/u/0/reporting/d1c90230-cafd-4c85-b4c2-f23f6d38816e/page/p_urlxpxhwrc
This is incredible. I wonder if there is a way to collapse it to find career 95th percentile?
Now I’m itching to come up with a CTE70 on the exit velocities (that’s conditional tail expectancy, so it’s the expected value of all EVs above the 70th percentile).
That would be super cool. My level of tech-savvy is approximately “good enough to run other people’s R scripts, not good enough to write them myself”
EVAnalytics has Top 5% and “Next 20%”. Not the same, but also useful.
I’d love to see Ben regress on those two values to see if there’s any meaningful improvement vs. using EV95. Looking at the Chris Clegg spreadsheet Jeff linked above, I think that might be the best way to drop the “noise/signal” ratio in the metric using conveniently captured data – most of the intuitive ball-scorchers stand out in those percentiles, but including that “next 20%” measure should help cull out any SSS-driven outliers getting a deceptively high EV95.
(Though it’s entirely possible that EV95 is indeed the “sweet spot” among these metrics.)
It’s definitely something I’ll bring up, I agree it’d be useful but I do it myself rather than grab it from the site anywhere. To that point: Jeff linked to a page that has it down below, but here’s a very clunky shareable sheet with everyone who had 100 batted balls in a given season on it:
https://docs.google.com/spreadsheets/d/1UtyQ_m7FI1X-R7uUbsYrlFEtvOuV2SQeVcyV8-kwbr8/edit?usp=sharing
If you’re interested in making your own, I also uploaded the code I used to compile my batted ball data to GitHub. It’s in Python and requires you to have downloaded a bunch of Savant data with one tiny modification: create a batter_season line for every batted ball. It’s just the MLBAMID of the hitter plus the year the game was played in. The rest should theoretically run smoothly.
https://github.com/bclemens6/improved-waddle
Thanks much – maybe I’m misunderstanding the shareable sheet but it shows, for example, Nootbar at 115.7 last season when his max EV per his Fangraphs page was 113 (with an EV95 of 108.3 per Clegg’s sheet). Similarly, Varsho’s at 113 on the shareable sheet for 2022, actual max was 110.3, Clegg EV95 was 106.6. But in other cases, like Ohtani (119.1) and Moncada (111.5), the listed EV95 equals their max EV per Statcast. And for all players, the EV95 for 2021 and earlier on the shareable sheet corresponds with their Statcast max EV for those seasons.
Yeah uh, I pasted the Max EV sheet there haha. I updated it to have the EV95 tab instead. Sorry about that.
Edit: I’m slightly off of Clegg for Nootbaar, I have him at 107.4, I suppose I can look into it later.
Ah, that makes sense – thought I was really confused there for a minute! Yes, looks like all of your real 95 EVs are a little lower than Clegg’s, some sort of methodology difference I assume.
I find that I’m usually tempted to comment on this site when I disagree or when I spot an error. It makes sense to also comment positively, so – thanks for continuing to provide excellent content. I really enjoy your insights.
Ben also remains one of the best ever at reporting not only the “wow” results, but the “nothing to see here” results. Both are equally important if you’re doing analysis in a wholistic way.
This is why I would like more journals to follow pre-registration and approval to publish for studies. What was worth trying but did not work is very important along with reporting positive results, I feel. This also would prevent folks from massaging the data to find some ‘result’ to be publishable, only to either not be reproducible or retract later.
Also, the term is holistic por favor.
“Pour Favhore”
Lol, seen it spelled that way so much I actually fell for it too.
(Now afraid I’ll soon type “it’s” for the possessive pronoun even though that’s one of my peculiar pet peeves 😉 )
Ben is my number-one “most-shared” author here at Fangraphs, and has been for a while.
I like EV95 because it eliminates outliers like Myles Straw’s 109.8 Max EV in 2021. He never came close to that again. I just wish it was more easily available.
This is why I like it too. Manny Machado had a 119.6 MPH scorcher in 2021; his high in every other year was something like 3 MPH below that; his high last year was only 112.4. Meanwhile, Pete Alonso’s Max EV for his career is 118.4, but he’s had roughly that as a Max EV in his first 3 years in the league (118.3, 118.4, 118.4). So who has more raw power? I’m pretty sure it’s Alonso, but career high distorts that pretty badly.
I’d honestly even be fine with 98th percentile.
Here’s some other ones:
Enrique Hernandez hit a 118.1 MPH ball back in 2016. The Max EV the year before that was 109.2; the year after was 111.5.
Amed Rosario hit a ball 115.8 MPH this past year. His high before that was 111.5 MPH.
Martin Maldonado hit a ball 115.6 MPH way back in 2016. His highest taken from every other year was only 110.4.
Johan Camargo’s max career EV is 114.4. That’s in the same ballpark as guys like Christian Walker and Joc Pederson and Daniel Vogelbach. But Camargo’s second highest EV was 109.6.
I don’t pretend to know whether these examples are something really freaky that happened with an adrenaline rush or if it’s just measurement error, but Max EV is clearly weird.
Michael Bourn had a 456-foot home run about a decade ago (Jeff Sullivan wrote about it here). Love to know what the EV on that was.
I like the Machado/Alonso example because it isn’t just about comparing a slapstick hitter to say Aaron Judge. This is more like comparing Bob Beamon and Carl Lewis as long jumpers…Lewis’s max stands no chance against Beamon’s, but looking at an “LJ95” metric would probably make for a more meaningful discussion.
Some updates on this, now that Jeff Zimmerman provided a link to the percentile values by year.
In 2021, Manny Machado hit a ball 119.6 MPH, per Statcast. His 99th percentile was 113.2.
In comparison, Vladimir Guerrero his a ball in 2021 that was 117.4 MPH. His 99th percentile was 116.31.
If you sort by 99th percentile or 95th percentile, you get a pretty good sense of what raw power looks like. Stanton is on top, with clear, obvious 80-grade power, with Oneil Cruz, Aaron Judge, Shohei Ohtani, and Vlad Jr somewhere behind him. Joey Gallo and Aaron Judge used to be higher–Judge had a 99th percentile of 118.85 when he first hit the league, and Gallo was at 116.15, but it looks like they’re just not swinging as hard. I think this is intentional on Judge’s part, not sure about Gallo.
This largely aligns with a common sense understanding of raw power. Stanton remains the benchmark for the 80-ist of 80 raw power, with Cruz, Judge, Vlad Jr, and Gallo (in the past), getting comparatively close to that benchmark. You could make an argument for any of them as being 80s or 70s, especially if you think someone like Judge is intentionally not swinging hard right now. Ohtani is probably more of a 70, along with Yordan Alvarez, Alonso, Miguel Sano, Jorge Soler, and Nelson Cruz (in the past).
It’s amazing that these measurements are so consistent that player performance is repeatable and outliers are rare, but at some point we have to remember that these measurements may not all be 100% accurate.
Some of the outliers mentioned in this thread are probably real, but another reason why 95th percentile exit velocity is more reliable than max exit velocity is it moves less in response to an erroneous point or two.
I’m glad there was the caveat about this data being for major league hitters. It seems like a lot of minor leaguers with contact develop power (morr doubles guys becoming homer guys), but I’m not sure if that is an increase in EV95 with age, better plate discipline, or changing swing to get more hard hit balls at optimal LAs.
I think it’s mostly about physical maturity and the fact that strength often doesn’t fully peak until the early or mid twenties. Ben’s example about Nootbaar gaining power is a good example – he made his improvement in his age 24 season, which is around the upper limit for an “organic” improvement in physical strength and EV95.
Indeed.
Minor leaguers can get pretty high up the latter before developing their full hitting potential. Some need to improve approach, swing, or contact. But some also boost their power.
A classic example is from the mid 90’s Cleveland farm.
They had a tall infielder that was a doubles and contact machine up to AA. Had a cup of coffee in sept and the family showed up. John Hart saw his father and brothers and sent him to AAA to learn to pull and loft the ball.
It took.
600+ Hrs later Jim Thome made the HOF.
Perfect example.
Another good one is Christian Yelich working with Barry Bonds on the very same thing, though the lessons didn’t fully take hold till Yelich was in Milwaukee.
Sometimes you have catchers like Yadier Molina who first establish themselves in the Majors defensively and then develop offensively later on.
Or shortstops like Ozzie Smith.
Although Ozzie Smith never hit for power. Like, at all. Ozzie Albies hit more homers in 2021 than Ozzie Smith did in his entire career. Ozzie Smith developed offensively by learning to walk 2-3x as many times as he struck out.
Thought about Ozzie when looking at Willie Randolph’s numbers the other day. They happen to be the only two players post-dead ball era with over 60 WAR and WAR > career home runs. Ozzie basically developed Randolph’s table-setting skills while in the majors (Randolph had those throughout his minor league journey).
And Ozzie has a career WAR/HR ratio well over two. Not even notorious slapstick hitting star Richie Ashburn breaks that ratio (57 WAR vs 29 HR).
Ozzie also has the second fewest career home runs (28) among position player Hall of Famers who played after the Dead Ball Era. He’s only beaten out by one by Lloyd Waner, arguably the most unqualified selection in MLB Hall of Fame history.
I think Ozzie Smith was a Hall of Famer for sure but I’ll tell you what, if he were playing today pitchers would just throw the ball right down the middle of the strike zone and dare him to hit it. You can’t get by with 20 grade power like that anymore.
Of course, maybe if Ozzie Smith was playing today he would have stacked on an extra 30 pounds of muscle and would be blasting 20 homers a year, a la Lindor. These counterfactuals can get weird.
In that case, he’d have probably hit over .300 a lot more often than he did, just trading walks for singles and the occasional double or triple. He was still a very good contact hitter despite his lack of power.
Is EV95 neatly available anywhere or is it something I’d have to pull and scrape for? Been wondering this for a while and this seems as good a place to ask as any
Great work, as always! Can we get EV95 added to the leaderboards?
This would probably be a bit harder to put on there than Max EV for various reasons…but it would be so much more useful!
I wish we had some Statcast data on ’96 Brady Anderson
Frank Thomas is the guy for me.
There were other guys who looked more graceful, like Pujols and Griffey. But I aside from known steroid guys there’s not a single guy who was that terrifying at the plate. He must have hit multiple home runs more than 450 feet. Pitchers did their best to stop giving him stuff to hit and it just didn’t matter.
Maybe also Darryl Strawberry; he hit the roof of the stadium in Montreal once.
Jim Rice during his early years (1977-79). I think the Green Monster settled out of court with OSHA for the pain and suffering caused by Rice’s wall-ball singles and doubles during these years.
Ben, I enjoy your work, but I think there’s a pretty major statistical error here. By definition, 32% of data should be outside of 1 SD. If you’re finding that the percentage of data outside 1 SD is different from that there’s only two possibilities: you’ve made a calculation error, or more likely your data isn’t Gaussian (for these stats I would imagine substantial skew). If your data isn’t Gaussian then standard deviation isn’t telling you what you think.
If I’ve misunderstood your methods, my apologies, but I’m pretty sure your table of “%Changes > 1 SD” is just a measure of the non-Gaussian nature of those stats, not a measure of year-to-year consistency.
That was maybe unclear, but that column represents what percentage of hitters *change* their reading of that stat by more than one standard deviation from one year to the next, not anything about the distribution in a given year. It’s more a measure of volatility than anything else.
As a quick check of normality, I looked at 2022 MaxEV. The average was 110.8, SD was 2.96, and 29.7% of hitters were either below 107.84 or above 113.56. So maybe not perfectly Gaussian but pretty close.
Cool, thanks for the explanation
A Ben Clemens article is always worth clicking on.
I’m surprised you chose Nootbaar as the exemplar of improved EV95 as I don’t think he registered 100 batted balls in 2021 (unless foul balls counted). Would you be so kind as to cite a player from your analysis who improved this stat from one year to the next with two comparable sample sizes? Preferably at least 300 PAs in each year?
Sure thing. The biggest change in 95th percentile EV from one year to the next since 2015 is Ketel Marte from 2016 to 2017; he went from 101.75 to 108.17. He fell slightly short of that 300 PA threshold though. Next on the list is Corey Seager from 2019 to 2020, same deal, just short of 300 PA in 2020. Austin Meadows from 2018 to 2019 is another example, again short of the PA in 2018 though he had minor league data there. The biggest changer with big samples in both years was Jonathan Villar from 2018 to 2019 (515 and 714 PA, respectively), who improved his EV95 by 3.5mph.
Much obliged. Seager’s jump is even more noteworthy coming off the juiced ball. Meadows and Villar the opposite.
And the Ketel breakout proved legit.
Might a U-test of EV dataset for Years X and X+1 be a better measure of “significant increases” in power?
Can someone explain in simple terms, why EV95 is a better predictor of future performance than average EV? Or, maybe asked a different way, what are the downsides of looking at average exit velocity?
I’m pretty sure it’s because Average EV includes all the softly hit bunts, weak grounders, pop-ups, broken bats, soft flares, etc. that clearly aren’t representative of a player’s pure power when he makes solid contact.
But if we’re looking at using an exit velocity metric as a predictor of future performance, then why wouldn’t we want to include the softly hit balls? Some players have the capability to hit the ball hard, but don’t do it often enough. Couldn’t EV95 suffer from the same downfalls as max EV, just to a lesser extent?
I personally think they would point towards two different skillsets, and each have their own value / tell their own story.
Let’s look at Jeff McNeil. His average EV last season was 86.9, which ranks in the 12th percentile of all of baseball.
His max EV was 110 (62nd percentile), and while I don’t know his EV95 number, I would guess that would land around 106~7 and come in higher than the 62nd percentile.
Both are true reflections of the two clear and distinct kinds of hitter he is; the low average EV highlights his propensity to casually knock a single through the vacated hole on the left side on the infield. The maxEV highlights his ability to turn on a pitch and rip it down the line for a hard double. If we had EV95 at our disposal, we would be much more inclined to believe that his relative high maxEV rates are not just smoke and mirrors.
We’re only using it as a predictor of future exit velocity and power, not performance as a whole. Only indirectly are we then using it to try and identify sleeper/breakout candidates.
Plus, there’s naturally a lot more variance in the exit velocity of weakly hit balls.
It is better to hit some balls really hard and some really soft than to have a tightly packed grouping of EVs for the same average EV.
Does this mean that Average EV and STD Dev would give a similarly useful picture if EV 95 isn’t easily available?
Yes, Ben did a nice job of that, didn’t he!
The way I think about it is this: it’s a linearity problem. Averages work well for linear things, but the translation between EV and production on contact is not linear. Balls hit 84-86 mph produced a .175 wOBA in 2022, 94-96 mph produced a .286 wOBA, and 104-106 mph checked in at .819. So for production, you’d prefer an 85 and a 105 to two 95’s.
As a result, average EV can be an unreliable measure because the distribution is really important. If the translation from EV to wOBA (or whatever production metric you want to use) was linear, average EV would be much more useful than it is.
But isn’t it possible for a player to rate well in EV95 (ex. he hits the ball 105 mph approximately 5% of the time and 85 mph the other 95%) and not be that good of a hitter? In this example, it’d be better to hit the ball 95 mph every time. I’m guessing that a player like Sam Hilliard (sorry to pick on him) would score pretty well in EV95 but historically, he’s not been that great.
I doubt you’d get that kind of a “barbell” shaped EV distribution in real life. But…you might get a player being a poor hitter despite a high EV95 if other factors are considered. For example, if the majority of a player’s hardest-hit balls are grounders, and the lower EV balls are opposite-field fly balls, they’re probably not getting either a good BABIP or much benefit of a high top-end EV on their ISO.
So I think it is possible, but from a different source of variation.
I don’t have the stats, but imagine a Jared Kelenic might have a very pretty EV95, and thus far, justifiably terrible performance. His max EV was 77, AVG EV only 20th percentile in 21. Max EV was 94th percentile in 22, in a very small sample.
In your example (105 mph approximately 5% of the time and 85 mph the other 95%), the hitter has an Average EV of 86, not 95.
If you want to compare apples-to-apples, a hitter with an average EV of 86 will do much better hitting the ball 105 mph 5% of the time (and 85mph the other 95% of the time) instead of hitting the ball 86mph every time.
If non-linearity is the problem why not compute some expected Whoa Ba based on EV distribution rather than using EV95? Is EV95 easier to obtain?
Yes, and it’s also easier to calculate.
What does lasd mean?
That’s launch angle standard deviation, a stat Alex Chamberlain turned me on to that basically measures how consistently players make contact. Freddie Freeman is the best player in baseball at it, for example, and Luis Arraez is right up there too.
I’m going to be of no help other than to say how awesome this and other Ben articles have been. I also wonder when EV peaks and whether a player loses bat-to-ball skills earlier or later. Even more irritatingly I wonder whether this is any better information for pitchers than average and max EV.
How does Joey Bats fit into this discussion?
Is the data z-scored?
Kwan for example should add EV over the next 3 years and any MLB veteran should add 95%tile EV over their next 3 seasons or they will be replaced.
Kwan is what he is: an old school table setter.
Any changes to his game need to be carefully thought out at the risk of disrupting what made him successful in ’22.
There are plenty of historical examples of players who.lost what made them useful by trying to be a different kind of player, both in trying for power and in trying for higher averages.
love the article and wow there sure re some smart members based upon their comments and insight. I understand the harder you hit the ball the better chance of success as a hitter. EV with drives to outfield and liners and hard grounders hit same EV have various outcomes including Launch Angie…I think. But what is the range of EV on infield pop ups? Does a higher pop up mean more EV?
I was stunned by some of the numbers during a quick glance at the EV numbers. Just a couple are astonishing. Jose Altuve all the way down at #403 for average EV was probably #1, after all he hit another 28 HR, and on the other end, or at least above the median, was Luis Arraez? You would look at that and think Altuve took full advantage of the Crawford Box’s but he hit more HR’s on the road, so out the window goes that idea. Maybe he just hits his pitch, when he gets it, really hard but that wouldn’t account for his .300 BA and lifelong success at all phases of hitting. Luis Arraez is very compelling. He is #190 in EV but #434 in 80th percentile EV which defines him perfectly. Tremendous solid contact but with no power. It is interesting to note that the only players near his 88.97 average EV in the 80th percentile are Brett Phillips and Yewin Diaz whose numbers are skewed because they seldom make contact. You have to go to Andrew Benintendi at 356, who has abandoned any power he once had, and another whiff machine in Cody Bellinger at 348 to see player who exceed Arraez’s 80th percentile EV.
Really enjoyed this article, but would slightly dispute the conclusion that it’s easier to develop contact ability than to develop power. Your definition of power is EV95, when actual power would be more like ISO/SLG/HR rate/etc. Actual power is some combination of exit velocity, launch angle, and spray angle. My (considerably less rigorous analysis than yours) concluded the opposite. Low-power, high-contact hitters (Jose Altuve/Justin Turner types) were more likely to develop power through optimizing spray/launch angle, than having high-power low-contact sluggers suddenly maintain an elite strikeout rate.