You’ll Never Guess What’s Happening in Spring Training
Everyone knows not to make too much of spring-training numbers. This is a time for everyone to be optimistic. Good results are signs of improvement; bad results are to be dismissed because, come on, the games don’t even count. No one takes this time of year too seriously. Not even the players! But especially the fans. Look around. The current league leader in batting average is Mike Freeman. The current league leader in OPS is Billy McKinney. The current co-league leaders in at-bats are Raimel Tapia and Sam Travis. The Marlins, at 7-4, have a better record than the Nationals and the Dodgers. This is all practice. It’s practice, with the pointless quirk of keeping score.
But a funny thing happens when you have enough high-level baseball players playing enough practice games. As noisy as all the individual numbers are, when the sample size gets large, you can start to see real signal. Even in spring training, baseball has a way of finding its level — spring numbers often predict what we’ll see league-wide the subsequent summer. As such, I’ve gone in to investigate, because I’m impatient. This year’s spring training is roughly 40% complete. The league is past 15,000 total plate appearances. What might we be able to tell about the 2018 regular season? The answers might surprise you. (They will not surprise you.)
I’ve only put this together now because, well, the data is out there, and I wanted to play with it. Of course it would be more useful to do this in three weeks. It’s always better to wait for more information. I didn’t wait. That introduces some extra uncertainty, but we can just keep that in mind. This is just taking a glance. Already, the data backs up what we would’ve imagined would be the case.
There are a bunch of images to follow, stretching from 2006 – 2018 for spring training, and from 2006 – 2017 for the regular season. These are plots of league-wide rates, and, for the regular-season lines, I’ve included only non-pitchers, since pitchers mostly don’t bat in the spring. To kick things off, here’s a look at walk rates.
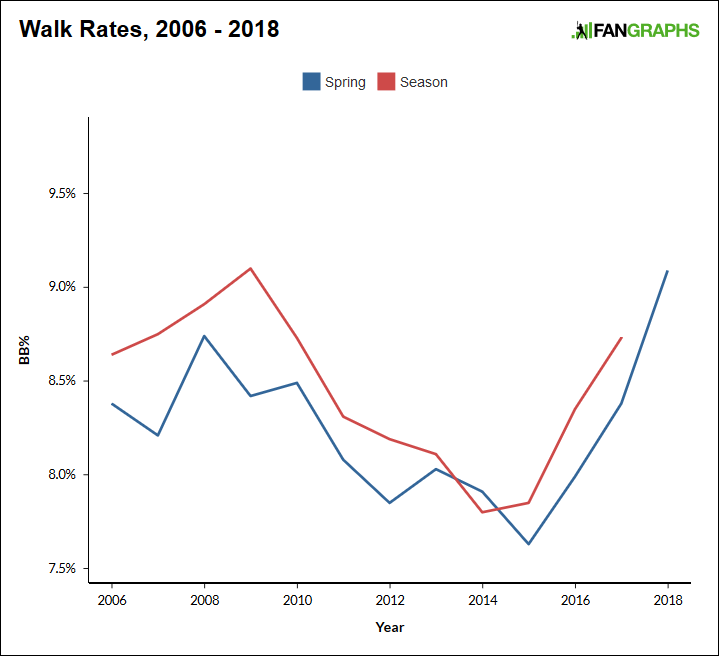
The thing you’ll notice in so many of these plots is how the two lines mirror one another. That’s important; if they didn’t mirror one another, there wouldn’t be a point to investigating spring-training results in the first place. The whole idea is that spring, on the league scale, can be predictive. So what do we have here? Right now, there’s a spring walk rate of 9.1%, which is the highest in the sample. It’s up from last spring’s 8.4%, which was up from the previous spring’s 8.0%. Because it’s still early, conventional wisdom suggests the pitchers might be rusty. Rusty pitchers might walk more batters. So, yeah, that’s of course one consideration, but what this suggests is that regular-season walk rate could rise again. Last year’s rate was the highest it had been since 2010.
Moving on! Now the same plot, but for strikeouts.
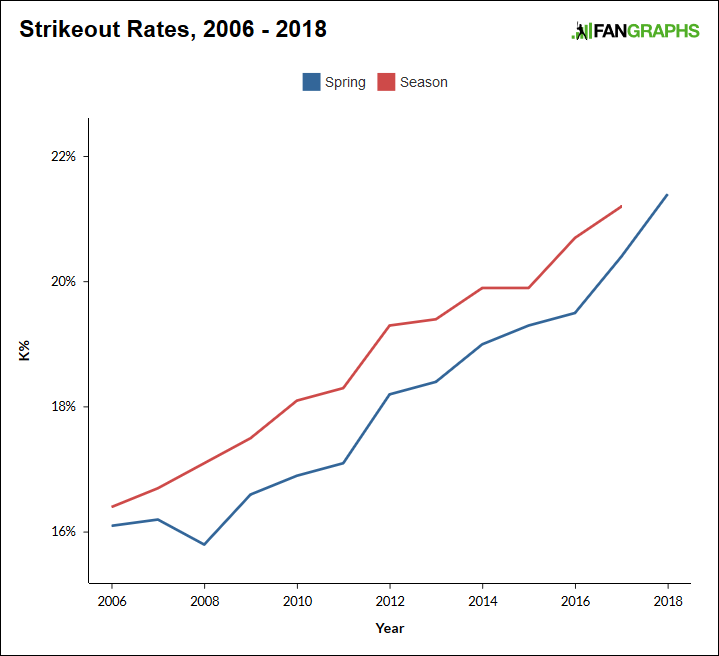
Have I already told you how unsurprising the numbers look? The numbers I found are unsurprising. Strikeout rates continue to rise, right? So far this spring, compared to last spring, the strikeout rate is up an entire percentage point. Last spring, compared to the previous spring, the strikeout rate was also up nearly an entire percentage point. This is the counterargument to the idea of pitchers being rusty — if they’re rusty, well, they’re still getting their whiffs. I don’t know what’s supposed to slow down the strikeout trend. We’ve been given zero reason to believe the trend was about to stop. Indeed, this spring so far suggests we’re in for yet another strikeout hike. And, well, why wouldn’t we be? That’s modern-day baseball.
The big thing you might be wondering about is the home run. I’ve calculated the rate of home runs on contact. Is there any hint of the home run flattening out, or going back down? Well, no, don’t be silly. The home run is back, and then some!
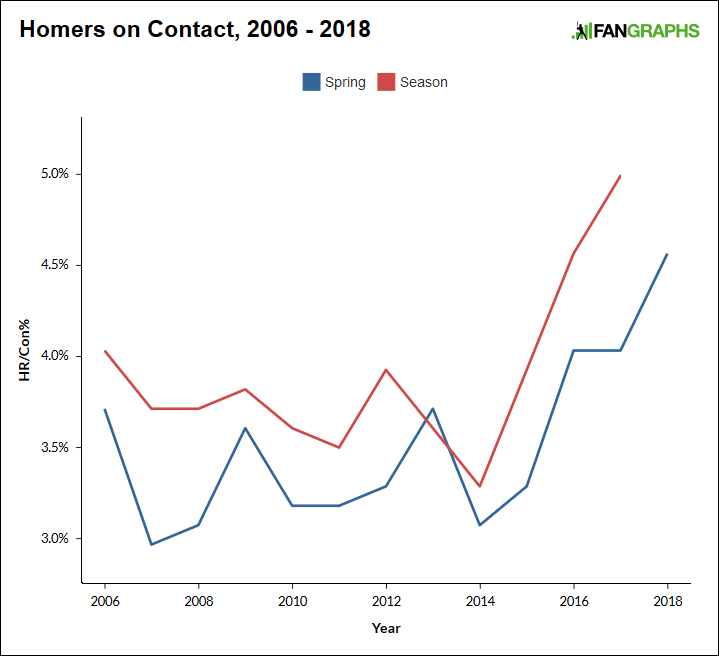
You can see the explosion around 2015. That’s been exhaustively documented, and one thing to keep in mind is that the home run took off around midseason 2015, so, in spring training, they were still playing under, shall we say, the previous conditions. The spring rate reached a new high in 2016, and then it edged slightly forward again in 2017 (not seen in the plot because of rounding). As for 2018? We’ve seen a massive spike. Technically, this rate is up only half of one percentage point, but, to put it differently, the spring homer rate in 2018 is up from the spring homer rate in 2017 by 11%. An 11% increase in home runs! Once again, I don’t know why anyone would expect the league-wide homer rate to stop increasing. That would probably require a change to the ball, and no changes, at least publicly, have been implemented. The earliest possible sign is that the league will again establish a new home-run record.
This is all kind of interesting, because it might provide a window into the future. It’s also kind of not interesting, because we sort of assumed the future already. Walks up, strikeouts up, home runs up. It’s like saying the planet is going to get warmer. Nothing at all ground-breaking; it’s just fun to see how even random spring-training rosters can foreshadow the regular season. While I’m here, I’d like to show you three more plots. These are maybe less meaningful, but I still find them sufficiently notable for inclusion. This first one is annoying, but bear with me. I can’t find anywhere that has basic spring-training batted-ball rates. All they have at MLB.com are ground outs, and air outs. This works only as a half-decent proxy, but anyhow, observe the ratio of outs on the ground to outs in the air.
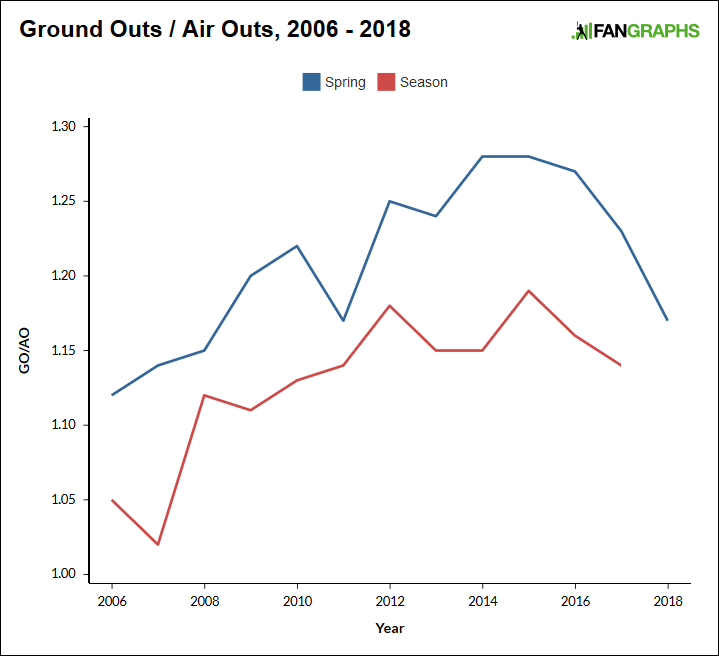
I’m operating under the assumption that out rates themselves haven’t budged too much, whether a ball be on the ground or in the air. Spring-training BABIP — and, for that matter, regular-season BABIP — have hardly moved. So, the early sign here? More air balls this spring. We’ve been waiting to see a fly-ball increase, since people started talking about swing changes. There’s the faint whisper of something happening. To be monitored. Right. How about sac bunts?
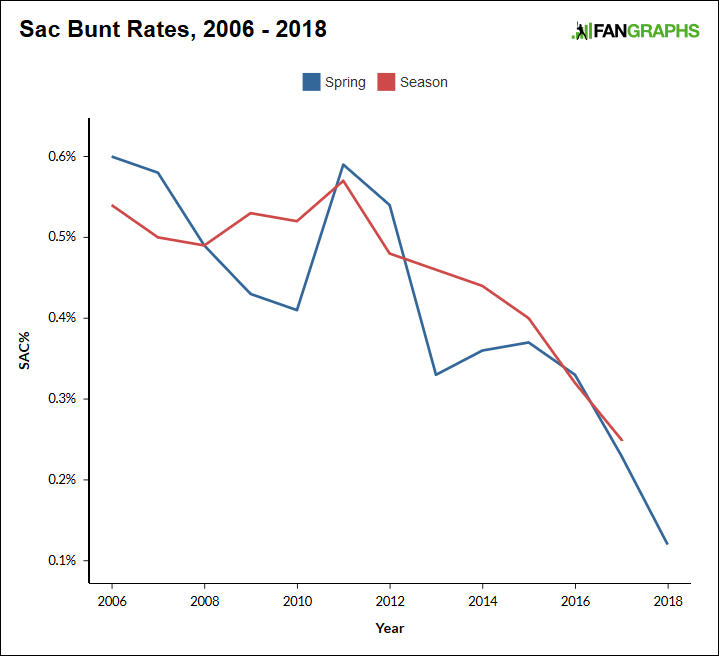
You knew this, but the sac bunt is dying. It’s not dying among pitchers, because pitchers can’t hit, but among non-pitchers, hardly anyone bunts anymore, unless it’s for a single. Compared to 2016, the sac-bunt rate last spring was down 30%. And, compared to 2017, the sac-bunt rate this spring is down 50%. This isn’t just about sabermetrics pointing out how bunts are often wasteful. Hitting is harder than ever before, and making contact is harder than ever before, and more batters are dangerous now than ever before. Just about everyone in baseball is capable of hitting at least ten homers a season. And there are also fewer bunt opportunities in the first place. The sac bunt is dying for a variety of reasons. But it is surely approaching its death, among hitters who are able to hit.
At last, there’s the matter of hit batsmen.

I have no idea what to do with this. Maybe it’s all just noise. Maybe it’s a reflection of league-wide pitcher rust. But right now, this spring, the hit-batter rate is up 32%. Last spring, there were 396 hit batters. This spring, we’re on pace for 524. I have no idea why this would skyrocket, but if it does skyrocket, in the regular season, don’t say you weren’t warned. Spring training was right there, and it was trying to send you a message.
Jeff made Lookout Landing a thing, but he does not still write there about the Mariners. He does write here, sometimes about the Mariners, but usually not.
Increased velocity?
Drat, wrong again. Yet still exceeded expectations, Jeff.