Archive for January, 2006

Daily Graphing – Ryan Freel

A little over a month ago, the Reds signed Ryan Freel to a two year, 3 million dollar contract. In his second full season, the utility man bat .271 with 36 stolen bases which is almost exactly what he did in his first full season. He probably would have stolen a few more bases, but he was slowed by a toe injury and missed some time with a knee injury that required mid-season arthroscopic surgery. Next year, he should have the second base all to himself; let's see if we can figure out how he'll do.

BBP

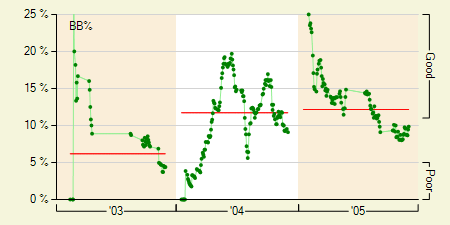
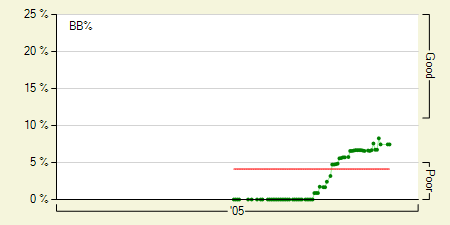
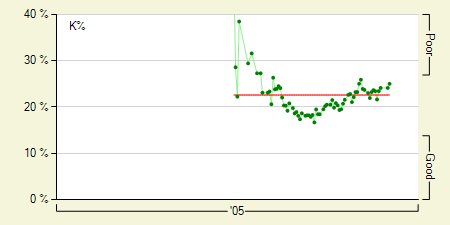
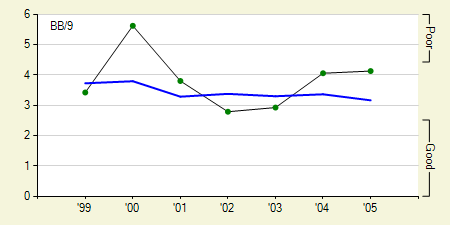
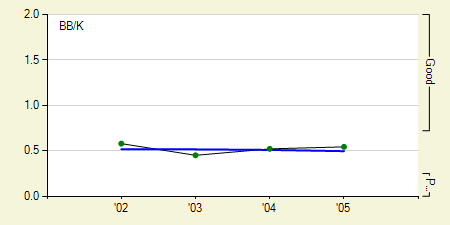
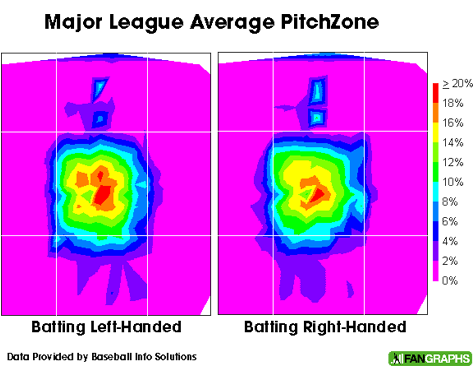
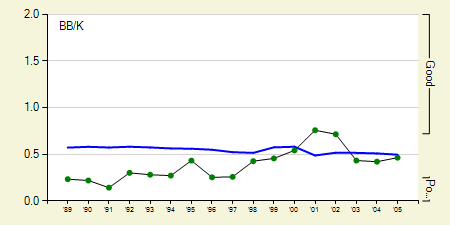
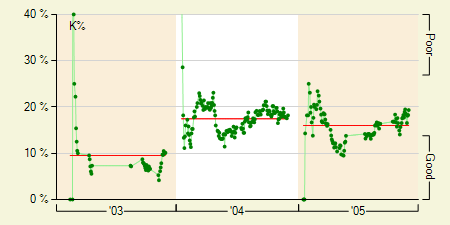
One thing that Freel is certainly no slouch at is taking a walk. He was actually one of the best at differentiating strikes from balls in 2005 as he only swung at pitches outside of the strike zone about 10% of the time. To put that into context, 20% is about the about average with upwards 35% being the most anyone will swing at pitches outside the strike zone. When he did decide to swing the bat he was a pretty good contact hitter, striking out in only 17% of his at-bats. Just under half of those strikeouts were done so looking, so it might do him some good to swing the bat a little more often considering when he did, he made contact a very good 93% of the time.

KP

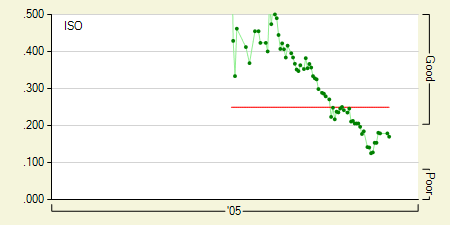
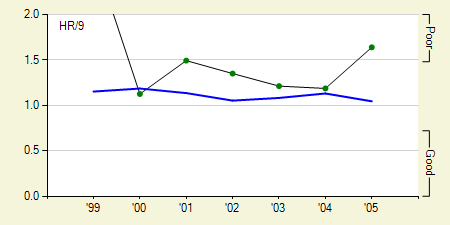
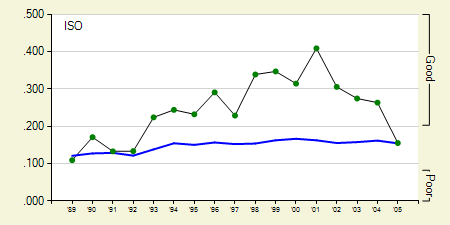
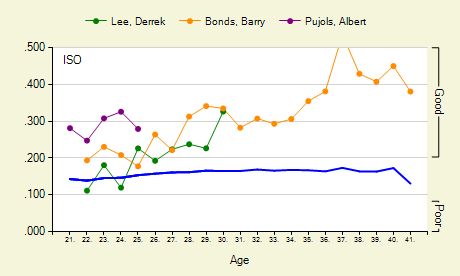
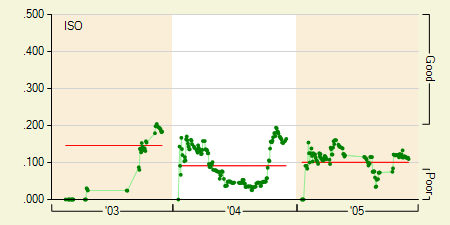
Looking at his isolated power (ISO), I wouldn't expect any more home runs, but whatever he lacks in power he makes up for in speed. He was right up there with the top base stealers in terms of the frequency he attempted to steal and he was successful in 78% of his attempts. If he was healthy the entire season, it wouldn't have been a shock to see him near the top of the stolen base leader board.

ISO

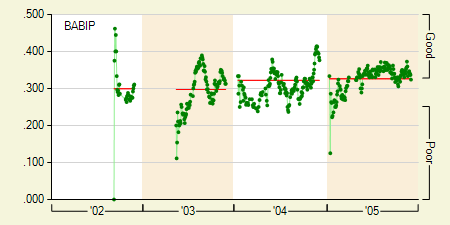
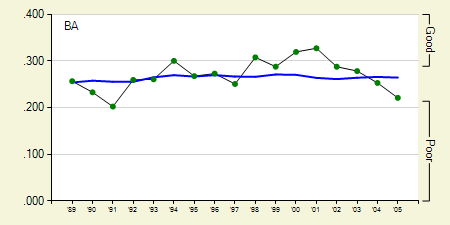
That's one of the biggest knocks on Freel, his durability is definitely something in question. If he can stay healthy, I'd expect him to have a real breakout year with improvement in both his batting average and his stolen base totals. With a little luck, I think his excellent batting eye gives him the potential to bat near .300 and as long as the Reds continue to let him run (he stole 5 bases in one game), I think he'll be able to top 40 stolen bases easily. If all that comes true, looks like the Reds got him cheap!


Daily Graphing – Jeff Francoeur

I feel like this Daily Graphing column has been a bit too bullish recently, so after trolling the FanGraphs database I settled on writing about Jeff Francoeur. After being called up in mid-July from AA, Francoeur went on an absolute tear batting .402 with 8 home runs in his first month in the majors. After that it was pretty much all downhill as he finished off the season batting just .252 with only 6 home runs in his final 200 plate appearances, bringing his season average to an even .300. Let's see if he's really the .300-plus hitter he started off the year as, or if he's closer to the .250 batter he was to close the season.

BBP

Oddly enough, he didn't have a single walk until August 21st and that wasn't even a “real walk” since it was intentional. His first major league, bona fide walk came three days later on August 24th when he faced Mark Prior in his second at bat. He started off taking a slider outside and then fouled off two fastballs. Down in the count, the odds were against Francoeur, but he managed to hold back on a high fastball and an outside fastball to bring the count to full. Finally, Prior threw a hard slider down and outside and Francoeur didn't swing! The crowd would have gone wild, except it was a home game for the Cubs.

KP

If the story had a happy ending, I'd say it was all smooth sailing after that one walk, but he only managed an additional 7 unintentional walks in his next 133 plate appearances. That's a lowly 5% walk rate; 6% if you include the two unintentional ones. Now, this wouldn't be too much of a problem if he was a great contact hitter, but he's not. He strikes out about 22% of the time, which is worse than average, bringing his walk to strikeout ratio (BB/K) to an awful .19. Also note his power numbers took a steep dive after his initial surge.

ISO

Considering Jeff Francoeur's microscopic walk rate and his not so great strikeout rate, I'd say there's not much chance he'll bat over .300 and repeat his rookie season. His major league batting average really was out of whack compared with the time he spent in the minors where he never batted over .300. Expect the type of numbers he put up after his hot start and remember his first month as something rather phenomenal, but not something that'll soon be repeated.


Daily Graphing – Ted Lilly

The past three seasons I've ended up rostering Ted Lilly in my fantasy league. How has he rewarded my loyalty (stupidity)? With nothing but disappointment and a firm place on my bench (sometimes he was kicked off the bench). Anyway, he has agreed to a one year, 4 million dollar contract with the Blue Jays after an injury ridden 2005 season. Between his trips to the DL (shoulder & bicep tendonitis) he went 10-11 with a 5.56 ERA. Let's see if there may be better days ahead for the oft-injured lefty.

K9

The good news is he can still strike people out decent amount. His strikeouts per 9 innings (K/9) of 6.84 aren't too shabby for a starting pitcher. He was even able to wrack up two 8-strikeout and one 10-strikeout performance in 2005. If healthy, hopefully we'll see a few more of those which would bump his K/9 over 7, like it was in 2003 and 2004.

BB9

His walks per 9 innings (BB/9) over the past two seasons leave much to be desired, but his 2001 and 2002 numbers do give us a glimpse of what he's capable of. I'm sure his injuries played a part in his increased BB/9. Combine all those free base runners with his elevated home runs per 9 innings (HR/9) and you've got a recipe for disaster, hence the ERA well over 5.

HR9

His HR/9 should be a little better next season since his home runs-per-fly ball (HR/FB) of 13% should regress back towards the 11% league average a bit. However, it's probably unrealistic to expect him to suddenly have a good HR/9 since he's never had one and he's nearly an extreme fly ball pitcher.

If Ted Lilly could pitch an injury free season (and right now that's a big if), I'd say you'd be looking at a quality pitcher with 15 win, sub 4 ERA potential. His strikeouts are just fine and he has age on his side as far as walks go since pitchers tend to walk fewer batters as they get older. Even if he's not 100%, it's unlikely he'll do as poorly as last season. Knowing me, I'll probably take chance on Lilly once again and I can only hope fourth times a charm.


Daily Graphing – Coco Crisp

The Red Sox and Indians are apparently close to completing a deal that will send Coco Crisp and David Riske to Boston in exchange for Andy Marte, Guillermo Mota, and Kelly Shoppach. The past two seasons Coco Crisp has been quite good, batting essentially .300 with a combined 31 home runs and 35 stolen bases. Consider it the two year approach to 30/30 (hey, not everyone can do it in one year!). He also managed to wrack up 42 doubles in 2005, which puts him 18th on the leader-board. Assuming this trade gets completed; let's see how he'll do in Fenyway next season.

BBK

His walk to strikeout ratio (BB/K) isn't too shabby as it climbed to just above league average last year. His problem isn't so much striking out as he only does so 13% of the time (which is good), but he doesn't walk all that often. Essentially he puts the ball in play a lot which isn't necessarily a bad thing considering his fairly high batting average on balls in play (BABIP) of .326. Furthermore, it looks like his BABIP is really starting to settle in around .325, so I wouldn't consider either his 2004 or 2005 season lucky.

BABIP

Being a switch-hitter, he was much better batting left-handed in 2005, but historically he's been better batting right-handed. I'm not entirely sure what's going on with that, but looking at his PitchZone chart, you'll see that he just couldn't muster a hit with balls up-and-in or down-and-in when batting right-handed. Batting left-handed he has some trouble handling pitches down in the zone. In general, it looks like he prefers pitches up in the zone and as a result, has a tendency to chase high fastballs. Other than that, there's not really any glaring weakness that I can see.

PitchZone

If Coco Crisp walked a little more he'd be the perfect replacement for Johnny Damon since he'd be able to bat leadoff too. Either way, he's a good bet to bat .300 again, but don't expect many stolen bases since the Red Sox were second to last in stolen base attempts. In the home runs department, his isolated power has been on a two year rise, so he should be good for at least 15 home runs, possibly closer to 20. I really like Coco Crisp and at only 27 years old, I think he'll continue to get even better.


Research – Palatable PitchZones

In the past week I've gotten some really great feedback on the PitchZone charts. In the hopes of making them more accurate and just simpler in general, I've revised them to be just a 5×5 grid, with the 9 boxes in the center being the strike zone. Remember that these are the percentage of all pitches that become hits for each box. Here's the major league average:

PitchZone

I also got a lot of requests to break them out the four different pitcher-batter match-ups. Here's that:

PitchZone

And finally, let's take a quick look at Abert Pujols and Vladimir Guerrero:

PitchZone

Guerrero is pretty scary. I'm pretty happy with these, so they'll probably start showing up occasionally in Daily Graphings for batters. Next up, I'm going to start looking at contact rates, swing percentages, and BABIP by pitch location. Then of course, there's the pitcher's side of things which I have a feeling is going to be a lot more complicated.


Daily Graphing – Bronson Arroyo

The Red Sox and Bronson Arroyo have agreed to a 3 three 12 million dollar contract. After Arroyo started off the year great going 4-1 with a 3.18 ERA in 9 starts, everything seemed to fall apart. Over his next 23 starts he was 10-9 with an ERA over 5. Let's see if we can figure out what happened to Arroyo and if there's a chance he'll rebound in 2006.

K9

Starting off with his strikeouts per 9 innings (K/9), it looked like he was finding his groove around mid-May, but took a serious nose dive shortly after. In 2004 he displayed a very solid K/9 of 7.1, but in 2005 he could only manage a poor K/9 of 4.3. What exactly happened here?

PT

If you break his 2005 season down by pitch type, you'll see that he started off the season throwing his changeup pretty much never, to throwing it nearly as much as his curveball and slider. Funny thing is, his changeups started to ramp up right around the same time his K/9 fell off a cliff. Coincidence? Probably not.

Furthermore, his changeup, with the exception of his fastball (which he throws a lot), was his most hittable pitch. When he started throwing more changeups, he also ended up throwing less sliders and curveballs, his two least hittable pitches.

BB9

It seems as though a lot of Arroyo's problem could be a pitch selection issue. His walks per 9 innings (BB/9) look pretty good too, so if he can manage to work on his changeup and get his strikeouts back to where they were in 2004 there's not a bad chance he'll be a pretty decent pitcher.


Research – PitchZone

There were nearly 700,000 pitches thrown during the 2005 season and Baseball Info Solutions tracked pretty much every single one of them. Whether it be location, speed, pitch type, or the result of the pitch, there's data on all of them. The real question is, what the heck is anyone to do with all this data? There's probably thousands of ways you could try and tackle this “pitch data”, but I was particularly interested in trying to see if I could visually display a batter's coverage of the strike zone.

What I decided to do was put a grid over the strike zone and see the percentage of pitches thrown to each section that became hits. I'm calling these charts PitchZone charts. For starters, let's take a look at the major league average for left-handed and right-handed batters. The box in the very center is the strike zone and the color code represents the percent of balls thrown to each area that become hits.

PitchZone

The results are not really surprising at all. As pitches get closer to the center of the strike zone, they become more hittable. I'm sure you already knew this (or at least suspected this), but now you can see it. The next step was to take an individual batter's pitch data and make it into a PitchZone chart. Let's see how good Albert Pujols is at covering the plate. Please note the scale change; instead of 20% being red, 50% is now red.

PitchZone

Pujols covers the strike zone extremely well. The only area that it looks like he's not able to cover is down and inside (the pink area in the bottom right corner of the strike zone). Throw the ball right over the center of the plate and there's a near 50% chance Pujols is going to get a hit. For comparison sake, let's see what a not so great batter looks like. Here's Corey Patterson (my current whipping boy):

PitchZone

Doesn't look nearly as good, does it? Patterson appears to have a lot of gaps in his swing. Additionally, you can compare each player's PitchZone to the league average to get charts that show you which areas a batter excels. Here's Pujols against the major league average for right-handed batters. Please note the scale change again as this is now percent over or under league average.

PitchZone

To no one's surprise, Pujols is league average or better in just about every area. Patterson on the other hand (compared to other left-handed batters) is worse than league average in a lot of spots and only better in a few select areas. It looks like he might be ok at handling pitches on the outer edge of the strike zone.

PitchZone

How many times have you heard an anecdotal account of a batter not being able to handle an inside pitch, or a batter chasing pitches down and away? Hopefully charts like these (and future versions) will give a more concrete understanding of why batters perform like they do. What your eyes tell you and what's actually true may not always be the same. Obviously there's still a lot of work to be done here and in the coming months I'll be writing a number of articles on pitch data for batters and pitchers alike.


Daily Graphing – Sammy Sosa

ESPN Deportes is reporting that Sammy Sosa may be headed to Washington D.C. and even goes further by saying that some media sources in the Dominican Republic are saying the deal is “all but done.” Troubled by various injuries (foot, toe, infection), Sosa was truly awful last season batting a meager .221 with 14 home runs. He experienced a particularly horrible slump where he batted .106/.213/.112 from mid-June to mid-July. Let's see if there's any chance he'll rebound in 2006.

ISO

The question on everyone's mind has to be is if a lack of performance enhancing drugs were the cause of his dismal 2005. We may never know for sure, but a chart of his isolated power (ISO) will surely make you wonder. While it looked like he was certainly starting to decline well before last season, he went from having an ISO well within the top 20% of all batters in 2004 to just being merely average in 2005. That's quite a nosedive.

BA

If he can't hit home runs anymore, a .221 batting average isn't going to fly (even with the home runs). Since hitting .328 in 2001, his batting average has been on a four year decline. He's never had the best plate discipline either, especially if you discount the intentional walks, so it seems unlikely his batting average will ever approach .300 again.

BBK

Unless Sammy Sosa finds a way to transform himself, there's no way he'd be a good fit with the Nationals. I can't figure out why he'd want to come to D.C. anyway if he wants top 660 home runs. I've said it before and I'll say it again: R.F.K. Stadium is just about the hardest place in the league to hit home runs, with a home runs per fly ball (HR/FB) of 7% for right-handed batters. I think his batting average will probably rebound a bit, but I'd be surprised if he hit 10 home runs at home if he signs. With everyone in D.C. talking about the new stadium deal pretty much non stop, this would give Washingtonians a good chance to take a step back and rip into Jim Bowden if a deal actually happens. Can the Nationals get an owner already, please?


Improved Search

I've updated the player search so it should work like people actually think it works. You can now type in full names, partial names, last names, and somewhat misspelled names and it should bring back proper results. Hopefully the search functionality will no longer deter people from the site!


Age Comparisons

I've added a feature that allows you to compare up to three players by Age. Age is determined by the season minus the year they were born. All you need to do is go the “compare” section of each player and you'll notice that there's an additional graph right below current season comparison graphs. Just for kicks, I pulled one pitcher age comparison graph and one batter age comparison graph.

Starting with the pitchers, I compared strikeouts per 9 innings (K/9) for Pedro Martinez, Roger Clemens, and Randy Johnson. Looks like Pedro has started to decline much earlier in his career than the other two. I'll pass on drawing any conclusions from this graph, but you get the idea.

CK9

For the batters I chose to compare isolated power (ISO) for Derrek Lee, Barry Bonds, and Albert Pujols. Pujols has way more power than Bonds had at the same age while Lee looks like he's finding his power a little later than Bonds did, but he's not far behind.

CISO

Anyway, I think you can see how these comparisons will be useful, maybe even more so than the season comparisons. Enjoy and feel free to send comments and suggestions by posting in the forum or you can fill out a feedback form.