Archive for February, 2010

The Dodgers’ Fifth Starter

Amusing quote from Buster Olney’s column yesterday:

“We’d love to have a bona fide No. 5 starter,” said Colletti.

Olney frames this quote in response to Colletti listing a handful of names that qualify as unknowns, has-beens, or never-will-be types. Why is this amusing? Because, a bona fide number five starter generally fits into one of those categories. Matthew did some work on rotation slots in reality by tRA in late 2008. He found that number five starters were something like 24% below league average. Dave Cameron chimed in below in the comments section and it’s worth a read, if only for some constructive thinking. Matthew surmises the number five starter in his piece as such:

TO BE PERFECTLY CLEAR: By this definition, a #5 starter is probably not what most people term a #5 starter. I assume that when most people talk about a #5 starter, they talk about some mythical rotation that almost never misses a start and this person being the worst pitcher on it. For the most part, those rotations do not happen. A #5 as defined below represents the combined worst starters to have actually pitched. In my opinion, this is the more useful definition, because this way, having health is properly weighted and you get a notion for the level of scarcity that exists.

By this definition, the Dodgers do have a bona fide number five starter already. Even last year, the Dodger pitcher who made the fifth most starts was Eric Stults. He started 10 times and had a 5.54 xFIP. The list of alley cats Olney provides includes Charlie Haeger (profiled on this very site multiple times), James McDonald, Ramon and Russ Ortiz, and even Josh Towers amongst others. Frankly, I had no idea a few of those guys were still pitching baseballs. McDonald, though, is an interesting option.

McDonald has made nearly 90 starts in the minors, including 42 between Triple- and Double-A. At both destinations McDonald struck out at least nine per nine and walked between three and four batters per nine. He turned 25 in October and started last season in the Dodgers’ rotation. He would only make four starts, as he walked 14 in 13.1 innings and struck out only six. Upon a move to the bullpen, McDonald looked like his minor league self, posting a SO/BB of 2.4 and striking out roughly one batter pr inning.

His stuff doesn’t seem to stink, either: a low-90s fastball, curve, and change. Each pitch was whiffed on at least 8% of the time. His fastball shows great “rise” which makes up for some lackadaisical run. Those whiff rates will likely decrease upon a move back to the rotation, but McDonald’s body of work makes him more appealing than the Ortizes of the world. Plus, who knows, maybe he turns into more than a bona fide number five.


Groundballs and Slugging Rates

Beyond noting that ground balls are less damaging on their own than fly balls I also looked into the effects that a pitcher’s ground ball rate has on his home run rates and found no compelling evidence to support the theory that ground ball pitchers suffer higher rates of home runs on the fly balls they do allow. There’s more to damaging run scoring than just home runs though. I went digging further and started looking at slugging percentage allowed on the batted ball types, absent home runs.

Looking at line drives that ended up in play, were they more dangerous as a pitcher’s ground ball rate increased?

Nope. As it turns out based on the data that I have looked at is that as a pitcher’s ground ball rate goes up, the quality of line drives that he does allow, both the ones that go for home runs and the ones that stay in the park, do not change. Moving on to fly balls however, the first negative trend for ground ball pitchers emerges.

Interestingly, though the rate of fly balls that go for home runs appears to fall as a pitcher’s ground ball rate increases, the slugging percentage on the fly balls that stay in the park goes up. Why? I don’t know. Maybe outfielders shade in and more fly balls go over their heads. Maybe there is some systemic shift in the type of fly balls allowed, though it would be weird for them to be hit harder and yet not see an increase in home runs.

All told, it does look like ground ball pitchers see a rise in their slugging percentage allowed on non-ground batted balls. The effect is neither large nor overly consistent but it appears to be present. Up next, I look at strikeouts and walks.


The Rays’ 2011 Payroll

The Rays’ owner, Stuart Sternberg, made some waves earlier this week by announcing payroll would be reduced next season. This information came as a surprise to some, despite being pretty obvious based on the Rays’ current contract outlooks.

As of this writing, the six highest paid players on the Rays are:

Carlos Pena $10.1M
Carl Crawford $10M
Pat Burrell $9M
Rafael Soriano $7.5M
Jason Bartlett $4M
Dan Wheeler $4M

A resounding five of those players (everyone but Bartlett) will reach free agency at season’s end. Assuming no extensions or trades occur before November, that’s roughly $40M off the books. Throw in Gabe Kapler and Grant Balfour’s combined $3M and the Rays have more than half of their 2010 $70M payroll coming off the books.

Assume the Rays see some aggressive pay raises through arbitration and they would still have to take on something like $30M in 2011 salary to be near this year’s tab. Take the Yankees’ and Red Sox’s off-seasons as a testament to how much money that really is. The super-rich Yankees added Javier Vazquez ($11.5M), Curtis Granderson ($5.5M), Nick Johnson ($5.5M), and Randy Winn ($1.1M) which totals less than $25M. The super-aggressive Red Sox added John Lackey ($18M), Adrian Beltre ($9M), Jeremy Hermida ($3.3M), Bill Hall (~$1M), Mike Cameron ($7.3M), and Marco Scutaro ($5M) for a total of nearly $44M. Take Lackey’s salary out of the equation, though, and they added about $26M in 2010 salaries.

Of course it’s asinine to try and project a team’s lineup a few weeks from now, to attempt and project all the changes and especially with such mass departure over 12 months away is pointless. In a general sense, the free agent class will feature some attractive options like Cliff Lee, Joe Mauer, and the guy who would turn all the Tampa-based Yankees’ fans into Rays’ fans for a few days, Derek Jeter, but it’s just hard to see the Rays spending and acquiring so much salary within a single off-season.

So yeah, the Rays’ payroll is probably going to be reduced in 2011. The sun will probably rise tomorrow morning too.

Salary data from Cot’s.


Rod Barajas Is Not the Answer to Your Prayers, Omar Minaya

I suppose we shouldn’t have been surprised by reports that the New York Mets are going after Rod Barajas. Though most fans and observers alike acknowledged that the Mets’ greatest needs were in their tattered starting rotation, Omar Minaya has focused the bulk of his attention on his second-string catching corps, signing Henry Blanco, Chris Coste, and Shawn Riggans, and retaining Omir Santos, September callup Josh Thole, and farmhand Robinson Cancel.

Of course, it kind of makes sense that Minaya doesn’t think that any one of those six is a starting catcher. But he spent much of the offseason pursuing Bengie Molina, whom no one would mistake for Gabby Hartnett. Molina was the Mets’ second-highest free agent priority behind only Jason Bay, and after Molina jilted them a month ago, they remained unable to think of any other position on the diamond. Despite the number of backup catchers the organization already possesses — and the paucity of reliable batterymates in the starting rotation — the Mets still seem to be focused on finding 162 games worth of backstops.

Considering the massive holes on the team — a first baseman who can’t play first base, a right fielder with a career OBP of .311, and a starting rotation with one sure thing and four question marks — it’s hard to understand why the team is still fretting about upgrading from Henry Blanco to Rod Barajas, whose career OBP is exactly 8 points lower than Blanco’s.

Many people have already noted that the Mets’ offseason plan this year has seemed rudderless, including Ken Rosenthal. He explains that part of this is due to the Wilpons, the owners, who haven’t given Minaya a budget figure and also retain a great deal of influence over baseball operations. Some of Minaya’s moves make some sense in a vacuum: Jason Bay may be hard to distinguish from Josh Willingham, but he’s a three-win player with a booming bat and a legitimate presence in the lineup. And, certainly, no one would mistake Henry Blanco, Chris Coste, or Omir Santos for a true starting catcher. But no one would look at this team’s lineup and view left field or catcher as the team’s most pressing needs, either.

One of my favorite sportswriters, Allen Barra, tries to put a positive spin on all the madness, writing, “The good news is that the Mets can expect an enormous turnaround in fielding with the return of just two players — Carlos Beltran… and Jose Reyes.” And, of course, that’s the point. If the Mets can’t get healthy comeback years from Beltran, Reyes, and David Wright, then the rest of the offensive overhaul will hardly matter. And if they can’t get healthy comeback years from Mike Pelfrey, John Maine, and Oliver Perez, then little else will matter, either.

Still, if there’s one thing the Mets can count on, it’s the fact that they have a whole lot of people ready for spring training. Today’s the day that pitchers and catchers report to Port St. Lucie — or, in the Mets’ case, pitchers, and catchers, and catchers, and catchers…


Wakefield’s Curious Platoon Split

It looks like most of my fellow writers are more sensible than I, and have moved on from constant attention to the two-week-old Fangraphs’ splits. But I cannot help myself: as a pitchf/x-er I have a fondness for Tim Wakefield and I had always remembered hearing that the knuckleball does not have a platoon split. So it was something I had to check out.

Since 2002 Wake has posted an xFIP of 4.79 against LHBs and an xFIP of 4.73 against RHBs — not much of a split. His FIP actually shows a reverse split: 4.38 against LHBs and 4.73 against RHBs. The interesting aspect is that the components show rather large — but complementary — splits.

Looking just at strikeout and walks Wakefield does much better against righties, with 6.56 K/9, 2.78 BB/9 against RHBs and 5.52 K/9, 3.34 BB/9 against LHBs. That would portend an big split. But once the ball is in play the story changes. Righties have a BABIP of .286, with 38% GB and 10.5% HR/FB. Lefties a .264 BABIP, with 42% GB and 8% HR/FB. So lefties are hitting a lower BABIP; more ground balls, so fewer flies; and a lower percentage of those flies make it over the fence. In every way lefties make poorer contact against Wakefield.

I thought that maybe this had to do with Wakefield throwing his pitches in different percentages to RHBs and LHBs. But his numbers a very similar, against both about 85% knucklers,10% fastballs and 5% curves.

So the difference must be in how LHBs and RHBs deal with his knuckleball, and the per-pitch numbers bear this out. Righties whiff on his knuckler more often (20% versus 16%) and swing at more of them out of the zone (27% versus 25%), but when they hit it they make much better contact (.512 slugging on contact versus .435). I don’t know whether this is a difference in approach — righties go up there looking to knock one out of the park while lefties just look to make contact, but I don’t know why that would be — or whether it has to do with how lefties versus righties pick up as it is delivered or what is causing this difference. Anyway it is one more in a long list of wonderful mysteries of the knuckle ball.

Put it all together and Wakefield probably has a slight reverse split. His FIP, which would credit the difference in HR/FB as real while xFIP would ignore the difference, is better against lefties. And that does not credit him for his very low BABIP against LHBs, which after so many batters faced is probably a real difference and makes his performance agianst LHBs even better than his FIP would suggest.

But anyway you look at it the platoon split is pretty small. All else equal if you have two guys and one spot in the rotation and one spot in the pen you would give the rotation spot to the guy with the smaller platoon split — thus opposing managers could not take advantage of it in lineup creation and you could leverage the bigger split of the guy in the bullpen. So that is one argument for putting Wakefield in the rotation. But all else is not equal and, even accounting for Wake’s splitless-ness, there are probably five better starters than Wakefield on Boston’s depth chart. Anyway the point will probably be moot, as there is little chance all six pitchers are healthy at the same time and Wake will get his share of starts and we shall all rejoice.


Locking Up Justin Upton

As we can expect in most cases, the headline overhyped the content. MLB.com’s Steve Gilbert, reporting on Diamondbacks GM Josh Byrnes’s Q&A at FanFest last weekend, quoted the GM on the issue of contract extensions for Mark Reynolds and Justin Upton. His answer was unsurprisingly ambiguous, though the copy editor played it up a bit in the headline. Seeing that headline, after finding through an equally tantalizing MLBTR headline, made me wonder what it would take to lock up Upton, through his arbitration years and perhaps a year into his free agency.

Using WAR dollars

Since we don’t know how Upton will fare this season, I’ll base my hypothetical on the Fans projection. Why Fans and not CHONE? Because the Fans projection is considerably more bullish, projecting Upton to produce a full win over his 2009 performance. I’m not sure if he’ll truly break out this season, but given all we’ve heard about him since the Diamondbacks drafted him with the No. 1 overall pick in 2005, I think it works for these informal purposes.

The Fans project Upton to post 5.6 WAR this season, based on an improvement of 10 batting runs above replacement. Converting WAR to dollars, that’s a $25.1 million performance. Again, given Upton’s upside, he could further improve on that through his arbitration years, though his positional adjustment doesn’t help. So let’s proceed figuring Upton hits most of his upside and produces ~6 WAR per season, which would put him around $27 million in WAR dollars.

Problem is, only one man makes that much money. Albert Pujols might become the second once he hits free agency, but in both cases we’re talking about generational talents. Like the Fans I’m bullish on Upton, but not quite ready to pronounce him A-Rod or Pujols. But, since the header says WAR dollars, let’s work backward from here anyway.

If we go by the rule of thumb, with a player’s first-year arbitration being 40 percent of his free-agent value, the second year being 60 percent, and the third year being 80 percent, we can make some pretty quick estimates of Upton’s arbitration salary. In 2011 he’d make $10.8 million, in 2012 $16.2, and in 2013 $21.6. Right away these numbers jump out as well higher than we’d expect, given recent arbitration hearing results. Then again, Ryan Howard did get $10 million in his first arbitration hearing, and Upton would be much younger. But, since teams sign long-term deals require a monetary sacrifice to the team in exchange for security, we can adjust this down, perhaps considerably.

Figuring a four-year contract, buying out all three arbitration years and a year of free agency, WAR dollars adjusted for arbitration would come out to four years, $75.6 million. If we adjust that down, say, 25 percent, it’s a four-year, $56.7 million contract. That still seems a bit rich. Even if Upton deserves it, I’m not sure the D’Backs would pay it.

Comparable players

When hashing out arbitration figures, teams and players make comparisons to similar players. Teams will obviously look t players at the lower end of that spectrum, while the players will try for the best. Since we’re looking for terms of a long-term deal, four to five years, maybe some comparable deals from team-controlled players could shed some further light.

In 2008 Hanley Ramirez signed an extension that started with his first arbitration eligible season, 2009, and runs through 2014. Those six years will cost the Marlins, or a potential acquiring team, $70 million. Hanley was two years older than Upton through his first two major league seasons, which could change the equation. On the other hand, Ramirez produced more value in his first two seasons, 4.5 and 5.7 WAR against Upton’s 0.7 and 4.6. If Upton produces to the level of Fan projection, perhaps he’d be in line for something similar.

More on Upton’s level positionally, Ryan Braun signed an eight-year, $45 million extension with the Brewers a month and a half into his first full season. The deal essentially pays him $4, $6, and $8.5 million for his arbitration years, so I don’t think this is a good comp at all. Since Upton already has more service time than Braun did when he signed, that should be relatively obvious. We can also turn aside Evan Longoria as a comp, for similar reasons. Ditto Grady Sizemore and Troy Tulowitzki.

How about David Wright? He signed an extension while finishing up his second full season in 2006. It bought out his first two arbitration years at $5 and $7.5 million, and buys out his final one for $10 million. It also buys out his first two years of arbitration for $14 and $15 million, plus a $16 million club option for 2013. Wright produced 5.8 WAR in 2005 and 4.6 WAR in 2006, close to what Upton did in 2009 and what we can loosely project for 2010. Of course, Upton might not want to sign away two to three free agent years, so maybe some of those dollars can go back into arbitration values.

Taking a stab at the issue, using the WAR dollars projection plus the Ramirez and Wright comps, a five-year, maybe a five-year, $58 million deal would get the job done. That provides Upton with security, and the Diamondbacks with a predictable salary plus two years of free agency. Upton would be 28 when the deal expires, so he could pursue a pretty hefty contract, perhaps in the range of Mark Teixeira’s eight-year, $180 million deal.

Clearly this was just the exploration of a curiosity, and by no means represents what the Diamondbacks should pay Upton should they want to lock him up. I’m interested to see others take a stab at estimating his value over the next four or five years.


Phil Coke, Starting Pitcher?

Last week, we talked about Kyle Farnsworth, and I applauded the Royals for giving him a chance to see what he can do as a starting pitcher. Kansas City isn’t the only AL Central team considering trying a relief pitcher in the rotation, however, as Jason Beck reports that the Tigers may do the same with newly acquired Phil Coke.

Coke was a starter in the minors, and had a decent amount of success, so Detroit isn’t entirely throwing spaghetti at the wall here. However, unlike Farnsworth, Coke just doesn’t seem to have a starter’s repertoire.

In his limited major league time, Coke has relied heavily on his fastball/slider combination. He’s thrown his four-seamer about 70% of the time, while throwing his strikeout slider about 25% of the time, leaving just 5% of his pitches for a change-up that’s a work-in-progress at best. Not surprisingly, as a fastball/slider guy, he’s performed like a classic LOOGY. Here are his splits:

Vs Left: 1.22 BB/9, 8.32 K/9, 36% GB%, 3.23 xFIP
Vs Right: 4.75 BB/9, 6.53 K/9, 40% GB%, 4.91 xFIP

He’s a terrific LOOGY, but hasn’t shown any ability to get right-handed hitters out. And, remember, he was selectively used to avoid good right-handed bats. Of the 290 batters he’s faced in the majors, 56 percent have been left-handed. As a starter, that number would fall to between 20 and 25 percent.

Unless the Tigers know something about the development of Coke’s change-up, this doesn’t seem like a very good use of resources. Coke is terrific against left-handers, but moving him into a starting role will guarantee that he won’t get to face many of those. I wouldn’t expect this experiment to go very well or last very long. Coke belongs in the bullpen, where his stuff can be leveraged against good left-handed bats, and I’d guess that the Tigers will quickly come to the same conclusion.


Groundballs and Home Run Rates

Yesterday, I looked at balls hit on the ground versus balls hit in the air and their relative weights of offensive levels. The conclusion that arose from that was that ground balls are far less harmful to pitchers than fly balls. I do not think that should come as a shock to anyone, though the magnitude of difference might have been surprising.

Of course, pitching is not isolated. In order to get more strikeouts, pitchers generally have to pitch more out of the zone and thus risk more walks as well. Pitchers that seek ground balls tend to pitch lower in the strike zone, and one theory that has been prevalent is that ground-ball pitchers allow home runs more often on their fly balls since their “mistake pitches” are elevated into the hitting sweet spot. In other words, when they aim low and miss high, watch out. It makes some sense, but does the data bear this out? I went looking at figures from both leagues over the 2007 through 2009 seasons.

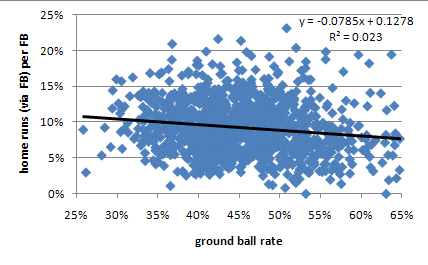
Looking only at batted balls classified as fly balls (no line drives or pop ups), as a pitcher’s ground ball rate increases does a pitcher’s home runs allowed via fly ball per fly ball increase?

No. In fact, it goes down a little. This might be surprising to some, but I expected something close to this result as it is something I have looked at a couple different times over the past few years and continually end up with the same answer. This look was slightly different as I restricted the home runs in question to only those coming off fly balls. I usually find a trend line that is close to horizontal if I include all types of home runs. Either way, nothing close to a positive trend.

What about line drives? Looking only at batted balls classified as line drives, as a pitcher’s ground-ball rate increases does a pitcher’s home runs allowed via line drive per line drive increase?

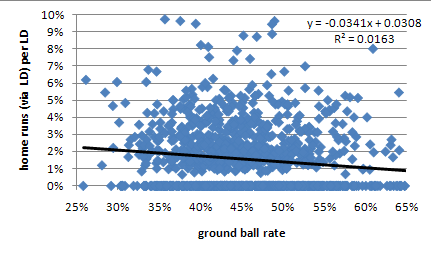
Also no. I was genuinely surprised by this. Even if you restrict the data to pitchers that allowed a line-drive home run (to get rid of the influence of all those zero values) the slope is still negative. Line drives are the squarest form of contact by the hitter and I did buy into the theory of more damagingly placed mistake pitches from ground-ball pitchers at least a little.

It turns out that while ground-ball pitchers are expected to allow more line drives, on a rate basis, than fly ball pitchers, the line drives themselves are less likely to leave the yard. My guess is that this would be due to some fuzziness in the distinction between hard hit ground balls and line drives and that ground-ball pitchers see a greater share of line drives credited against them that have no chance of clearing the fence.

Combining the previous two questions, as a pitcher’s ground-ball rate increases does a pitcher’s home runs allowed per non-ground ball increase? No. Less surprising now given the answer to the two previous looks, but worth mentioning for completeness. Also worth noting is that on all of these the R^2 values are incredibly low and the slopes are not dramatic. The best rule of thumb I can state from this look is that a pitcher’s ground ball rate has no impact on his various rates of yielding home runs and what impact there is might actually be negative.


The Best Thread of Your Life

Every spring, there is one constant, a telltale sign of the beginning of baseball, when people are starved for news but there just isn’t any – the “Player X is in the best shape of his life” story. Every year, without fail, certain players report to spring training having done one of the following:

1. Lost 30 pounds
2. Had laser eye surgery
3. Rehabilitated their knee/back
4. Rededicated themselves to the game
5. Found a new passion for baseball

Because these things are more interesting than a player reporting to camp in exactly the same form he was last year, the guy and his new attribute get written up in the paper. He gives some quotes about why this is his year, how it is all going to be different, and why fans should prepare for a whole new version they’ve never seen before.

Most of the the time, it turns out to be nothing. The player is what he is, and he plays just like he always has, with his new form never mentioned again as he’s struggling in July. But, I’m sure some players have made legitimate strides in their work ethic this winter, and for some, it might even pay off.

So, to the end of actually documenting the success and failure of these players, let’s crowdsource the Best Shape Of Their Lives guys. If you see a story where a player is reported to have done one of the above things, please mention it in the
comments, along with a link to support the citation. Hopefully, we can get all of the Good Shapers in one list, and then look at how they perform once the season begins.

Here’s the list, to be updated as the information from the comments is confirmed:

Ken Griffey Jr – Seattle
Jonathan Sanchez – San Francisco
Carlos Zambrano – Chicago
Geovany Soto – Chicago
Daisuke Matsuzaka – Boston
Mike Pelfrey – New York
Chipper Jones – Atlanta
Brian McCann – Atlanta
Tim Hudson – Atlanta (clearly, it’s the Braves year)
Bobby Jenks – Chicago
Delmon Young – Minnesota
David Price – Tampa Bay


Edwin Jackson and His New Contract

Earlier this week, the Arizona Diamondbacks settled with former Dodgers/Rays/Tigers pitcher Edwin Jackson, buying out his last two years of arbitration for $13.35 million. According to Cot’s Contracts, Jackson will receive an $800,000 signing bonus, $4.2 million in 2010, and $8.35 million in 2011. The general rule of thumb is to assume the team would be paying him 60 and 80 percent of the player’s “open market” value for the second and third arbitration years. Lumping the signing bonus in with the 2010 salary, the open market value of the contract is about $18.8 million, which in the current market (about $3.5 million per marginal win) would be an average contract for about a 2.7 win player, assuming a 0.5 win-a-season decline. Is this a good value for the Diamondbacks?

Pitcher win value calculations are more complicated than for position players, so I won’t lay out every step — read here for how FanGraphs does it. CHONE projects Jackson’s 2010 FIP at 4.33. Scaled to runs allowed and assuming last season’s MLB run environment, I get 4.76. That is worse than 2009’s average runs per game (4.61), but we also need to account Arizona being a serious hitter’s park (I use a 1.06 park adjustment), which brings his FIP-RA down to 4.49, making Jackson a .513 pitcher (using PythagenPat). .380 is the general replacement level for starters, but following Tom Tango I use .370 (AL) and .390 (NL) to account for relative league difficulty. Over CHONE’s projected 30 starts and 178 innings for Jackson (and accounting for how he impacts the run environment), he projects as a 2.2 WAR pitcher.

It looks like Arizona overpaid a bit. But we should acknowledge that it is very difficult to project playing time. If Jackson repeats 2009’s 214 innings and 33 starts at the FIP projected above, his projected WAR goes up to the 2.7 WAR for which the Diamondbacks are paying. The Fans project 196 innings and 32 starts, which puts Jackson at 2.4 WAR.

Another thing to keep in mind is that we’re assuming an average 0.5-win-a-season decline due to aging-based attrition. While we should be cautious before making any player an “exception,” Jackson won’t turn 27 until September, and hasn’t had major arm trouble recently, so that is another factor to consider.

Jackson is interesting. He was born in (then-West) Germany, was a top pitching prospect with the Dodgers, got traded to Tampa Bay for a couple middle relievers, then the Rays moved him for Matt Joyce after Jackson’s seemingly good 2009. Jackson’s ERA has consistently been better than his FIP (which has, in turn, been slightly better than his xFIP), yet the “collapse” some expected from him after the trade to Detroit has not occurred. It’s interesting just how poorly (according to pitch-type linear weights) Jackson’s fastball has fared against opposing hitters, while his slider has been excellent the last two years. Perhaps he figured that out in 2009, as he threw the slider more often than before, which in turn might be why he was able to get hitters to swing at pitches out of the zone (and strike out) at a much higher rate in 2009. Jackson still has trouble getting ahead in the count, however (54.4% career F-Strike). While Jackson may not be have dominating stuff, his durability is an asset.

Returning to the original topic — while there is reason to believe this deal is fair to both sides, I would give slight “edge” to Jackson. How that factors into the evaluation of The Big Trade is another question.