2015 ZiPS Projections – Seattle Mariners
After having typically appeared in the very hallowed pages of Baseball Think Factory, Dan Szymborski’s ZiPS projections have been released at FanGraphs the past couple years. The exercise continues this offseason. Below are the projections for the Seattle Mariners. Szymborski can be found at ESPN and on Twitter at @DSzymborski.
Other Projections: Arizona / Atlanta / Boston / Chicago AL / Chicago NL / Cleveland / Colorado / Detroit / Houston / Los Angeles AL / Los Angeles NL / Miami / Milwaukee / Minnesota / New York NL / Oakland / San Diego / San Francisco / St. Louis / Tampa Bay / Washington
Batters
In the first year of his 10-year and $240 million contract with the M’s, Robinson Cano served as a one-man illustration of park effects, recording almost precisely the same batting-average and on-base figures as the previous season with the Yankees, but producing only half the home runs. (We’ll ignore for the moment that he actually hit more homers at Safeco than on the road, as that would disturb the narrative.) The result was a park-adjusted offensive line roughly approximating 2013’s. ZiPS calls for another five-win season in 2015 despite a home-run total somewhere below 20.
On the topic of park effects, offseason acquisition Nelson Cruz moves from a home field that inflates right-handed homers by roughly 8% to one that suppresses them by about 6%. That move plus age plus mere regression conspire to produce a forecast of 29 home runs for Cruz in 2015 after last season’s total of 40.
Pitchers
Seattle’s prospect triumvirate of Danny Hultzen, James Paxton, and Taijuan Walker have had some difficulty in all graduating to the majors together. Not entirely surprising, that, given the relative fragility of pitchers. The latter two of them, however, appear prepared to join Seattle’s opening-day rotation this year. Of some note, perhaps, is what might appear to be a conservative projection (113.0 IP, 1.2 WAR) for Paxton — especially in light of how he produced roughly the same WAR figure last year in 40 fewer innings. ZiPS considers not only that 2014 season, however, but also those 2012 and -13 ones in which he was barely recording 2:1 strikeout-to-walk ratios against Triple-A competition.
Within the bullpen, it appears as though Fernando Rodney will once again handle closer duties. According to ZiPS, however, the most effective reliever on a per-inning basis is likely to be Danny Farquhar. His projected 77 ERA- — that is, park- and league-adjusted ERA relative to league average — is the second-best figure on the club after Felix Hernandez’s 70 ERA- mark.
Bench/Prospects
While Brad Miller (555 PA, 2.3 WAR) appears likely to begin the season as the club’s starting shortstop, Chris Taylor (501 PA, 2.3 WAR) is almost a carbon copy in terms of win-production according to ZiPS. Recently signed career minor-leaguer Shawn O’Malley (421 PA, 0.9 WAR) apparently also has some value at short, should the previous two lose time to injury or ineffectiveness. Among pitchers, there’s less depth, with Roenis Elias (139.2 IP, 0.6 WAR) serving as the most immediate insurance for the rotation.
Depth Chart
Below is a rough depth chart for the present incarnation of the Mariners, with rounded projected WAR totals for each player. For caveats regarding WAR values see disclaimer at bottom of post. Click to embiggen image.
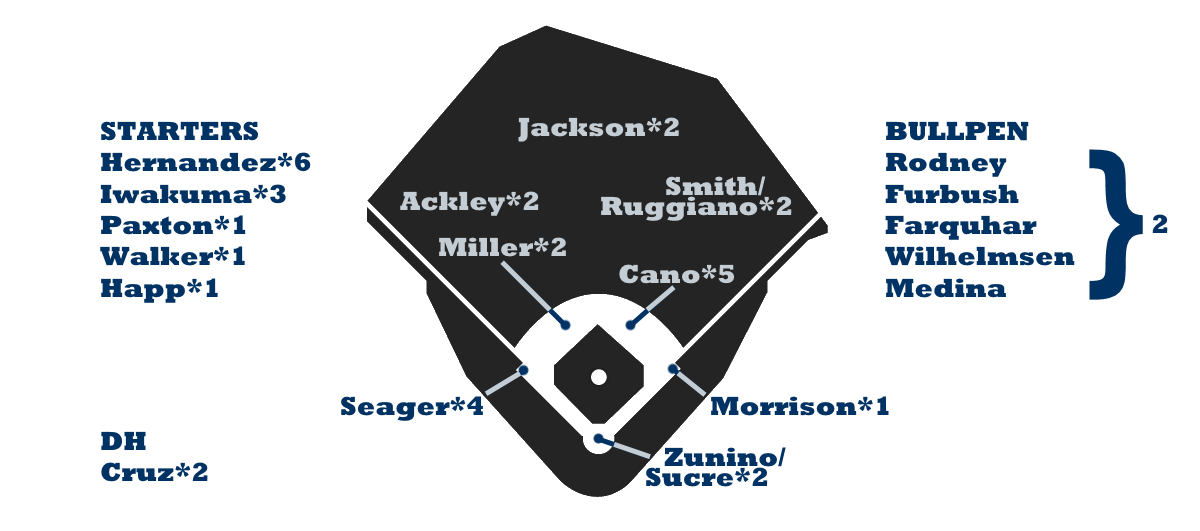
Ballpark graphic courtesy Eephus League. Depth charts constructed by way of those listed here at site and author’s own haphazard reasoning.
Batters, Counting Stats
| Player | B | Age | PO | PA | R | H | 2B | 3B | HR | RBI | SB | CS |
|---|---|---|---|---|---|---|---|---|---|---|---|---|
| Robinson Cano | L | 32 | 2B | 663 | 80 | 178 | 37 | 2 | 17 | 85 | 7 | 2 |
| Kyle Seager | L | 27 | 3B | 658 | 79 | 155 | 31 | 3 | 21 | 88 | 9 | 5 |
| Nelson Cruz | R | 34 | RF | 612 | 68 | 139 | 27 | 1 | 29 | 83 | 6 | 4 |
| Brad Miller | L | 25 | SS | 555 | 72 | 125 | 21 | 5 | 12 | 55 | 8 | 4 |
| Chris Taylor | R | 24 | SS | 501 | 61 | 116 | 21 | 4 | 3 | 38 | 18 | 6 |
| Austin Jackson | R | 28 | CF | 659 | 78 | 145 | 27 | 7 | 9 | 45 | 14 | 6 |
| Mike Zunino | R | 24 | C | 491 | 62 | 97 | 19 | 2 | 17 | 58 | 1 | 2 |
| Dustin Ackley | L | 27 | LF | 598 | 79 | 135 | 27 | 4 | 12 | 62 | 7 | 3 |
| Seth Smith | L | 32 | LF | 458 | 54 | 99 | 24 | 2 | 11 | 45 | 2 | 1 |
| Shawn O’Malley | B | 27 | SS | 421 | 44 | 84 | 11 | 5 | 3 | 27 | 14 | 4 |
| Tyler Marlette | R | 22 | C | 377 | 41 | 82 | 16 | 1 | 5 | 35 | 7 | 4 |
| D.J. Peterson | R | 23 | 3B | 463 | 56 | 101 | 18 | 0 | 14 | 52 | 4 | 1 |
| Justin Ruggiano | R | 33 | RF | 359 | 40 | 77 | 15 | 1 | 11 | 40 | 8 | 5 |
| Logan Morrison | L | 27 | 1B | 432 | 49 | 94 | 19 | 2 | 13 | 50 | 3 | 1 |
| Jesus Sucre | R | 27 | C | 252 | 22 | 56 | 8 | 1 | 1 | 18 | 1 | 1 |
| John Hicks | R | 25 | C | 369 | 40 | 74 | 13 | 2 | 4 | 32 | 8 | 4 |
| Jack Marder | R | 25 | 2B | 304 | 34 | 63 | 10 | 2 | 4 | 25 | 5 | 3 |
| Jabari Blash | R | 25 | RF | 442 | 52 | 86 | 15 | 2 | 13 | 44 | 8 | 6 |
| Ketel Marte | B | 21 | SS | 575 | 61 | 134 | 22 | 4 | 3 | 42 | 19 | 10 |
| Mike Dowd | R | 25 | C | 269 | 25 | 56 | 7 | 1 | 2 | 19 | 1 | 1 |
| Patrick Kivlehan | R | 25 | 3B | 529 | 57 | 113 | 19 | 3 | 9 | 50 | 8 | 3 |
| Willie Bloomquist | R | 37 | SS | 149 | 16 | 39 | 5 | 1 | 1 | 14 | 0 | 1 |
| Jack Reinheimer | R | 22 | SS | 512 | 54 | 112 | 15 | 2 | 2 | 34 | 21 | 11 |
| Carlos Rivero | R | 27 | 3B | 484 | 44 | 104 | 19 | 1 | 7 | 39 | 2 | 3 |
| Austin Wilson | R | 23 | RF | 318 | 36 | 66 | 13 | 1 | 8 | 34 | 2 | 3 |
| Nate Tenbrink | L | 28 | 3B | 253 | 30 | 47 | 9 | 1 | 5 | 22 | 4 | 2 |
| Ji-Man Choi | L | 24 | 1B | 389 | 46 | 81 | 14 | 2 | 8 | 36 | 1 | 3 |
| Steven Baron | R | 24 | C | 296 | 24 | 55 | 11 | 1 | 1 | 20 | 5 | 2 |
| Stefen Romero | R | 26 | RF | 458 | 54 | 104 | 19 | 3 | 12 | 51 | 5 | 6 |
| James Jones | L | 26 | CF | 502 | 61 | 110 | 16 | 7 | 4 | 33 | 23 | 7 |
| Jesus Montero | R | 25 | 1B | 441 | 45 | 100 | 18 | 1 | 12 | 50 | 0 | 1 |
| Endy Chavez | L | 37 | RF | 335 | 30 | 79 | 12 | 1 | 2 | 23 | 3 | 5 |
| Julio Morban | L | 23 | RF | 338 | 35 | 71 | 13 | 3 | 4 | 29 | 3 | 1 |
| Xavier Nady | R | 36 | LF | 259 | 24 | 52 | 9 | 0 | 5 | 22 | 1 | 0 |
| Gabriel Guerrero | R | 21 | RF | 581 | 60 | 131 | 19 | 2 | 10 | 48 | 12 | 6 |
| Leury Bonilla | R | 30 | 3B | 300 | 27 | 58 | 9 | 1 | 1 | 19 | 4 | 5 |
| Jordy Lara | R | 24 | 1B | 493 | 51 | 104 | 20 | 2 | 9 | 47 | 2 | 2 |
| Burt Reynolds | R | 26 | 1B | 377 | 34 | 59 | 12 | 2 | 7 | 31 | 9 | 7 |
***
Batters, Rates and Averages
| Player | PA | BB% | K% | ISO | BABIP | AVG | OBP | SLG | wOBA |
|---|---|---|---|---|---|---|---|---|---|
| Robinson Cano | 663 | 8.4% | 12.7% | .154 | .323 | .299 | .363 | .453 | .346 |
| Kyle Seager | 658 | 8.1% | 17.6% | .169 | .291 | .261 | .327 | .430 | .333 |
| Nelson Cruz | 612 | 7.4% | 23.4% | .208 | .282 | .250 | .309 | .458 | .332 |
| Brad Miller | 555 | 7.7% | 21.3% | .133 | .300 | .249 | .308 | .382 | .304 |
| Chris Taylor | 501 | 8.0% | 23.0% | .084 | .336 | .258 | .323 | .342 | .300 |
| Austin Jackson | 659 | 8.3% | 25.0% | .115 | .321 | .245 | .309 | .360 | .299 |
| Mike Zunino | 491 | 5.7% | 29.3% | .166 | .276 | .217 | .279 | .383 | .290 |
| Dustin Ackley | 598 | 8.0% | 17.9% | .130 | .289 | .249 | .311 | .379 | .305 |
| Seth Smith | 458 | 10.3% | 22.1% | .151 | .298 | .245 | .328 | .396 | .317 |
| Shawn O’Malley | 421 | 6.7% | 20.4% | .079 | .278 | .223 | .283 | .302 | .263 |
| Tyler Marlette | 377 | 5.0% | 24.4% | .093 | .297 | .231 | .273 | .324 | .267 |
| D.J. Peterson | 463 | 5.4% | 27.0% | .138 | .293 | .233 | .276 | .371 | .289 |
| Justin Ruggiano | 359 | 7.8% | 28.7% | .154 | .310 | .237 | .302 | .391 | .307 |
| Logan Morrison | 432 | 8.6% | 17.8% | .159 | .269 | .242 | .313 | .401 | .314 |
| Jesus Sucre | 252 | 2.8% | 16.3% | .055 | .276 | .233 | .257 | .288 | .240 |
| John Hicks | 369 | 4.3% | 23.3% | .084 | .270 | .213 | .253 | .297 | .246 |
| Jack Marder | 304 | 4.9% | 21.4% | .095 | .285 | .230 | .290 | .325 | .274 |
| Jabari Blash | 442 | 8.6% | 36.0% | .147 | .326 | .219 | .299 | .366 | .296 |
| Ketel Marte | 575 | 3.3% | 17.2% | .071 | .292 | .246 | .270 | .317 | .257 |
| Mike Dowd | 269 | 3.0% | 19.3% | .060 | .267 | .220 | .254 | .280 | .236 |
| Patrick Kivlehan | 529 | 5.3% | 28.7% | .106 | .311 | .230 | .278 | .336 | .275 |
| Willie Bloomquist | 149 | 4.0% | 16.1% | .071 | .328 | .279 | .311 | .350 | .285 |
| Jack Reinheimer | 512 | 5.3% | 19.1% | .053 | .293 | .236 | .283 | .289 | .258 |
| Carlos Rivero | 484 | 5.2% | 25.8% | .093 | .301 | .231 | .275 | .324 | .267 |
| Austin Wilson | 318 | 5.7% | 25.5% | .134 | .286 | .227 | .287 | .361 | .285 |
| Nate Tenbrink | 253 | 8.3% | 34.8% | .115 | .311 | .208 | .282 | .323 | .273 |
| Ji-Man Choi | 389 | 9.0% | 19.8% | .123 | .280 | .235 | .315 | .358 | .298 |
| Steven Baron | 296 | 4.1% | 28.7% | .058 | .274 | .196 | .230 | .254 | .218 |
| Stefen Romero | 458 | 3.7% | 21.4% | .143 | .285 | .242 | .280 | .385 | .289 |
| James Jones | 502 | 5.6% | 25.1% | .089 | .314 | .236 | .281 | .325 | .272 |
| Jesus Montero | 441 | 6.1% | 21.3% | .137 | .288 | .246 | .293 | .383 | .294 |
| Endy Chavez | 335 | 5.1% | 11.9% | .066 | .288 | .258 | .297 | .324 | .265 |
| Julio Morban | 338 | 5.3% | 34.9% | .099 | .344 | .225 | .270 | .324 | .263 |
| Xavier Nady | 259 | 5.4% | 23.9% | .100 | .269 | .217 | .266 | .317 | .260 |
| Gabriel Guerrero | 581 | 3.8% | 31.2% | .096 | .331 | .237 | .266 | .333 | .264 |
| Leury Bonilla | 300 | 5.0% | 24.7% | .051 | .284 | .211 | .253 | .262 | .224 |
| Jordy Lara | 493 | 4.9% | 24.3% | .111 | .284 | .226 | .268 | .337 | .268 |
| Burt Reynolds | 377 | 4.5% | 44.0% | .105 | .292 | .169 | .223 | .274 | .223 |
***
Batters, Assorted Other
***
Pitchers, Counting Stats
| Player | T | Age | G | GS | IP | K | BB | HR | H | R | ER |
|---|---|---|---|---|---|---|---|---|---|---|---|
| Felix Hernandez | R | 29 | 32 | 32 | 217.3 | 224 | 46 | 15 | 180 | 68 | 64 |
| Hisashi Iwakuma | R | 34 | 27 | 27 | 170.0 | 143 | 29 | 19 | 154 | 67 | 63 |
| James Paxton | L | 26 | 23 | 22 | 113.0 | 91 | 41 | 10 | 107 | 51 | 48 |
| Taijuan Walker | R | 22 | 24 | 22 | 128.7 | 111 | 47 | 14 | 121 | 62 | 58 |
| Danny Farquhar | R | 28 | 59 | 0 | 70.3 | 81 | 25 | 5 | 58 | 25 | 23 |
| J.A. Happ | L | 32 | 25 | 23 | 130.3 | 111 | 49 | 16 | 128 | 66 | 62 |
| Roenis Elias | L | 26 | 25 | 25 | 139.7 | 114 | 57 | 16 | 137 | 72 | 67 |
| Charlie Furbush | L | 29 | 65 | 0 | 51.7 | 61 | 17 | 5 | 42 | 19 | 18 |
| Fernando Rodney | R | 38 | 60 | 0 | 58.0 | 65 | 27 | 4 | 49 | 22 | 21 |
| Carson Smith | R | 25 | 51 | 0 | 56.3 | 52 | 21 | 4 | 50 | 22 | 21 |
| Tom Wilhelmsen | R | 31 | 61 | 0 | 70.3 | 67 | 33 | 6 | 58 | 29 | 27 |
| Mike Kickham | L | 26 | 29 | 25 | 140.7 | 117 | 64 | 14 | 141 | 74 | 69 |
| Danny Hultzen | L | 25 | 13 | 13 | 62.0 | 53 | 36 | 5 | 58 | 31 | 29 |
| Tyler Olson | L | 25 | 23 | 20 | 110.3 | 73 | 33 | 12 | 116 | 58 | 54 |
| Dominic Leone | R | 23 | 56 | 0 | 66.0 | 63 | 25 | 6 | 59 | 28 | 26 |
| Chris Young | R | 36 | 23 | 22 | 122.7 | 81 | 45 | 17 | 123 | 65 | 61 |
| Sam Gaviglio | R | 25 | 20 | 19 | 107.0 | 77 | 39 | 12 | 113 | 57 | 53 |
| Yoervis Medina | R | 26 | 69 | 0 | 65.3 | 67 | 33 | 5 | 56 | 28 | 26 |
| Erasmo Ramirez | R | 25 | 28 | 24 | 140.3 | 99 | 44 | 18 | 147 | 76 | 71 |
| Mayckol Guaipe | R | 24 | 42 | 0 | 57.3 | 48 | 11 | 7 | 56 | 26 | 24 |
| Todd Coffey | R | 34 | 30 | 0 | 29.3 | 23 | 12 | 3 | 29 | 14 | 13 |
| Jordan Pries | R | 25 | 22 | 21 | 115.7 | 76 | 42 | 14 | 122 | 65 | 61 |
| David Rollins | L | 25 | 26 | 17 | 94.0 | 72 | 42 | 12 | 97 | 54 | 50 |
| Joe Beimel | L | 38 | 40 | 0 | 34.0 | 22 | 14 | 4 | 35 | 18 | 17 |
| Mike MacDougal | R | 38 | 19 | 0 | 22.0 | 17 | 14 | 2 | 22 | 13 | 12 |
| Mark Lowe | R | 32 | 42 | 0 | 45.0 | 40 | 21 | 6 | 44 | 24 | 22 |
| Lucas Luetge | L | 28 | 57 | 0 | 62.7 | 54 | 30 | 7 | 60 | 33 | 31 |
| Anthony Fernandez | L | 25 | 16 | 16 | 84.3 | 51 | 37 | 12 | 94 | 55 | 51 |
| Zach Miner | R | 33 | 27 | 5 | 57.0 | 30 | 29 | 8 | 65 | 37 | 35 |
| Stephen Landazuri | R | 23 | 22 | 22 | 105.0 | 77 | 43 | 18 | 112 | 66 | 62 |
| Forrest Snow | R | 26 | 29 | 11 | 82.3 | 60 | 43 | 12 | 88 | 52 | 49 |
| Edgar Olmos | L | 25 | 48 | 0 | 64.0 | 45 | 36 | 8 | 67 | 39 | 36 |
| Victor Sanchez | R | 20 | 22 | 22 | 117.0 | 71 | 32 | 20 | 132 | 75 | 70 |
| Justin Germano | R | 32 | 24 | 22 | 137.3 | 75 | 32 | 24 | 162 | 89 | 83 |
| Andrew Carraway | R | 28 | 26 | 23 | 121.7 | 62 | 45 | 18 | 141 | 80 | 75 |
| Chance Ruffin | R | 26 | 34 | 9 | 80.0 | 49 | 36 | 13 | 91 | 56 | 52 |
| Tyler Pike | L | 21 | 25 | 25 | 99.3 | 67 | 80 | 15 | 107 | 74 | 69 |
***
Pitchers, Rates and Averages
| Player | IP | TBF | K% | BB% | BABIP | ERA | FIP | ERA- | FIP- |
|---|---|---|---|---|---|---|---|---|---|
| Felix Hernandez | 217.3 | 878 | 25.5% | 5.2% | .281 | 2.65 | 2.70 | 70 | 71 |
| Hisashi Iwakuma | 170.0 | 693 | 20.6% | 4.2% | .270 | 3.34 | 3.43 | 88 | 90 |
| James Paxton | 113.0 | 487 | 18.7% | 8.4% | .285 | 3.82 | 3.87 | 100 | 102 |
| Taijuan Walker | 128.7 | 554 | 20.0% | 8.5% | .285 | 4.06 | 4.09 | 107 | 107 |
| Danny Farquhar | 70.3 | 294 | 27.6% | 8.5% | .295 | 2.94 | 2.89 | 77 | 76 |
| J.A. Happ | 130.3 | 568 | 19.5% | 8.6% | .287 | 4.28 | 4.23 | 112 | 111 |
| Roenis Elias | 139.7 | 613 | 18.6% | 9.3% | .290 | 4.32 | 4.40 | 113 | 115 |
| Charlie Furbush | 51.7 | 214 | 28.5% | 7.9% | .289 | 3.14 | 3.11 | 82 | 82 |
| Fernando Rodney | 58.0 | 250 | 26.0% | 10.8% | .296 | 3.26 | 3.17 | 86 | 83 |
| Carson Smith | 56.3 | 240 | 21.7% | 8.8% | .288 | 3.36 | 3.47 | 88 | 91 |
| Tom Wilhelmsen | 70.3 | 302 | 22.2% | 10.9% | .268 | 3.45 | 3.65 | 91 | 96 |
| Mike Kickham | 140.7 | 627 | 18.7% | 10.2% | .299 | 4.41 | 4.29 | 116 | 112 |
| Danny Hultzen | 62.0 | 280 | 18.9% | 12.9% | .291 | 4.21 | 4.44 | 110 | 116 |
| Tyler Olson | 110.3 | 480 | 15.2% | 6.9% | .292 | 4.40 | 4.32 | 115 | 113 |
| Dominic Leone | 66.0 | 282 | 22.3% | 8.9% | .286 | 3.55 | 3.62 | 93 | 95 |
| Chris Young | 122.7 | 536 | 15.1% | 8.4% | .272 | 4.48 | 4.75 | 118 | 125 |
| Sam Gaviglio | 107.0 | 473 | 16.3% | 8.2% | .298 | 4.46 | 4.42 | 117 | 116 |
| Yoervis Medina | 65.3 | 285 | 23.5% | 11.6% | .292 | 3.58 | 3.62 | 94 | 95 |
| Erasmo Ramirez | 140.3 | 612 | 16.2% | 7.2% | .291 | 4.55 | 4.51 | 119 | 118 |
| Mayckol Guaipe | 57.3 | 239 | 20.1% | 4.6% | .288 | 3.77 | 3.81 | 99 | 100 |
| Todd Coffey | 29.3 | 129 | 17.8% | 9.3% | .292 | 3.99 | 4.26 | 105 | 112 |
| Jordan Pries | 115.7 | 511 | 14.9% | 8.2% | .289 | 4.75 | 4.67 | 125 | 122 |
| David Rollins | 94.0 | 421 | 17.1% | 10.0% | .293 | 4.79 | 4.79 | 126 | 126 |
| Joe Beimel | 34.0 | 151 | 14.6% | 9.3% | .282 | 4.50 | 4.46 | 118 | 117 |
| Mike MacDougal | 22.0 | 102 | 16.7% | 13.7% | .299 | 4.91 | 4.85 | 129 | 127 |
| Mark Lowe | 45.0 | 200 | 20.0% | 10.5% | .288 | 4.40 | 4.39 | 115 | 115 |
| Lucas Luetge | 62.7 | 278 | 19.4% | 10.8% | .288 | 4.45 | 4.33 | 117 | 114 |
| Anthony Fernandez | 84.3 | 384 | 13.3% | 9.6% | .294 | 5.44 | 5.30 | 143 | 139 |
| Zach Miner | 57.0 | 265 | 11.3% | 10.9% | .294 | 5.53 | 5.62 | 145 | 147 |
| Stephen Landazuri | 105.0 | 470 | 16.4% | 9.1% | .288 | 5.31 | 5.33 | 139 | 140 |
| Forrest Snow | 82.3 | 378 | 15.9% | 11.4% | .295 | 5.36 | 5.32 | 141 | 139 |
| Edgar Olmos | 64.0 | 295 | 15.3% | 12.2% | .292 | 5.06 | 5.21 | 133 | 137 |
| Victor Sanchez | 117.0 | 515 | 13.8% | 6.2% | .291 | 5.38 | 5.17 | 141 | 136 |
| Justin Germano | 137.3 | 606 | 12.4% | 5.3% | .296 | 5.44 | 5.22 | 143 | 137 |
| Andrew Carraway | 121.7 | 551 | 11.3% | 8.2% | .293 | 5.55 | 5.35 | 146 | 140 |
| Chance Ruffin | 80.0 | 367 | 13.4% | 9.8% | .297 | 5.85 | 5.63 | 153 | 148 |
| Tyler Pike | 99.3 | 485 | 13.8% | 16.5% | .291 | 6.25 | 6.41 | 164 | 168 |
***
Pitchers, Assorted Other
| Player | IP | K/9 | BB/9 | HR/9 | ERA+ | zWAR | No. 1 Comp |
|---|---|---|---|---|---|---|---|
| Felix Hernandez | 217.3 | 9.28 | 1.91 | 0.62 | 137 | 5.6 | Mike Mussina |
| Hisashi Iwakuma | 170.0 | 7.57 | 1.54 | 1.01 | 109 | 2.8 | Scott Sanderson |
| James Paxton | 113.0 | 7.25 | 3.27 | 0.80 | 95 | 1.2 | Brandon Claussen |
| Taijuan Walker | 128.7 | 7.76 | 3.29 | 0.98 | 89 | 0.9 | Freddy Garcia |
| Danny Farquhar | 70.3 | 10.37 | 3.20 | 0.64 | 123 | 0.8 | Bobby Castillo |
| J.A. Happ | 130.3 | 7.67 | 3.38 | 1.11 | 85 | 0.6 | Bob McClure |
| Roenis Elias | 139.7 | 7.34 | 3.67 | 1.03 | 84 | 0.6 | Ed Vosberg |
| Charlie Furbush | 51.7 | 10.62 | 2.96 | 0.87 | 115 | 0.5 | George Sherrill |
| Fernando Rodney | 58.0 | 10.09 | 4.19 | 0.62 | 111 | 0.4 | Rudy Seanez |
| Carson Smith | 56.3 | 8.31 | 3.36 | 0.64 | 108 | 0.4 | Wayne Nix |
| Tom Wilhelmsen | 70.3 | 8.58 | 4.22 | 0.77 | 105 | 0.4 | Marc Wilkins |
| Mike Kickham | 140.7 | 7.48 | 4.09 | 0.90 | 82 | 0.3 | Lance Caraccioli |
| Danny Hultzen | 62.0 | 7.69 | 5.23 | 0.73 | 86 | 0.3 | Matt Miller |
| Tyler Olson | 110.3 | 5.96 | 2.69 | 0.98 | 82 | 0.3 | Hilly Hathaway |
| Dominic Leone | 66.0 | 8.59 | 3.41 | 0.82 | 102 | 0.3 | Josh Kinney |
| Chris Young | 122.7 | 5.94 | 3.30 | 1.25 | 81 | 0.2 | Steve Trachsel |
| Sam Gaviglio | 107.0 | 6.48 | 3.28 | 1.01 | 81 | 0.2 | Brian Allard |
| Yoervis Medina | 65.3 | 9.23 | 4.55 | 0.69 | 101 | 0.2 | Mark Acre |
| Erasmo Ramirez | 140.3 | 6.35 | 2.82 | 1.15 | 79 | 0.1 | David Pauley |
| Mayckol Guaipe | 57.3 | 7.54 | 1.73 | 1.10 | 96 | 0.1 | Dan Giese |
| Todd Coffey | 29.3 | 7.06 | 3.69 | 0.92 | 91 | -0.1 | Milo Candini |
| Jordan Pries | 115.7 | 5.91 | 3.27 | 1.09 | 76 | -0.2 | Zach McClellan |
| David Rollins | 94.0 | 6.89 | 4.02 | 1.15 | 76 | -0.3 | Mike Matthews |
| Joe Beimel | 34.0 | 5.82 | 3.71 | 1.06 | 80 | -0.3 | Boom-Boom Beck |
| Mike MacDougal | 22.0 | 6.95 | 5.73 | 0.82 | 74 | -0.3 | Pete Appleton |
| Mark Lowe | 45.0 | 8.00 | 4.20 | 1.20 | 82 | -0.3 | Jason Bullard |
| Lucas Luetge | 62.7 | 7.75 | 4.31 | 1.00 | 81 | -0.5 | Carl Schutz |
| Anthony Fernandez | 84.3 | 5.44 | 3.95 | 1.28 | 66 | -0.9 | Tommy Phelps |
| Zach Miner | 57.0 | 4.74 | 4.58 | 1.26 | 65 | -0.9 | Mike Sullivan |
| Stephen Landazuri | 105.0 | 6.60 | 3.69 | 1.54 | 68 | -0.9 | Steve Rogers |
| Forrest Snow | 82.3 | 6.56 | 4.70 | 1.31 | 68 | -1.0 | Paul Morse |
| Edgar Olmos | 64.0 | 6.33 | 5.06 | 1.13 | 71 | -1.0 | Jason Hill |
| Victor Sanchez | 117.0 | 5.46 | 2.46 | 1.54 | 67 | -1.2 | Robert Averette |
| Justin Germano | 137.3 | 4.92 | 2.10 | 1.57 | 67 | -1.5 | Dave Johnson |
| Andrew Carraway | 121.7 | 4.59 | 3.33 | 1.33 | 65 | -1.5 | Kip Bouknight |
| Chance Ruffin | 80.0 | 5.51 | 4.05 | 1.46 | 62 | -1.5 | Kevin Vent |
| Tyler Pike | 99.3 | 6.07 | 7.25 | 1.36 | 58 | -2.1 | Sebern Wright |
***
Disclaimer: ZiPS projections are computer-based projections of performance. Performances have not been allocated to predicted playing time in the majors — many of the players listed above are unlikely to play in the majors at all in 2014. ZiPS is projecting equivalent production — a .240 ZiPS projection may end up being .280 in AAA or .300 in AA, for example. Whether or not a player will play is one of many non-statistical factors one has to take into account when predicting the future.
Players are listed with their most recent teams unless Dan has made a mistake. This is very possible as a lot of minor-league signings are generally unreported in the offseason.
ZiPS is projecting based on the AL having a 3.93 ERA and the NL having a 3.75 ERA.
Players that are expected to be out due to injury are still projected. More information is always better than less information and a computer isn’t what should be projecting the injury status of, for example, a pitcher with Tommy John surgery.
Regarding ERA+ vs. ERA- (and FIP+ vs. FIP-) and the differences therein: as Patriot notes here, they are not simply mirror images of each other. Writes Patriot: “ERA+ does not tell you that a pitcher’s ERA was X% less or more than the league’s ERA. It tells you that the league’s ERA was X% less or more than the pitcher’s ERA.”
Both hitters and pitchers are ranked by projected zWAR — which is to say, WAR values as calculated by Dan Szymborski, whose surname is spelled with a z. WAR values might differ slightly from those which appear in full release of ZiPS. Finally, Szymborski will advise anyone against — and might karate chop anyone guilty of — merely adding up WAR totals on depth chart to produce projected team WAR.
Carson Cistulli has published a book of aphorisms called Spirited Ejaculations of a New Enthusiast.
(looks at bottom of batter comps)
(blinks)
Tell me that was a joke. I’m not going crazy, right? Right?
He does look a lot like Burt. I love these random jokes in the ZiPS projections.