2019 ZiPS Projections – Chicago White Sox

After having typically appeared in the hallowed pages of Baseball Think Factory, Dan Szymborski’s ZiPS projections have now been released at FanGraphs for more than half a decade. The exercise continues this offseason. Below are the projections for the Chicago White Sox.
Batters
If only an outfielder was available in the free agent market, one who could bring a significant boost to a contending team!
Shoot, I’m self-plagiarizing. Let me try again.
If only an outfielder was available in the free agent market, one who could bring nearly as much of a boost to a rebuilding team as Bryce Harper could!
The White Sox have all but held a press conference to proclaim that they’re out on Harper and it’s a shame, really. While I like Manny Machado slightly better on a pure value basis (the loss of whom not doubt still stings on the south side), Harper’s upside is probably less “known” than Machado’s, so he would be an interesting play for a rebuilding team. The White Sox have been unable to develop their own Bryce Harper, because, well, it’s really hard to develop Bryce Harpers. Harper would not have gotten this team to the playoffs in 2019 without some very unexpected things happening, but you can say much the same about Machado. Plus, the White Sox have exactly one interesting outfielder on the roster at the moment, whereas Yoan Moncada, Yolmer Sanchez, and Tim Anderson could all conceivably contribute to a postseason contender.
Don’t be alarmed by the “1.9” next to Jimenez’ name on the depth chart. The reason that number is so low is that ZiPS has questions about Jimenez’s outfield defense, and the depth chart is only projecting Jimenez for 455 plate appearances. More boxes to check and all that! ZiPS has no questions about Jimenez’s ability to rake, however. A .289/.338/.525 projected line with a 133 OPS+ and 28 home runs would get Eloy Rookie of the Year votes even if he played defense like Todd Hundley in an Ambien daze.
The projected upside for Moncada goes a bit lower every year, with the computer as frustrated with his inconsistent attempts at improving his plate discipline as the White Sox likely are. Just as disappointing, Moncada was a roughly league-average player in 2018, but it took a .344 BABIP for him to maintain a mere .235 BA. If he can’t bring that number up, he needs 10-15 home runs or a shockingly good glove at third to move him out of the “frustratingly average” category. Average players have value, but the White Sox were hoping for more.
I’m avoiding talking about the rest of the outfield because, well, you can guess why.
Pitchers
It’s hard to overestimate the hit the White Sox took from the loss of Michael Kopech, both in terms of the injury itself and the lost development time for a pitcher who still needs some refinement. I briefly considered excluding the Kopech projection out of mercy, but I didn’t want to overturn the precedent I’ve set of showing projections for pitchers missing the season due to injury. Kopech has the most bifurcated ZiPS projections I can remember; instead of some variant of a pretty little curve over some projected midpoint, it was bimodal.
In layman’s terms, ZiPS thought there was a better chance that Kopech would be a star or a scrub than simply a league-average pitcher. In the last year, ZiPS has been leaning more to the good side than the bad. Kopech had progressed to the point where, in terms of his rest-of-career value, ZiPS saw him as the No. 14 pitcher in the majors. The only other rookie-eligible pitcher in the top 50 is Mike Soroka.
As usual, ZiPS is high on Carlos Rodon and probably won’t be dissuaded until he has a whole healthy season and struggles. ZiPS is much less confident when it comes to Reynaldo Lopez, with the system not seeing enough historical evidence, nor anything specific to Lopez, to convince it that him exceeding his FIP by three-quarters of a run is his natural level of ability. That’s not to say that the White Sox should give up on him — you should give pitchers like this every chance to prove the numbers wrong — but it is a reason to mute the excitement a bit.
Bench and Prospects
I’ve already talked a lot about Jimenez and Kopech, given how significant Jimenez will be to the 2019 team and Kopech would have been prior to his injury. While the center field and left field projections are almost shockingly bleak, ZiPS does think that Luis Alexander Basabe is the best option in center in the system right now. ZiPS projects Nick Madrigal as a high-floor second baseman, and through all the injuries, still sees Luis Robert peaking with an OPS+ around 100. Both Dane Dunning and Dylan Cease have passed the 90 ERA+ mark in the projections; ZiPS thinks the former is the second-best pitcher in the rotation right now.
I talked about it in Chicago’s Elegy, but 2018 was a season that would try any team’s patience. With so many injuries and setbacks, the White Sox aren’t that much closer to knowing what their future core will look like than they were a year ago. It’s easy to feel very down on the team right now, given the projections and the news that neither Harper or Machado will be paid a guaranteed rate by the Sox over the next decade. But there remains a lot of talent in the system that could turn the team around very quickly. It’s just not likely to be in 2019.
One pedantic note for 2019: for the WAR graphic, I’m using FanGraphs’ Depth Charts playing time, not the playing time ZiPS spits out, so there will be occasional differences in WAR totals.
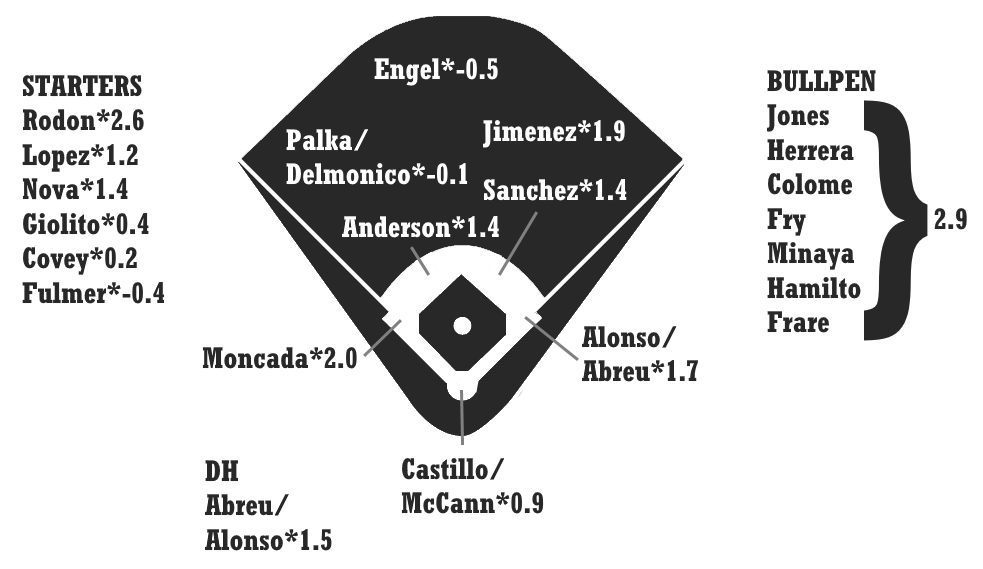
Ballpark graphic courtesy Eephus League. Depth charts constructed by way of those listed here at site.
| Player | B | Age | PO | G | AB | R | H | 2B | 3B | HR | RBI | BB | SO | SB | CS |
|---|---|---|---|---|---|---|---|---|---|---|---|---|---|---|---|
| Eloy Jimenez | R | 22 | LF | 130 | 505 | 67 | 146 | 27 | 4 | 28 | 71 | 36 | 111 | 0 | 2 |
| Yoan Moncada | B | 24 | 2B | 145 | 561 | 76 | 131 | 24 | 5 | 21 | 61 | 70 | 208 | 19 | 8 |
| Jose Abreu | R | 32 | 1B | 140 | 555 | 70 | 152 | 33 | 2 | 23 | 87 | 36 | 119 | 2 | 0 |
| Yolmer Sanchez | B | 27 | 3B | 154 | 557 | 63 | 136 | 28 | 7 | 11 | 58 | 39 | 133 | 11 | 6 |
| Tim Anderson | R | 26 | SS | 154 | 611 | 78 | 154 | 27 | 5 | 18 | 63 | 24 | 167 | 25 | 6 |
| Yonder Alonso | L | 32 | 1B | 134 | 444 | 61 | 109 | 18 | 0 | 23 | 66 | 57 | 122 | 1 | 0 |
| Danny Mendick | R | 25 | SS | 128 | 454 | 52 | 100 | 20 | 1 | 11 | 44 | 40 | 114 | 13 | 7 |
| Jose Rondon | R | 25 | SS | 117 | 434 | 49 | 102 | 19 | 3 | 13 | 49 | 23 | 119 | 8 | 6 |
| Luis Alexander Basabe | B | 22 | CF | 122 | 456 | 52 | 99 | 15 | 5 | 14 | 44 | 46 | 170 | 12 | 12 |
| Welington Castillo | R | 32 | C | 88 | 305 | 31 | 72 | 12 | 0 | 12 | 38 | 20 | 93 | 1 | 0 |
| Leury Garcia | B | 28 | LF | 94 | 316 | 35 | 82 | 12 | 3 | 6 | 35 | 14 | 83 | 13 | 4 |
| James McCann | R | 29 | C | 114 | 394 | 34 | 91 | 14 | 1 | 10 | 44 | 26 | 115 | 0 | 2 |
| Brandon Guyer | R | 33 | RF | 100 | 240 | 31 | 54 | 12 | 1 | 7 | 26 | 18 | 59 | 2 | 1 |
| Nick Madrigal | R | 22 | 2B | 99 | 364 | 40 | 93 | 16 | 2 | 3 | 23 | 17 | 38 | 12 | 16 |
| Luis Robert | R | 21 | CF | 75 | 267 | 27 | 63 | 11 | 1 | 5 | 18 | 22 | 100 | 17 | 8 |
| Zack Collins | L | 24 | C | 112 | 398 | 52 | 70 | 15 | 1 | 14 | 45 | 74 | 191 | 2 | 1 |
| Laz Rivera | R | 24 | SS | 117 | 472 | 52 | 110 | 20 | 2 | 7 | 40 | 13 | 111 | 11 | 8 |
| Johnny Giavotella | R | 31 | 2B | 88 | 314 | 36 | 80 | 16 | 2 | 4 | 28 | 23 | 49 | 3 | 2 |
| Nick Delmonico | L | 26 | LF | 94 | 323 | 41 | 73 | 17 | 2 | 12 | 38 | 33 | 99 | 2 | 1 |
| Jon Jay | L | 34 | RF | 131 | 433 | 58 | 108 | 16 | 3 | 3 | 28 | 29 | 91 | 3 | 2 |
| Matt Skole | L | 29 | 1B | 118 | 420 | 52 | 88 | 19 | 1 | 16 | 48 | 51 | 145 | 2 | 1 |
| Patrick Leonard | R | 26 | 3B | 123 | 455 | 49 | 97 | 23 | 1 | 10 | 44 | 35 | 168 | 5 | 2 |
| D.J. Peterson | R | 27 | 3B | 118 | 449 | 49 | 100 | 20 | 1 | 17 | 52 | 26 | 143 | 2 | 1 |
| Seby Zavala | R | 25 | C | 101 | 382 | 42 | 81 | 17 | 1 | 12 | 43 | 27 | 139 | 1 | 2 |
| Daniel Palka | L | 27 | LF | 126 | 469 | 62 | 104 | 17 | 2 | 27 | 69 | 38 | 180 | 5 | 4 |
| Luis Gonzalez | L | 23 | CF | 113 | 469 | 52 | 102 | 23 | 4 | 10 | 45 | 38 | 131 | 6 | 7 |
| Jake Elmore | R | 32 | 2B | 106 | 324 | 34 | 75 | 9 | 1 | 1 | 21 | 40 | 65 | 8 | 5 |
| Alex Presley | L | 33 | LF | 83 | 298 | 30 | 68 | 9 | 2 | 4 | 22 | 20 | 73 | 3 | 3 |
| Ryan Brett | R | 27 | CF | 71 | 266 | 27 | 58 | 11 | 1 | 5 | 23 | 9 | 78 | 6 | 2 |
| Alfredo Gonzalez | R | 26 | C | 72 | 243 | 23 | 48 | 6 | 0 | 3 | 16 | 20 | 79 | 2 | 1 |
| Adam Engel | R | 27 | CF | 135 | 466 | 52 | 94 | 18 | 4 | 9 | 36 | 30 | 159 | 20 | 8 |
| Ryan Cordell | R | 27 | CF | 84 | 320 | 34 | 64 | 11 | 3 | 9 | 32 | 19 | 110 | 8 | 3 |
| Gerson Montilla | R | 29 | 3B | 89 | 330 | 34 | 72 | 10 | 0 | 10 | 34 | 20 | 85 | 3 | 3 |
| Chris Johnson | R | 34 | 3B | 70 | 203 | 18 | 45 | 8 | 0 | 5 | 20 | 10 | 77 | 1 | 0 |
| Charlie Tilson | L | 26 | CF | 103 | 385 | 37 | 90 | 11 | 4 | 2 | 28 | 25 | 81 | 13 | 6 |
| Jacob May | B | 27 | CF | 97 | 372 | 34 | 83 | 13 | 2 | 2 | 24 | 20 | 107 | 17 | 10 |
| Ryan Goins | L | 31 | 2B | 107 | 309 | 30 | 66 | 13 | 1 | 5 | 29 | 23 | 85 | 3 | 2 |
| Casey Gillaspie | B | 26 | 1B | 105 | 386 | 44 | 80 | 17 | 1 | 12 | 40 | 38 | 133 | 1 | 1 |
| Todd Cunningham | B | 30 | RF | 93 | 301 | 37 | 69 | 13 | 2 | 3 | 24 | 29 | 60 | 9 | 5 |
| Gavin Sheets | L | 23 | 1B | 124 | 480 | 55 | 111 | 19 | 1 | 7 | 49 | 43 | 109 | 1 | 0 |
| Micker Adolfo | R | 22 | RF | 102 | 391 | 46 | 81 | 17 | 2 | 13 | 46 | 28 | 161 | 2 | 1 |
| Bryant Flete | B | 26 | 2B | 104 | 358 | 36 | 72 | 12 | 2 | 5 | 25 | 29 | 114 | 4 | 5 |
| Blake Rutherford | L | 22 | RF | 118 | 471 | 48 | 106 | 20 | 5 | 6 | 44 | 29 | 119 | 10 | 8 |
| Joel Booker | R | 25 | LF | 114 | 455 | 47 | 95 | 15 | 1 | 5 | 30 | 28 | 149 | 17 | 11 |
| Mitch Roman | R | 24 | 2B | 118 | 437 | 39 | 86 | 11 | 2 | 3 | 27 | 26 | 147 | 12 | 5 |
| Keon Barnum | L | 26 | 1B | 97 | 352 | 34 | 63 | 10 | 1 | 14 | 40 | 21 | 170 | 0 | 0 |
| Trey Michalczewski | B | 24 | 2B | 128 | 468 | 44 | 90 | 18 | 4 | 9 | 44 | 31 | 184 | 4 | 2 |
| Mason Robbins | L | 26 | RF | 107 | 417 | 36 | 96 | 12 | 3 | 4 | 30 | 11 | 93 | 3 | 2 |
| Player | PA | BA | OBP | SLG | OPS+ | ISO | BABIP | RC/27 | Def | WAR | No. 1 Comp |
|---|---|---|---|---|---|---|---|---|---|---|---|
| Eloy Jimenez | 547 | .289 | .338 | .525 | 133 | .236 | .322 | 6.7 | -7 | 2.3 | Greg Luzinski |
| Yoan Moncada | 639 | .234 | .320 | .406 | 99 | .173 | .331 | 4.6 | -2 | 2.0 | Rickie Weeks |
| Jose Abreu | 609 | .274 | .330 | .465 | 116 | .191 | .312 | 5.7 | -3 | 1.7 | Juan Gonzalez |
| Yolmer Sanchez | 609 | .244 | .299 | .379 | 86 | .135 | .303 | 4.0 | 6 | 1.4 | Robb Quinlan |
| Tim Anderson | 644 | .252 | .284 | .401 | 86 | .149 | .319 | 4.3 | -1 | 1.4 | Shawon Dunston |
| Yonder Alonso | 505 | .245 | .333 | .441 | 111 | .196 | .288 | 5.3 | -3 | 1.2 | Paul Sorrento |
| Danny Mendick | 506 | .220 | .292 | .341 | 74 | .121 | .271 | 3.4 | 5 | 0.9 | Angel Gonzalez |
| Jose Rondon | 465 | .235 | .275 | .382 | 79 | .147 | .295 | 3.6 | 4 | 0.9 | Jose Castro |
| Luis Alexander Basabe | 513 | .217 | .293 | .364 | 80 | .147 | .313 | 3.4 | 4 | 0.7 | Brad Snyder |
| Welington Castillo | 330 | .236 | .288 | .393 | 86 | .157 | .300 | 4.0 | -2 | 0.6 | Terry Kennedy |
| Leury Garcia | 340 | .259 | .298 | .373 | 84 | .114 | .335 | 4.2 | 5 | 0.6 | Mariano Duncan |
| James McCann | 427 | .231 | .284 | .348 | 73 | .117 | .301 | 3.4 | 1 | 0.4 | Mike DiFelice |
| Brandon Guyer | 277 | .225 | .322 | .371 | 91 | .146 | .270 | 4.2 | 0 | 0.4 | Mike Devereaux |
| Nick Madrigal | 399 | .255 | .303 | .335 | 76 | .080 | .279 | 3.1 | 6 | 0.3 | Alberto Callaspo |
| Luis Robert | 299 | .236 | .312 | .341 | 81 | .105 | .358 | 3.8 | -1 | 0.3 | Jimmy Wynn |
| Zack Collins | 478 | .176 | .305 | .324 | 74 | .148 | .290 | 3.2 | -5 | 0.2 | Brian Deak |
| Laz Rivera | 512 | .233 | .277 | .328 | 66 | .095 | .291 | 3.1 | 4 | 0.1 | Diory Hernandez |
| Johnny Giavotella | 344 | .255 | .304 | .357 | 82 | .102 | .291 | 3.9 | -2 | 0.1 | Dave Berg |
| Nick Delmonico | 363 | .226 | .304 | .402 | 93 | .176 | .288 | 4.3 | -3 | 0.0 | Danny Putnam |
| Jon Jay | 482 | .249 | .316 | .321 | 77 | .072 | .310 | 3.6 | 4 | 0.0 | Dick Porter |
| Matt Skole | 476 | .210 | .298 | .374 | 84 | .164 | .278 | 3.8 | 1 | 0.0 | Steve Neal |
| Patrick Leonard | 498 | .213 | .275 | .334 | 67 | .121 | .314 | 3.2 | 3 | -0.1 | Sean Mcnally |
| D.J. Peterson | 480 | .223 | .269 | .385 | 78 | .163 | .287 | 3.6 | -2 | -0.1 | Josh Klimek |
| Seby Zavala | 417 | .212 | .269 | .356 | 71 | .144 | .299 | 3.2 | -4 | -0.2 | Bill Hayes |
| Daniel Palka | 512 | .222 | .281 | .439 | 94 | .217 | .294 | 4.2 | -6 | -0.2 | Doug DeVore |
| Luis Gonzalez | 515 | .217 | .277 | .348 | 71 | .130 | .280 | 3.1 | 1 | -0.3 | Eric Verbryke |
| Jake Elmore | 372 | .231 | .322 | .275 | 68 | .043 | .287 | 3.0 | -2 | -0.3 | Jose Flores |
| Alex Presley | 323 | .228 | .280 | .312 | 64 | .084 | .290 | 3.0 | 5 | -0.4 | Armando Rios |
| Ryan Brett | 281 | .218 | .250 | .323 | 57 | .105 | .290 | 2.9 | 2 | -0.4 | Kyle Todd |
| Alfredo Gonzalez | 270 | .198 | .265 | .259 | 46 | .062 | .280 | 2.3 | 2 | -0.4 | Brad Erdman |
| Adam Engel | 512 | .202 | .261 | .315 | 58 | .114 | .285 | 2.9 | 3 | -0.5 | Fletcher Bates |
| Ryan Cordell | 345 | .200 | .246 | .338 | 59 | .138 | .274 | 2.9 | 1 | -0.5 | Michael Mooney |
| Gerson Montilla | 357 | .218 | .264 | .339 | 65 | .121 | .264 | 3.0 | 0 | -0.6 | Carlo Colombino |
| Chris Johnson | 215 | .222 | .260 | .335 | 63 | .113 | .331 | 3.1 | -3 | -0.6 | Wes Helms |
| Charlie Tilson | 418 | .234 | .283 | .299 | 61 | .065 | .291 | 3.0 | 0 | -0.6 | Clay Timpner |
| Jacob May | 403 | .223 | .268 | .285 | 53 | .062 | .308 | 2.6 | 4 | -0.7 | Tony Triplett |
| Ryan Goins | 339 | .214 | .266 | .311 | 59 | .097 | .279 | 2.8 | -1 | -0.8 | Kevin Baez |
| Casey Gillaspie | 428 | .207 | .278 | .350 | 72 | .142 | .282 | 3.3 | 0 | -0.8 | Steve Carver |
| Todd Cunningham | 347 | .229 | .313 | .316 | 75 | .086 | .277 | 3.4 | -5 | -0.8 | Doug Dascenzo |
| Gavin Sheets | 533 | .231 | .297 | .319 | 70 | .088 | .286 | 3.3 | 1 | -0.9 | Bryan Hansen |
| Micker Adolfo | 429 | .207 | .273 | .361 | 73 | .153 | .313 | 3.3 | -5 | -1.1 | Edgardo Baez |
| Bryant Flete | 396 | .201 | .272 | .288 | 55 | .087 | .280 | 2.5 | -2 | -1.2 | Jason Camilli |
| Blake Rutherford | 504 | .225 | .272 | .327 | 64 | .102 | .289 | 3.0 | 1 | -1.4 | Derrick May |
| Joel Booker | 501 | .209 | .270 | .279 | 52 | .070 | .299 | 2.5 | 3 | -1.8 | Juan Piniella |
| Mitch Roman | 475 | .197 | .246 | .252 | 38 | .055 | .289 | 2.1 | 2 | -1.8 | Gilberto Mejia |
| Keon Barnum | 378 | .179 | .228 | .332 | 52 | .153 | .292 | 2.5 | -2 | -1.9 | Bryon Gainey |
| Trey Michalczewski | 512 | .192 | .249 | .306 | 52 | .113 | .295 | 2.5 | -6 | -2.0 | Chris Shaddy |
| Mason Robbins | 432 | .230 | .248 | .302 | 51 | .072 | .288 | 2.6 | -3 | -2.3 | Manny Jimenez |
| Player | T | Age | W | L | ERA | G | GS | IP | H | ER | HR | BB | SO |
|---|---|---|---|---|---|---|---|---|---|---|---|---|---|
| Michael Kopech | R | 23 | 9 | 8 | 3.93 | 28 | 28 | 139.7 | 123 | 61 | 14 | 73 | 157 |
| Carlos Rodon | L | 26 | 8 | 7 | 4.15 | 23 | 23 | 130.0 | 126 | 60 | 16 | 56 | 114 |
| Dane Dunning | R | 24 | 6 | 6 | 4.35 | 19 | 19 | 101.3 | 102 | 49 | 13 | 39 | 85 |
| Ivan Nova | R | 32 | 8 | 9 | 4.63 | 24 | 24 | 136.0 | 150 | 70 | 24 | 30 | 100 |
| Reynaldo Lopez | R | 25 | 8 | 9 | 4.65 | 31 | 30 | 170.3 | 172 | 88 | 26 | 69 | 140 |
| Dylan Cease | R | 23 | 7 | 8 | 4.50 | 22 | 22 | 112.0 | 106 | 56 | 14 | 61 | 112 |
| Alex Colome | R | 30 | 6 | 4 | 3.46 | 67 | 0 | 65.0 | 60 | 25 | 6 | 21 | 63 |
| Jordan Guerrero | L | 25 | 8 | 10 | 4.92 | 25 | 25 | 126.3 | 140 | 69 | 17 | 54 | 93 |
| Jace Fry | L | 25 | 3 | 2 | 3.42 | 59 | 0 | 55.3 | 45 | 21 | 3 | 28 | 65 |
| Tanner Banks | L | 27 | 8 | 10 | 4.95 | 23 | 23 | 127.3 | 149 | 70 | 18 | 37 | 70 |
| Miguel Gonzalez | R | 35 | 6 | 8 | 4.91 | 21 | 21 | 113.7 | 126 | 62 | 17 | 37 | 73 |
| Bernardo Flores | L | 23 | 7 | 9 | 4.84 | 25 | 25 | 135.7 | 156 | 73 | 19 | 40 | 78 |
| Manny Banuelos | L | 28 | 6 | 7 | 4.66 | 29 | 16 | 94.7 | 93 | 49 | 13 | 51 | 92 |
| Lucas Giolito | R | 24 | 9 | 12 | 5.03 | 30 | 30 | 159.3 | 161 | 89 | 22 | 77 | 119 |
| Kodi Medeiros | L | 23 | 6 | 8 | 4.94 | 26 | 21 | 124.0 | 128 | 68 | 15 | 73 | 105 |
| Donn Roach | R | 29 | 6 | 8 | 4.92 | 21 | 19 | 113.3 | 130 | 62 | 15 | 36 | 60 |
| Juan Minaya | R | 28 | 4 | 4 | 4.02 | 63 | 0 | 65.0 | 59 | 29 | 6 | 33 | 67 |
| Kelvin Herrera | R | 29 | 3 | 3 | 3.93 | 55 | 0 | 50.3 | 49 | 22 | 7 | 15 | 49 |
| Jimmy Lambert | R | 24 | 7 | 9 | 4.98 | 20 | 20 | 103.0 | 112 | 57 | 16 | 39 | 77 |
| Chris Volstad | R | 32 | 5 | 7 | 4.84 | 28 | 14 | 100.3 | 116 | 54 | 13 | 27 | 53 |
| Aaron Bummer | L | 25 | 4 | 3 | 4.08 | 67 | 0 | 64.0 | 62 | 29 | 6 | 29 | 57 |
| Evan Marshall | R | 29 | 1 | 1 | 4.10 | 34 | 1 | 37.3 | 40 | 17 | 4 | 13 | 29 |
| Ian Hamilton | R | 24 | 5 | 4 | 4.18 | 53 | 0 | 60.3 | 58 | 28 | 8 | 21 | 55 |
| Dylan Covey | R | 27 | 8 | 11 | 5.26 | 30 | 25 | 133.3 | 146 | 78 | 19 | 61 | 91 |
| Nate Jones | R | 33 | 2 | 2 | 3.93 | 37 | 0 | 34.3 | 31 | 15 | 5 | 13 | 37 |
| Matt Tomshaw | L | 30 | 7 | 10 | 5.18 | 25 | 24 | 132.0 | 159 | 76 | 22 | 34 | 79 |
| Randall Delgado | R | 29 | 3 | 3 | 4.30 | 43 | 1 | 52.3 | 52 | 25 | 7 | 22 | 45 |
| Matt Foster | R | 24 | 3 | 4 | 4.37 | 46 | 0 | 55.7 | 55 | 27 | 7 | 26 | 52 |
| Jordan Stephens | R | 26 | 7 | 9 | 5.40 | 25 | 25 | 125.0 | 136 | 75 | 22 | 55 | 100 |
| Colton Turner | L | 28 | 4 | 5 | 4.63 | 37 | 2 | 56.3 | 57 | 29 | 7 | 27 | 47 |
| Zack Burdi | R | 24 | 2 | 2 | 4.38 | 22 | 0 | 24.7 | 21 | 12 | 3 | 16 | 28 |
| T.J. House | L | 29 | 5 | 7 | 5.45 | 19 | 15 | 77.7 | 87 | 47 | 9 | 45 | 50 |
| James Shields | R | 37 | 7 | 11 | 5.31 | 27 | 27 | 154.3 | 164 | 91 | 30 | 64 | 117 |
| Bruce Rondon | R | 28 | 3 | 3 | 4.60 | 47 | 0 | 43.0 | 38 | 22 | 4 | 31 | 51 |
| Robbie Ross Jr. | L | 30 | 1 | 1 | 4.66 | 35 | 0 | 36.7 | 35 | 19 | 3 | 24 | 34 |
| Jacob Lindgren | L | 26 | 0 | 1 | 4.97 | 11 | 0 | 12.7 | 11 | 7 | 2 | 11 | 15 |
| Alec Hansen | R | 24 | 5 | 7 | 5.40 | 19 | 19 | 93.3 | 93 | 56 | 14 | 67 | 87 |
| Caleb Frare | L | 25 | 3 | 4 | 4.79 | 50 | 0 | 56.3 | 49 | 30 | 7 | 42 | 65 |
| Tyler B. Johnson | R | 23 | 4 | 5 | 4.85 | 43 | 0 | 52.0 | 46 | 28 | 8 | 32 | 62 |
| Jose Ruiz | R | 24 | 2 | 2 | 4.82 | 50 | 0 | 56.0 | 55 | 30 | 7 | 35 | 56 |
| Thyago Vieira | R | 25 | 2 | 2 | 5.16 | 39 | 0 | 45.3 | 44 | 26 | 6 | 27 | 41 |
| Zach Thompson | R | 25 | 3 | 4 | 5.12 | 49 | 0 | 65.0 | 67 | 37 | 8 | 40 | 52 |
| Ryan Burr | R | 25 | 3 | 4 | 5.20 | 45 | 0 | 55.3 | 54 | 32 | 7 | 40 | 50 |
| Carson Fulmer | R | 25 | 7 | 11 | 5.68 | 31 | 21 | 107.7 | 116 | 68 | 17 | 69 | 85 |
| Asher Wojciechowski | R | 30 | 5 | 8 | 6.01 | 25 | 17 | 103.3 | 117 | 69 | 26 | 39 | 93 |
| Spencer Adams | R | 23 | 7 | 12 | 6.01 | 27 | 27 | 139.3 | 171 | 93 | 28 | 57 | 76 |
| Player | TBF | K/9 | BB/9 | HR/9 | BABIP | ERA+ | ERA- | FIP | WAR | No. 1 Comp |
|---|---|---|---|---|---|---|---|---|---|---|
| Michael Kopech | 616 | 10.12 | 4.70 | 0.90 | .301 | 109 | 92 | 3.99 | 2.4 | J.R. Richard |
| Carlos Rodon | 571 | 7.89 | 3.88 | 1.11 | .292 | 103 | 97 | 4.47 | 1.9 | Mickey McDermott |
| Dane Dunning | 444 | 7.55 | 3.46 | 1.15 | .296 | 98 | 102 | 4.47 | 1.3 | Kevin Brown |
| Ivan Nova | 584 | 6.62 | 1.99 | 1.59 | .297 | 92 | 108 | 4.77 | 1.2 | Mickey Weston |
| Reynaldo Lopez | 747 | 7.40 | 3.65 | 1.37 | .290 | 89 | 112 | 4.85 | 1.2 | Aaron Thompson |
| Dylan Cease | 501 | 9.00 | 4.90 | 1.13 | .299 | 92 | 109 | 4.57 | 1.0 | Dick Ruthven |
| Alex Colome | 275 | 8.72 | 2.91 | 0.83 | .297 | 124 | 81 | 3.52 | 1.0 | Jeff Tam |
| Jordan Guerrero | 570 | 6.63 | 3.85 | 1.21 | .308 | 87 | 115 | 4.88 | 0.8 | Jake Chapman |
| Jace Fry | 238 | 10.57 | 4.55 | 0.49 | .300 | 125 | 80 | 3.13 | 0.8 | Brian Snyder |
| Tanner Banks | 565 | 4.95 | 2.62 | 1.27 | .303 | 87 | 116 | 4.95 | 0.7 | Bill Latham |
| Miguel Gonzalez | 500 | 5.78 | 2.93 | 1.35 | .296 | 87 | 115 | 4.92 | 0.7 | Pat Ahearne |
| Bernardo Flores | 600 | 5.17 | 2.65 | 1.26 | .301 | 86 | 117 | 4.88 | 0.7 | Jeff Mutis |
| Manny Banuelos | 426 | 8.75 | 4.85 | 1.24 | .302 | 89 | 112 | 4.77 | 0.6 | Eddie Oropesa |
| Lucas Giolito | 716 | 6.72 | 4.35 | 1.24 | .286 | 82 | 121 | 5.13 | 0.5 | Scott Holman |
| Kodi Medeiros | 571 | 7.62 | 5.30 | 1.09 | .305 | 84 | 119 | 4.96 | 0.5 | Ken Chase |
| Donn Roach | 502 | 4.76 | 2.86 | 1.19 | .299 | 84 | 119 | 4.92 | 0.4 | Don Nottebart |
| Juan Minaya | 287 | 9.28 | 4.57 | 0.83 | .299 | 107 | 94 | 4.00 | 0.4 | Ruddy Lugo |
| Kelvin Herrera | 214 | 8.76 | 2.68 | 1.25 | .298 | 109 | 92 | 4.02 | 0.4 | Antonio Alfonseca |
| Jimmy Lambert | 458 | 6.73 | 3.41 | 1.40 | .300 | 83 | 120 | 4.98 | 0.4 | Jake Joseph |
| Chris Volstad | 441 | 4.75 | 2.42 | 1.17 | .300 | 86 | 117 | 4.73 | 0.4 | Steve Sundra |
| Aaron Bummer | 281 | 8.02 | 4.08 | 0.84 | .301 | 105 | 95 | 4.09 | 0.3 | Pete Cappadona |
| Evan Marshall | 164 | 6.99 | 3.13 | 0.96 | .310 | 101 | 99 | 4.19 | 0.3 | Steve Comer |
| Ian Hamilton | 259 | 8.20 | 3.13 | 1.19 | .291 | 102 | 98 | 4.24 | 0.3 | Chad Bradford |
| Dylan Covey | 601 | 6.14 | 4.12 | 1.28 | .299 | 81 | 123 | 5.12 | 0.3 | Tim Byron |
| Nate Jones | 147 | 9.70 | 3.41 | 1.31 | .289 | 109 | 92 | 4.20 | 0.2 | Matt Karchner |
| Matt Tomshaw | 586 | 5.39 | 2.32 | 1.50 | .309 | 80 | 125 | 5.07 | 0.2 | Mark Hendrickson |
| Randall Delgado | 228 | 7.74 | 3.78 | 1.20 | .294 | 96 | 104 | 4.49 | 0.1 | Ed Farmer |
| Matt Foster | 247 | 8.41 | 4.20 | 1.13 | .302 | 98 | 102 | 4.48 | 0.1 | Rich DeLosSantos |
| Jordan Stephens | 564 | 7.20 | 3.96 | 1.58 | .300 | 79 | 126 | 5.33 | 0.1 | Mike Mills |
| Colton Turner | 252 | 7.51 | 4.31 | 1.12 | .298 | 92 | 108 | 4.69 | 0.1 | Chris Cumberland |
| Zack Burdi | 110 | 10.22 | 5.84 | 1.09 | .290 | 95 | 106 | 4.53 | 0.0 | Brad Voyles |
| T.J. House | 364 | 5.79 | 5.21 | 1.04 | .306 | 79 | 127 | 5.30 | 0.0 | Roger Deago |
| James Shields | 686 | 6.82 | 3.73 | 1.75 | .286 | 78 | 128 | 5.54 | 0.0 | Steve Trachsel |
| Bruce Rondon | 197 | 10.67 | 6.49 | 0.84 | .312 | 93 | 108 | 4.29 | 0.0 | Mike MacDougal |
| Robbie Ross Jr. | 171 | 8.35 | 5.89 | 0.74 | .305 | 92 | 109 | 4.73 | 0.0 | Jim Brewer |
| Jacob Lindgren | 59 | 10.66 | 7.82 | 1.42 | .290 | 86 | 116 | 5.44 | -0.1 | Mark Acre |
| Alec Hansen | 438 | 8.39 | 6.46 | 1.35 | .298 | 77 | 130 | 5.55 | -0.1 | Rick Berg |
| Caleb Frare | 260 | 10.38 | 6.71 | 1.12 | .296 | 89 | 112 | 4.91 | -0.2 | Scott Wiggins |
| Tyler B. Johnson | 235 | 10.73 | 5.54 | 1.38 | .295 | 88 | 113 | 4.84 | -0.2 | Brad Voyles |
| Jose Ruiz | 257 | 9.00 | 5.63 | 1.13 | .308 | 86 | 116 | 4.81 | -0.3 | Marc Pisciotta |
| Thyago Vieira | 207 | 8.14 | 5.36 | 1.19 | .292 | 83 | 121 | 5.05 | -0.3 | Ken Wright |
| Zach Thompson | 301 | 7.20 | 5.54 | 1.11 | .299 | 84 | 120 | 5.18 | -0.4 | Lloyd Allen |
| Ryan Burr | 259 | 8.13 | 6.51 | 1.14 | .296 | 80 | 126 | 5.32 | -0.5 | Darin Moore |
| Carson Fulmer | 508 | 7.11 | 5.77 | 1.42 | .301 | 73 | 137 | 5.77 | -0.5 | Charlie Zink |
| Asher Wojciechowski | 465 | 8.10 | 3.40 | 2.26 | .302 | 71 | 140 | 5.93 | -0.7 | Nerio Rodriguez |
| Spencer Adams | 642 | 4.91 | 3.68 | 1.81 | .302 | 71 | 140 | 6.07 | -0.8 | Luis Mendoza |
Disclaimer: ZiPS projections are computer-based projections of performance. Performances have not been allocated to predicted playing time in the majors — many of the players listed above are unlikely to play in the majors at all in 2019. ZiPS is projecting equivalent production — a .240 ZiPS projection may end up being .280 in Triple-A or .300 in Double-A, for example. Whether or not a player will play is one of many non-statistical factors one has to take into account when predicting the future.
Players are listed with their most recent teams, unless I have made a mistake. This is very possible, as a lot of minor-league signings go generally unreported in the offseason.
ZiPS’ projections are based on the American League having a 4.29 ERA and the National League having a 4.15 ERA.
Players who are expected to be out due to injury are still projected. More information is always better than less information, and a computer isn’t the tool that should project the injury status of, for example, a pitcher who has had Tommy John surgery.
Both hitters and pitchers are ranked by projected zWAR — which is to say, WAR values as calculated by me, Dan Szymborski, whose surname is spelled with a z. WAR values might differ slightly from those which appear in the full release of ZiPS. Finally, I will advise anyone against — and might karate chop anyone guilty of — merely adding up WAR totals on a depth chart to produce projected team WAR.
Dan Szymborski is a senior writer for FanGraphs and the developer of the ZiPS projection system. He was a writer for ESPN.com from 2010-2018, a regular guest on a number of radio shows and podcasts, and a voting BBWAA member. He also maintains a terrible Twitter account at @DSzymborski.
Well, they did say that someday Yoan Moncada would be the best player on the team.
They weren’t wrong.
There is a moral in this story: No matter how loud your tools are, never slap an FV70 (or an FV65, and probably not even an FV60) on a guy whose scouting report reads “limited bat control” and “needs to overhaul his swing.” Everyone always thinks they’re getting Bryce Harper, but instead they’re getting Bo Jackson if they’re very, very lucky, and it’s more likely you wind up with Drew Stubbs.
I really believe that Moncada’s problem is not his swing, but his approach. He’s WAY too passive at the plate. He almost set the single-season strikeout record while having one of the lowest chase rates in the majors, which is preposterous. And he shattered the record for strikeouts looking in a season (85).