2019 ZiPS Projections – New York Mets

After having typically appeared in the hallowed pages of Baseball Think Factory, Dan Szymborski’s ZiPS projections have now been released at FanGraphs for more than half a decade. The exercise continues this offseason. Below are the projections for the New York Mets.
Batters
The lineup feels a lot like one fielded by the St. Louis Cardinals. There are no bonafide superstar projections on the offense (Robinson Cano‘s projections don’t look like they used to, though ZiPS thinks he’ll still be a good player) but there’s a surprising amount of depth, providing a number of solid options for those times when stuff hits the fan. That approach is a smart way for a team in contention to construct its roster, given that teams with serious playoff aspirations should be more risk-averse than middling or rebuilding teams are; depth is certainly a preferable strategy to hoping injuries somehow pass you by. There’s one thing St. Louis has that the New York Mets have lacked, however: a track record of actually doing a good job shuffling their offensive talent around. The Cardinals very rarely bury players, but the Mets have been known to do all sorts of weird things, such as going into seasons without an obvious starting job for Michael Conforto, signing Jose Reyes and then playing him way too often, prioritizing Jay Bruce’s playing time, and needing some bad luck on the injury front to actually give Brandon Nimmo a full-time job coming off a .379 on-base percentage in 69 games in 2017. Whether you want to blame their managers or ownership, the Mets have made some real head-scratching decisions.
And so while are a lot of options here, the Mets will have to prove that they can deploy their talent effectively. Jeff McNeil doesn’t have an obvious starting role, so the team has to demonstrate that they want to find at-bats for him, not just give them to him grudgingly as they did in 2018, only after the obviously worse options played very obviously worse. Once Peter Alonso is down in the minors just long enough to get another year of cost control for the Mets … errr … I mean once Peter Alonso is finished polishing his game coincidentally in just enough games to delay his free agency for a year, getting him playing time should be the priority over the more expensive Todd Frazier. Yoenis Cespedes‘ heel surgeries will likely keep the Mets from having to make any tricky outfield decisions (his ZiPS projection is mostly theoretical) for a while, but that won’t last forever.
Pitchers
I like Jed Lowrie, but if you could buy baseball players from a catalog, I’d be calling customer service and telling the agent “Yeah, there’s nothing wrong with him, and he works fine and everything, but do you have him in pitcher?” The front four looks very solid, but the team has given every indication that Jason Vargas will take the fifth starter job if no other options are acquired this winter. Remember what I said about how contending teams should be risk-averse? Vargas is an extremely risky pitcher, and even though it hasn’t been so long since he pretended to be Greg Maddux for a few months in early 2017, I’d really like the team to do better here, given the noise they’ve made about contending and the very real improvements in other parts of the roster.
Edwin Diaz is a significant addition, and it’s surprising how cheaply they were able to add Diaz and Cano to the roster, both in terms of money and prospects. Of all the ZiPS teams to go up on FanGraphs so far, Diaz has the highest projected WAR of any relief pitcher and the lowest ERA, by three-tenths of a run. And that’s not just because I’ve run bad teams; Craig Kimbrel, Kenley Jansen, Andrew Miller, and Brad Hand have already gone live. Signing Luis Avilan to just a minor league contract with a non-roster invitation to spring training may go down as one of the best low-key deals of the winter, and the back end of the bullpen is better than many think.
Bench and Prospects
Perhaps my favorite projection for the Mets this year is the league-average projection for minor league reliever Stephen Villines, who I suspect would attract the interest of my friend/mortal enemy/ex-FanGraphs editor Carson Cistulli. He’s not really on the prospect radar much, but he had an interesting first professional season, striking out 54 of 138 batters in the Sally League, 25 of 77 for Hi-A St. Lucie, and then after a final promotion to Double-A Binghamton, striking out 17 of 43 batters. That’s 96 strikeouts against just 13 walks and three homers in 66.2 innings. Now, if he was doing this by blowing batters away with a 95 mph fastball, he’d be on prospects lists. But he doesn’t — he’s a soft-tosser who gets by on changing speeds and a slow slider. But he’s also a sidearmer, with a motion that looks like he wants to throw submarine but gives up halfway and just whips it around, kinda like Terry Leach’s delivery (I’m dating myself). We’ve seen sidearmers/submariners survive with slower stuff than you’d expect was sustainable — guys like Chad Bradford and Mike Myers come to mind — so while Villines could blow up in a bad way against Triple-A hitters, I’m intrigued.
ZiPS already gives Andres Gimenez a win per 600 PA in 2019 and projects enough growth from him to make for an interesting decision for the Mets at shortstop in a few years. ZiPS has come off its love for Dominic Smith, but still thinks Dilson Herrera would at least be a good role player if he can stay healthy. Believe it or not, Herrera is still just 24 (he turns 25 in March) even though it feels like he’s been around forever. There’s really no room for him on the Mets the way the team is currently constructed, but he could still resurface elsewhere and have some type of major league career — people wrote off Jose Peraza at way too young an age, too.
One pedantic note for 2019: for the WAR graphic, I’m using FanGraphs’ depth chart playing time, not the playing time ZiPS spits out, so there will be occasional differences in WAR totals.
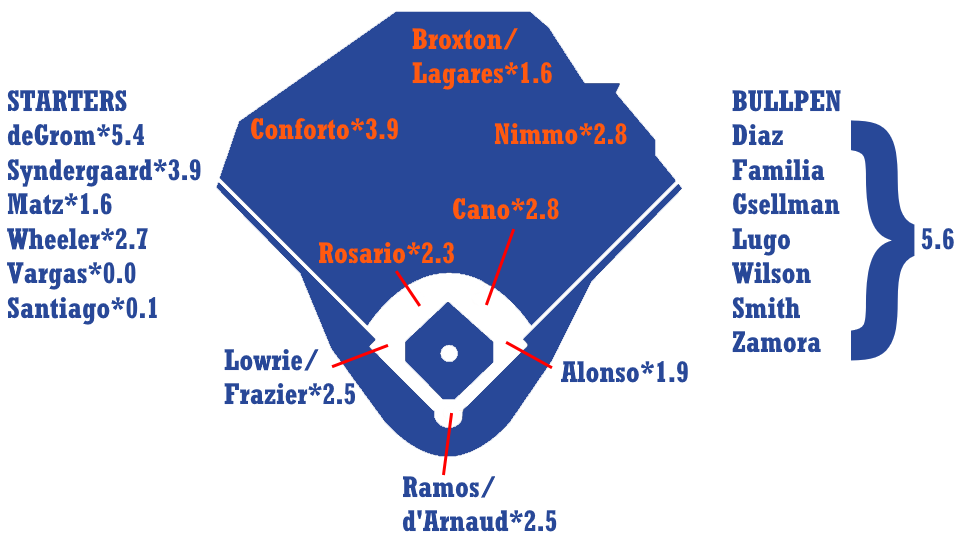
Ballpark graphic courtesy Eephus League. Depth charts constructed by way of those listed here at site.
| Player | B | Age | PO | G | AB | R | H | 2B | 3B | HR | RBI | BB | SO | SB | CS |
|---|---|---|---|---|---|---|---|---|---|---|---|---|---|---|---|
| Michael Conforto | L | 26 | LF | 145 | 495 | 77 | 124 | 26 | 1 | 28 | 86 | 72 | 148 | 3 | 3 |
| Jeff McNeil | L | 27 | 2B | 144 | 551 | 76 | 151 | 26 | 8 | 14 | 63 | 37 | 79 | 11 | 3 |
| Robinson Cano | L | 36 | 2B | 115 | 456 | 59 | 124 | 24 | 1 | 16 | 66 | 36 | 68 | 0 | 1 |
| Brandon Nimmo | L | 26 | CF | 135 | 445 | 67 | 107 | 23 | 5 | 13 | 47 | 71 | 138 | 7 | 5 |
| Yoenis Cespedes | R | 33 | LF | 96 | 360 | 51 | 93 | 18 | 2 | 20 | 63 | 28 | 96 | 4 | 1 |
| Jed Lowrie | B | 35 | 2B | 135 | 502 | 61 | 123 | 27 | 2 | 13 | 61 | 58 | 102 | 0 | 0 |
| Amed Rosario | R | 23 | SS | 156 | 583 | 77 | 155 | 26 | 10 | 11 | 55 | 29 | 117 | 25 | 10 |
| Peter Alonso | R | 24 | 1B | 122 | 460 | 64 | 110 | 23 | 1 | 24 | 71 | 49 | 134 | 1 | 3 |
| Todd Frazier | R | 33 | 3B | 127 | 455 | 60 | 102 | 21 | 0 | 21 | 72 | 51 | 120 | 8 | 5 |
| Wilson Ramos | R | 31 | C | 112 | 394 | 38 | 102 | 18 | 0 | 15 | 63 | 26 | 78 | 0 | 0 |
| J.D. Davis | R | 26 | 3B | 126 | 473 | 58 | 113 | 24 | 1 | 17 | 60 | 37 | 139 | 3 | 2 |
| Travis d’Arnaud | R | 30 | C | 94 | 316 | 35 | 76 | 14 | 1 | 11 | 42 | 23 | 64 | 0 | 0 |
| Luis Guillorme | L | 24 | SS | 121 | 423 | 45 | 103 | 17 | 2 | 2 | 31 | 41 | 68 | 3 | 2 |
| Christian Colon | R | 30 | 2B | 93 | 294 | 31 | 70 | 12 | 0 | 3 | 23 | 27 | 45 | 7 | 3 |
| Juan Lagares | R | 30 | CF | 97 | 250 | 30 | 62 | 10 | 3 | 3 | 19 | 11 | 51 | 6 | 3 |
| Keon Broxton | R | 29 | CF | 129 | 399 | 49 | 79 | 14 | 4 | 14 | 41 | 42 | 180 | 24 | 6 |
| Andres Gimenez | L | 20 | SS | 120 | 455 | 48 | 99 | 17 | 4 | 7 | 36 | 26 | 121 | 22 | 13 |
| Dilson Herrera | R | 25 | 2B | 113 | 379 | 44 | 84 | 15 | 2 | 12 | 43 | 29 | 116 | 4 | 5 |
| Dominic Smith | L | 24 | 1B | 147 | 542 | 63 | 132 | 28 | 2 | 14 | 60 | 38 | 134 | 2 | 0 |
| T.J. Rivera | R | 30 | 3B | 113 | 399 | 43 | 104 | 19 | 1 | 8 | 46 | 16 | 67 | 1 | 1 |
| Patrick Mazeika | L | 25 | C | 90 | 325 | 36 | 74 | 15 | 0 | 6 | 31 | 31 | 55 | 1 | 1 |
| Gavin Cecchini | R | 25 | 2B | 113 | 434 | 48 | 106 | 20 | 2 | 6 | 38 | 31 | 73 | 3 | 3 |
| Ali Sanchez | R | 22 | C | 90 | 327 | 30 | 70 | 13 | 1 | 5 | 27 | 14 | 54 | 3 | 3 |
| Will Toffey | L | 24 | 3B | 87 | 314 | 35 | 60 | 13 | 1 | 6 | 25 | 42 | 102 | 1 | 1 |
| Tomas Nido | R | 25 | C | 100 | 354 | 35 | 77 | 17 | 1 | 7 | 38 | 14 | 81 | 0 | 0 |
| Devin Mesoraco | R | 31 | C | 77 | 216 | 20 | 45 | 8 | 1 | 8 | 24 | 22 | 49 | 0 | 0 |
| Jose Reyes | B | 36 | 3B | 104 | 329 | 44 | 76 | 14 | 3 | 7 | 31 | 28 | 55 | 12 | 4 |
| Rymer Liriano | R | 28 | LF | 107 | 384 | 46 | 79 | 12 | 2 | 13 | 44 | 35 | 147 | 8 | 6 |
| Sam Haggerty | B | 25 | 3B | 101 | 362 | 41 | 70 | 16 | 4 | 4 | 27 | 45 | 121 | 20 | 7 |
| Colton Plaia | R | 28 | C | 61 | 199 | 20 | 39 | 8 | 0 | 4 | 18 | 16 | 70 | 0 | 0 |
| Rajai Davis | R | 38 | CF | 100 | 235 | 35 | 50 | 9 | 1 | 2 | 9 | 14 | 58 | 20 | 6 |
| Joey Terdoslavich | B | 30 | 1B | 95 | 342 | 38 | 77 | 15 | 1 | 9 | 37 | 33 | 77 | 1 | 1 |
| Adrian Gonzalez | L | 37 | 1B | 58 | 187 | 14 | 44 | 9 | 0 | 4 | 26 | 14 | 38 | 0 | 0 |
| Austin Jackson | R | 32 | CF | 102 | 333 | 34 | 79 | 17 | 2 | 4 | 31 | 26 | 104 | 4 | 3 |
| Matt den Dekker | L | 31 | CF | 101 | 331 | 35 | 66 | 13 | 3 | 9 | 35 | 24 | 111 | 7 | 4 |
| Johnny Monell | L | 33 | C | 79 | 261 | 27 | 52 | 10 | 1 | 5 | 26 | 21 | 77 | 1 | 1 |
| David Wright | R | 36 | 3B | 44 | 167 | 18 | 34 | 6 | 0 | 3 | 14 | 20 | 55 | 1 | 1 |
| Braxton Lee | L | 25 | RF | 112 | 406 | 41 | 91 | 13 | 2 | 2 | 26 | 36 | 94 | 9 | 10 |
| David Thompson | R | 25 | 3B | 111 | 401 | 42 | 86 | 20 | 1 | 9 | 42 | 21 | 110 | 5 | 3 |
| Ty Kelly | B | 30 | 2B | 120 | 347 | 39 | 74 | 15 | 3 | 5 | 34 | 37 | 88 | 2 | 2 |
| Cody Asche | L | 29 | 3B | 107 | 351 | 39 | 74 | 16 | 2 | 10 | 39 | 32 | 106 | 1 | 3 |
| Kevin Kaczmarski | L | 27 | CF | 102 | 355 | 37 | 78 | 13 | 4 | 2 | 26 | 32 | 92 | 8 | 7 |
| Kevin Taylor | L | 27 | LF | 120 | 429 | 42 | 98 | 16 | 2 | 3 | 32 | 32 | 72 | 1 | 1 |
| Luis Carpio | R | 21 | 2B | 124 | 458 | 44 | 90 | 17 | 1 | 10 | 37 | 37 | 125 | 10 | 10 |
| Desmond Lindsay | R | 22 | CF | 98 | 347 | 33 | 61 | 10 | 4 | 6 | 28 | 34 | 142 | 6 | 8 |
| Jhoan Urena | B | 24 | RF | 128 | 458 | 48 | 95 | 19 | 3 | 11 | 48 | 38 | 146 | 3 | 3 |
| Gregor Blanco | L | 35 | CF | 111 | 301 | 37 | 66 | 11 | 3 | 4 | 20 | 30 | 82 | 8 | 3 |
| Tim Tebow | L | 31 | LF | 97 | 333 | 28 | 58 | 12 | 1 | 7 | 25 | 21 | 145 | 1 | 1 |
| Player | BA | OBP | SLG | OPS+ | ISO | BABIP | RC/27 | Def | WAR | No. 1 Comp |
|---|---|---|---|---|---|---|---|---|---|---|
| Michael Conforto | .251 | .352 | .477 | 125 | .226 | .301 | 6.0 | 3 | 3.7 | Steve Kemp |
| Jeff McNeil | .274 | .329 | .426 | 106 | .152 | .299 | 5.3 | -4 | 2.8 | Todd Zeile |
| Robinson Cano | .272 | .329 | .434 | 107 | .162 | .290 | 5.2 | 0 | 2.5 | George Kell |
| Brandon Nimmo | .240 | .359 | .402 | 109 | .162 | .320 | 5.1 | -6 | 2.5 | Andy Van Slyke |
| Yoenis Cespedes | .258 | .314 | .486 | 115 | .228 | .299 | 5.6 | 5 | 2.3 | Cleon Jones |
| Jed Lowrie | .245 | .325 | .384 | 94 | .139 | .284 | 4.5 | 1 | 2.3 | Joe Randa |
| Amed Rosario | .266 | .303 | .401 | 91 | .136 | .316 | 4.6 | -1 | 2.3 | Garry Templeton |
| Peter Alonso | .239 | .324 | .450 | 110 | .211 | .285 | 5.1 | 3 | 2.2 | Justin Morneau |
| Todd Frazier | .224 | .310 | .409 | 95 | .185 | .258 | 4.4 | 2 | 2.1 | Ed Sprague |
| Wilson Ramos | .259 | .302 | .419 | 95 | .160 | .289 | 4.6 | -2 | 1.7 | Javy Lopez |
| J.D. Davis | .239 | .297 | .402 | 90 | .163 | .303 | 4.2 | 0 | 1.5 | Eddie Williams |
| Travis d’Arnaud | .241 | .297 | .396 | 88 | .155 | .270 | 4.2 | 0 | 1.3 | Nelson Santovenia |
| Luis Guillorme | .243 | .312 | .307 | 71 | .064 | .286 | 3.4 | 2 | 1.0 | Jeff Treadway |
| Christian Colon | .238 | .310 | .310 | 71 | .071 | .272 | 3.4 | 6 | 1.0 | Ted Sizemore |
| Juan Lagares | .248 | .286 | .348 | 73 | .100 | .301 | 3.6 | 7 | 0.9 | Rufino Linares |
| Keon Broxton | .198 | .278 | .358 | 73 | .160 | .317 | 3.7 | 1 | 0.9 | D.J. Dozier |
| Andres Gimenez | .218 | .278 | .319 | 64 | .101 | .281 | 3.0 | 7 | 0.8 | Chris Moritz |
| Dilson Herrera | .222 | .283 | .367 | 77 | .145 | .287 | 3.4 | 3 | 0.8 | Nick Green |
| Dominic Smith | .244 | .296 | .380 | 84 | .137 | .299 | 4.1 | 4 | 0.7 | Adam Lind |
| T.J. Rivera | .261 | .296 | .373 | 82 | .113 | .296 | 4.0 | -1 | 0.7 | Terry Tiffee |
| Patrick Mazeika | .228 | .309 | .329 | 76 | .102 | .258 | 3.5 | -3 | 0.5 | Paul Ellis |
| Gavin Cecchini | .244 | .297 | .341 | 75 | .097 | .282 | 3.5 | -2 | 0.3 | Chris Demetral |
| Ali Sanchez | .214 | .245 | .306 | 50 | .092 | .243 | 2.5 | 6 | 0.2 | Rogelio Arias |
| Will Toffey | .191 | .289 | .296 | 61 | .105 | .262 | 2.8 | 2 | 0.1 | Ronald Bourquin |
| Tomas Nido | .218 | .249 | .331 | 57 | .113 | .263 | 2.8 | 2 | 0.0 | Jeff Winchester |
| Devin Mesoraco | .208 | .295 | .366 | 80 | .157 | .233 | 3.7 | -6 | 0.0 | Dave Valle |
| Jose Reyes | .231 | .290 | .356 | 76 | .125 | .258 | 3.7 | -4 | 0.0 | Spike Owen |
| Rymer Liriano | .206 | .278 | .349 | 71 | .143 | .295 | 3.2 | 3 | -0.1 | Jed Hansen |
| Sam Haggerty | .193 | .286 | .293 | 60 | .099 | .278 | 3.0 | -1 | -0.3 | Joe Redfield |
| Colton Plaia | .196 | .258 | .296 | 52 | .101 | .280 | 2.6 | -1 | -0.3 | Ray Stephens |
| Rajai Davis | .213 | .265 | .285 | 51 | .072 | .274 | 2.9 | 0 | -0.3 | Lou Brock |
| Joey Terdoslavich | .225 | .293 | .354 | 77 | .129 | .266 | 3.6 | -1 | -0.3 | Chris Pritchett |
| Adrian Gonzalez | .235 | .286 | .348 | 73 | .112 | .276 | 3.5 | -1 | -0.4 | Glenn Adams |
| Austin Jackson | .237 | .293 | .336 | 72 | .099 | .333 | 3.4 | -6 | -0.4 | Gino Cimoli |
| Matt den Dekker | .199 | .256 | .338 | 61 | .139 | .270 | 2.9 | -2 | -0.5 | Nate Murphy |
| Johnny Monell | .199 | .262 | .303 | 55 | .103 | .263 | 2.6 | -3 | -0.5 | Chad Moeller |
| David Wright | .204 | .289 | .293 | 61 | .090 | .284 | 2.8 | -4 | -0.6 | Charlie Hayes |
| Braxton Lee | .224 | .289 | .281 | 58 | .057 | .287 | 2.5 | 6 | -0.7 | Mike Kingery |
| David Thompson | .214 | .261 | .337 | 63 | .122 | .273 | 3.0 | -3 | -0.7 | Ronald Garth |
| Ty Kelly | .213 | .290 | .317 | 67 | .104 | .272 | 3.1 | -8 | -0.7 | Kevin Stocker |
| Cody Asche | .211 | .282 | .353 | 73 | .142 | .272 | 3.3 | -8 | -0.7 | Dave Baker |
| Kevin Kaczmarski | .220 | .290 | .296 | 62 | .076 | .291 | 2.8 | -4 | -0.8 | Deron McCue |
| Kevin Taylor | .228 | .285 | .296 | 60 | .068 | .268 | 2.9 | 2 | -0.9 | Andre David |
| Luis Carpio | .197 | .256 | .303 | 53 | .107 | .248 | 2.4 | 2 | -0.9 | Vicente Garcia |
| Desmond Lindsay | .176 | .254 | .280 | 46 | .104 | .276 | 2.0 | 2 | -1.0 | Jason Knoedler |
| Jhoan Urena | .207 | .269 | .334 | 64 | .127 | .279 | 3.0 | -3 | -1.2 | Brian Suarez |
| Gregor Blanco | .219 | .291 | .316 | 67 | .096 | .288 | 3.2 | -13 | -1.3 | Andy Van Slyke |
| Tim Tebow | .174 | .231 | .279 | 39 | .105 | .282 | 2.1 | -12 | -3.1 | Colin Porter |
| Player | T | Age | W | L | ERA | G | GS | IP | H | ER | HR | BB | SO |
|---|---|---|---|---|---|---|---|---|---|---|---|---|---|
| Jacob deGrom | R | 31 | 13 | 7 | 2.75 | 30 | 30 | 196.3 | 164 | 60 | 18 | 45 | 223 |
| Noah Syndergaard | R | 26 | 11 | 7 | 3.06 | 26 | 26 | 159.0 | 148 | 54 | 12 | 38 | 165 |
| Zack Wheeler | R | 29 | 10 | 8 | 3.59 | 27 | 27 | 163.0 | 151 | 65 | 16 | 54 | 152 |
| Edwin Diaz | R | 25 | 4 | 2 | 2.36 | 74 | 0 | 72.3 | 48 | 19 | 8 | 22 | 115 |
| Steven Matz | L | 28 | 7 | 7 | 4.07 | 26 | 26 | 132.7 | 131 | 60 | 19 | 48 | 126 |
| Jeurys Familia | R | 29 | 7 | 4 | 2.96 | 67 | 0 | 67.0 | 55 | 22 | 3 | 27 | 72 |
| Justin Wilson | L | 31 | 5 | 3 | 3.21 | 66 | 0 | 53.3 | 41 | 19 | 4 | 29 | 71 |
| Walker Lockett | R | 25 | 7 | 9 | 4.54 | 26 | 25 | 142.7 | 151 | 72 | 21 | 39 | 109 |
| Seth Lugo | R | 29 | 5 | 5 | 4.30 | 40 | 12 | 104.7 | 105 | 50 | 17 | 29 | 95 |
| Franklyn Kilome | R | 24 | 6 | 7 | 4.54 | 26 | 26 | 127.0 | 128 | 64 | 11 | 71 | 97 |
| Corey Taylor | R | 26 | 4 | 4 | 3.80 | 49 | 2 | 68.7 | 70 | 29 | 5 | 22 | 47 |
| Luis Avilan | L | 29 | 2 | 2 | 3.47 | 67 | 0 | 49.3 | 44 | 19 | 4 | 20 | 52 |
| Drew Smith | R | 25 | 4 | 4 | 3.86 | 52 | 0 | 63.0 | 61 | 27 | 5 | 25 | 51 |
| Stephen Villines | R | 23 | 5 | 4 | 3.69 | 46 | 0 | 61.0 | 53 | 25 | 8 | 22 | 71 |
| Robert Gsellman | R | 25 | 4 | 4 | 3.95 | 71 | 0 | 79.7 | 79 | 35 | 8 | 29 | 65 |
| Ian Krol | L | 28 | 2 | 2 | 3.92 | 51 | 0 | 59.7 | 56 | 26 | 6 | 28 | 58 |
| Daniel Zamora | L | 26 | 2 | 2 | 3.79 | 51 | 0 | 54.7 | 48 | 23 | 6 | 24 | 61 |
| Chris Flexen | R | 24 | 6 | 8 | 4.61 | 21 | 17 | 93.7 | 98 | 48 | 14 | 34 | 76 |
| AJ Ramos | R | 32 | 2 | 2 | 3.92 | 49 | 0 | 43.7 | 36 | 19 | 4 | 26 | 52 |
| Drew Gagnon | R | 29 | 6 | 7 | 4.74 | 31 | 23 | 138.7 | 137 | 73 | 22 | 56 | 130 |
| Anthony Kay | L | 24 | 8 | 10 | 4.76 | 23 | 23 | 113.3 | 114 | 60 | 12 | 69 | 92 |
| Hector Santiago | L | 31 | 5 | 7 | 4.81 | 37 | 15 | 112.3 | 105 | 60 | 19 | 62 | 108 |
| Jerry Blevins | L | 35 | 2 | 2 | 3.96 | 61 | 0 | 38.7 | 35 | 17 | 4 | 19 | 42 |
| Joshua Torres | R | 25 | 4 | 4 | 4.18 | 43 | 0 | 56.0 | 52 | 26 | 6 | 27 | 55 |
| Eric Hanhold | R | 25 | 2 | 2 | 4.21 | 43 | 0 | 51.3 | 50 | 24 | 6 | 22 | 46 |
| Ryan O’Rourke | L | 31 | 1 | 1 | 4.28 | 41 | 0 | 33.7 | 30 | 16 | 5 | 14 | 39 |
| Tyler Bashlor | R | 26 | 3 | 3 | 4.25 | 46 | 0 | 53.0 | 48 | 25 | 6 | 30 | 55 |
| Arquimedes Caminero | R | 32 | 2 | 2 | 4.24 | 46 | 0 | 46.7 | 44 | 22 | 6 | 23 | 47 |
| Matt Purke | L | 28 | 2 | 3 | 4.47 | 40 | 0 | 52.3 | 48 | 26 | 4 | 38 | 48 |
| Joe Zanghi | R | 24 | 2 | 2 | 4.35 | 40 | 0 | 60.0 | 61 | 29 | 5 | 28 | 43 |
| Tim Peterson | R | 28 | 3 | 3 | 4.37 | 50 | 0 | 59.7 | 58 | 29 | 11 | 17 | 64 |
| Jason Vargas | L | 36 | 7 | 10 | 5.08 | 22 | 22 | 106.3 | 113 | 60 | 22 | 33 | 92 |
| Buddy Baumann | L | 31 | 2 | 2 | 4.65 | 35 | 1 | 40.7 | 39 | 21 | 6 | 22 | 41 |
| Jacob Rhame | R | 26 | 3 | 3 | 4.45 | 55 | 0 | 62.7 | 61 | 31 | 11 | 20 | 67 |
| Zach Lee | R | 27 | 7 | 10 | 5.00 | 24 | 23 | 126.0 | 144 | 70 | 19 | 39 | 77 |
| Joshua Torres | R | 25 | 4 | 5 | 4.70 | 39 | 2 | 59.3 | 58 | 31 | 9 | 28 | 58 |
| Paul Sewald | R | 29 | 4 | 5 | 4.57 | 55 | 0 | 65.0 | 64 | 33 | 10 | 22 | 65 |
| Logan Taylor | R | 27 | 1 | 2 | 4.91 | 33 | 4 | 47.7 | 47 | 26 | 6 | 29 | 43 |
| David Peterson | R | 29 | 2 | 2 | 4.70 | 35 | 0 | 46.0 | 51 | 24 | 5 | 17 | 27 |
| P.J. Conlon | L | 25 | 5 | 8 | 5.04 | 25 | 22 | 121.3 | 136 | 68 | 19 | 44 | 80 |
| Ryder Ryan | R | 24 | 3 | 4 | 4.70 | 44 | 0 | 51.7 | 51 | 27 | 7 | 25 | 48 |
| Cody Martin | R | 29 | 4 | 6 | 5.24 | 23 | 17 | 91.0 | 95 | 53 | 16 | 40 | 79 |
| Kyle Dowdy | R | 26 | 8 | 11 | 5.25 | 27 | 19 | 111.3 | 121 | 65 | 19 | 47 | 87 |
| Chris Mazza | R | 29 | 3 | 5 | 5.16 | 21 | 14 | 83.7 | 96 | 48 | 13 | 30 | 49 |
| Corey Oswalt | R | 25 | 6 | 8 | 5.19 | 26 | 22 | 111.0 | 121 | 64 | 21 | 41 | 88 |
| Aaron Laffey | L | 34 | 3 | 4 | 5.37 | 17 | 9 | 58.7 | 69 | 35 | 9 | 21 | 31 |
| A.J. Griffin | R | 31 | 4 | 6 | 5.56 | 19 | 18 | 87.3 | 90 | 54 | 20 | 36 | 73 |
| Vance Worley | R | 31 | 4 | 6 | 5.44 | 25 | 12 | 81.0 | 95 | 49 | 13 | 33 | 47 |
| Stephen Nogosek | R | 24 | 2 | 3 | 5.50 | 42 | 0 | 52.3 | 52 | 32 | 8 | 36 | 52 |
| David Roseboom | L | 27 | 2 | 3 | 5.51 | 43 | 0 | 50.7 | 53 | 31 | 10 | 27 | 47 |
| Harol Gonzalez | R | 24 | 6 | 11 | 5.70 | 23 | 22 | 124.7 | 147 | 79 | 23 | 51 | 71 |
| Player | TBF | K/9 | BB/9 | HR/9 | BABIP | ERA+ | ERA- | FIP | WAR | No. 1 Comp |
|---|---|---|---|---|---|---|---|---|---|---|
| Jacob deGrom | 789 | 10.22 | 2.06 | 0.83 | .292 | 140 | 71 | 2.80 | 5.0 | Kevin Brown |
| Noah Syndergaard | 656 | 9.34 | 2.15 | 0.68 | .311 | 126 | 79 | 2.85 | 3.5 | Roy Halladay |
| Zack Wheeler | 691 | 8.39 | 2.98 | 0.88 | .293 | 108 | 93 | 3.70 | 2.6 | Bob Rush |
| Edwin Diaz | 289 | 14.31 | 2.74 | 1.00 | .288 | 169 | 59 | 2.53 | 2.5 | Antonio Osuna |
| Steven Matz | 575 | 8.55 | 3.26 | 1.29 | .299 | 95 | 105 | 4.36 | 1.3 | Doug Davis |
| Jeurys Familia | 281 | 9.67 | 3.63 | 0.40 | .294 | 131 | 77 | 2.88 | 1.3 | Claude Jonnard |
| Justin Wilson | 228 | 11.98 | 4.89 | 0.68 | .301 | 124 | 80 | 3.15 | 0.9 | Marshall Bridges |
| Walker Lockett | 614 | 6.88 | 2.46 | 1.32 | .297 | 85 | 118 | 4.50 | 0.7 | Nick Blackburn |
| Seth Lugo | 445 | 8.17 | 2.49 | 1.46 | .293 | 90 | 111 | 4.39 | 0.6 | Danny Graves |
| Franklyn Kilome | 577 | 6.87 | 5.03 | 0.78 | .299 | 85 | 117 | 4.59 | 0.6 | Mike Torrez |
| Corey Taylor | 297 | 6.16 | 2.88 | 0.66 | .297 | 102 | 98 | 3.86 | 0.6 | Pedro Borbon |
| Luis Avilan | 211 | 9.49 | 3.65 | 0.73 | .301 | 111 | 90 | 3.43 | 0.6 | Tippy Martinez |
| Drew Smith | 274 | 7.29 | 3.57 | 0.71 | .296 | 103 | 97 | 3.94 | 0.5 | Ray Herbert |
| Stephen Villines | 258 | 10.48 | 3.25 | 1.18 | .294 | 105 | 95 | 3.81 | 0.5 | Jorge Julio |
| Robert Gsellman | 346 | 7.34 | 3.28 | 0.90 | .297 | 98 | 102 | 4.10 | 0.5 | Chad Kimsey |
| Ian Krol | 263 | 8.75 | 4.22 | 0.91 | .299 | 102 | 98 | 4.12 | 0.4 | Tippy Martinez |
| Daniel Zamora | 235 | 10.04 | 3.95 | 0.99 | .298 | 102 | 98 | 3.83 | 0.4 | Grant Jackson |
| Chris Flexen | 411 | 7.30 | 3.27 | 1.35 | .298 | 84 | 119 | 4.72 | 0.3 | Michael Macdonald |
| AJ Ramos | 192 | 10.72 | 5.36 | 0.82 | .296 | 99 | 101 | 3.88 | 0.3 | Heathcliff Slocumb |
| Drew Gagnon | 606 | 8.44 | 3.63 | 1.43 | .294 | 82 | 123 | 4.70 | 0.3 | Dan Petry |
| Anthony Kay | 522 | 7.31 | 5.48 | 0.95 | .298 | 81 | 123 | 4.91 | 0.2 | Greg Kubes |
| Hector Santiago | 501 | 8.65 | 4.97 | 1.52 | .280 | 83 | 121 | 5.22 | 0.2 | Ray Searage |
| Jerry Blevins | 170 | 9.78 | 4.42 | 0.93 | .304 | 98 | 102 | 4.03 | 0.2 | Marshall Bridges |
| Joshua Torres | 247 | 8.84 | 4.34 | 0.96 | .297 | 92 | 108 | 4.24 | 0.2 | Joe Hudson |
| Eric Hanhold | 225 | 8.06 | 3.86 | 1.05 | .297 | 92 | 109 | 4.34 | 0.1 | Casey Daigle |
| Ryan O’Rourke | 144 | 10.43 | 3.74 | 1.34 | .294 | 93 | 107 | 4.10 | 0.1 | Bob McClure |
| Tyler Bashlor | 237 | 9.34 | 5.09 | 1.02 | .296 | 91 | 110 | 4.47 | 0.1 | Clay Bryant |
| Arquimedes Caminero | 207 | 9.06 | 4.44 | 1.16 | .297 | 91 | 110 | 4.48 | 0.1 | Dennis Higgins |
| Matt Purke | 242 | 8.25 | 6.54 | 0.69 | .295 | 89 | 112 | 4.66 | 0.0 | Jim Roland |
| Joe Zanghi | 268 | 6.45 | 4.20 | 0.75 | .298 | 89 | 113 | 4.40 | 0.0 | Gary Ross |
| Tim Peterson | 253 | 9.65 | 2.56 | 1.66 | .297 | 88 | 113 | 4.41 | 0.0 | Jack Krawczyk |
| Jason Vargas | 461 | 7.79 | 2.79 | 1.86 | .294 | 79 | 127 | 5.15 | 0.0 | Chris Michalak |
| Buddy Baumann | 182 | 9.07 | 4.87 | 1.33 | .297 | 86 | 117 | 4.82 | 0.0 | Tim Adkins |
| Jacob Rhame | 267 | 9.62 | 2.87 | 1.58 | .299 | 87 | 115 | 4.35 | 0.0 | Rick Anderson |
| Zach Lee | 558 | 5.50 | 2.79 | 1.36 | .300 | 77 | 129 | 4.98 | -0.1 | A.J. Sager |
| Joshua Torres | 264 | 8.80 | 4.25 | 1.37 | .297 | 82 | 122 | 4.78 | -0.1 | Joe Davenport |
| Paul Sewald | 279 | 9.00 | 3.05 | 1.38 | .300 | 85 | 118 | 4.26 | -0.1 | Brian Edmondson |
| Logan Taylor | 219 | 8.12 | 5.48 | 1.13 | .297 | 79 | 127 | 5.00 | -0.2 | Ken Wright |
| David Peterson | 204 | 5.28 | 3.33 | 0.98 | .301 | 82 | 122 | 4.63 | -0.2 | Jim Todd |
| P.J. Conlon | 540 | 5.93 | 3.26 | 1.41 | .299 | 77 | 131 | 5.10 | -0.2 | Jason Dickson |
| Ryder Ryan | 231 | 8.36 | 4.35 | 1.22 | .299 | 82 | 122 | 4.74 | -0.2 | Joe Davenport |
| Cody Martin | 406 | 7.81 | 3.96 | 1.58 | .297 | 76 | 131 | 5.18 | -0.2 | Robert Ellis |
| Kyle Dowdy | 501 | 7.03 | 3.80 | 1.54 | .299 | 76 | 132 | 5.26 | -0.3 | Peter Bauer |
| Chris Mazza | 375 | 5.27 | 3.23 | 1.40 | .299 | 75 | 134 | 5.25 | -0.3 | Jim Owens |
| Corey Oswalt | 494 | 7.14 | 3.32 | 1.70 | .297 | 74 | 134 | 5.32 | -0.4 | Sean Lawrence |
| Aaron Laffey | 264 | 4.76 | 3.22 | 1.38 | .300 | 72 | 139 | 5.31 | -0.4 | Jose Santiago |
| A.J. Griffin | 387 | 7.52 | 3.71 | 2.06 | .277 | 72 | 140 | 5.86 | -0.5 | Jackson Todd |
| Vance Worley | 368 | 5.22 | 3.67 | 1.44 | .303 | 71 | 141 | 5.45 | -0.6 | Karl Drews |
| Stephen Nogosek | 244 | 8.94 | 6.19 | 1.38 | .303 | 72 | 138 | 5.39 | -0.6 | Jeff Kennard |
| David Roseboom | 231 | 8.35 | 4.80 | 1.78 | .299 | 70 | 143 | 5.64 | -0.7 | Wes Pierorazio |
| Harol Gonzalez | 569 | 5.13 | 3.68 | 1.66 | .297 | 68 | 148 | 5.81 | -1.2 | Mark Mangum |
Disclaimer: ZiPS projections are computer-based projections of performance. Performances have not been allocated to predicted playing time in the majors — many of the players listed above are unlikely to play in the majors at all in 2019. ZiPS is projecting equivalent production — a .240 ZiPS projection may end up being .280 in AAA or .300 in AA, for example. Whether or not a player will play is one of many non-statistical factors one has to take into account when predicting the future.
Players are listed with their most recent teams, unless I have made a mistake. This is very possible, as a lot of minor-league signings go generally unreported in the offseason.
ZiPS’ projections are based on the American League having a 4.29 ERA and the National League having a 4.15 ERA.
Players who are expected to be out due to injury are still projected. More information is always better than less information, and a computer isn’t the tool that should project the injury status of, for example, a pitcher who has had Tommy John surgery.
Both hitters and pitchers are ranked by projected zWAR — which is to say, WAR values as calculated by me, Dan Szymborski, whose surname is spelled with a z. WAR values might differ slightly from those which appear in full release of ZiPS. Finally, I will advise anyone against — and might karate chop anyone guilty of — merely adding up WAR totals on a depth chart to produce projected team WAR.
Dan Szymborski is a senior writer for FanGraphs and the developer of the ZiPS projection system. He was a writer for ESPN.com from 2010-2018, a regular guest on a number of radio shows and podcasts, and a voting BBWAA member. He also maintains a terrible Twitter account at @DSzymborski.
You say Peter Alsonso will be called up as soon as his clock rolls over another year, but given the Mets history with Conforto, Nimmo, and McNeil are we sure they’re not going to ride Todd Frazier as long as possible? Maybe they try to contend this year and think they need “veteran leadership.”
Well they do have this new GM that isn’t beholden to the team’s transaction history.
I think Frazier gets sold short. Even including his down 2018 (1.5 fWAR), he’s averaged 3+ fWAR since becoming a regular in 2012. His offense has been trending down, for sure, but he’s not exactly a stiff out there. His BB% has improved since leaving Cincinnati, and he still has pop. Some positive regression to his BABIP could make him an above average regular again, although I admit his profile does skew toward that figure being below league average.
It also may take more than a Frazier benching to get Alonso a path to regular playing time, what with McNeil, Lowrie and Cano all seeming to be ahead of him.
While this is true, Frazier’s value as a 1B is considerably less.
Yes, great point.
Someone else also noted below that, given McNeil’s “versatility” he may actually be leapfrogged by Alonso when he is called up, with Alonso becoming the every day first basemen and McNeil remaining a utility player (also a great point).
Very interested to see how the playing time (and performance) shakes out, but I really like the options they’ve given themselves.
All those guys you mention that might be in front of Alonso will step aside quickly if he hits, after all his comp is Justin Morneau. All the Mets can do is dream that this is a brilliant comparison and see how it plays out.
are we really sure Alonso is ready for the bigs? He did not exactly light up Vegas last year, and a lot of bad hitters light up Vegas. As a Mets’ fan, I am glad they are not relying on Alonso to be their starting 1B, adding Cano and Lowrie to Frazier and McNeil in a group of infielders who can play multiple positions. That gives Alonso an avenue to the majors but allows the Mets to make sure he’s ready.
He struck out more than he has at other levels but other than that he was pretty good in Vegas
21 home runs in 300 PAs and a .355 OBP is an excellent batting line. He still might not be ready for the bigs (maybe there’s a certain pitch that AAA pitchers struggle with, but will mess with him in the bigs). But if so, evidence for that will have to come from some place other than the stat line.
That is a 139 wRC+ in the PCL. For a bat first/bat-only prospect like Alonso, that’s not great. Jabari Blash offers the same profile and had 346 PA’s in the PCL of 188 wRC+ last year. He got cut from the Angels for that performance.
Out of players with 150+ PA, Alonso ranks 20th behind feared sluggers such as Jose Labaton (168 wRC+), David Freitas (158), Patrick Kivlehan (not even sure who he is but he’s in the Mets system and rocked a 147 in 390 PA’s) and Socrates Brito.
It’s the PCL. Alonso could have Dan Vogelbach disease. In fact, that might be an even better comparison if we’re looking for an excellent batting line Dan Vogelbach walked twice as much as Alonso, struck out about 75% less often and posted a 157 wRC+ in 378 PA’s.
I like Alonso well enough. But he’s not proven himself in AAA – not NEARLY proven himself.
What you’re referring to is more of a “Quad-A” disease, rather than a “PCL disease.” Guys like Blash have problems that AAA doesn’t expose, but major league pitchers do.
You can play this game with the International League too, especially if you drop the PAs all the way down to 150s (where you get way more fluky performances). In 2016, Gary Sanchez was 27th in the International League with a wRC+ of 132, where the best guys were Scott Schebler, Tyler Austin, and Jason Coats (Byron Buxton was #4; I can imagine that everyone will claim that piece of evidence supports their points). Jesus Aguilar was somewhere around #40.
The problem is that there’s a survivor’s bias for guys who aren’t quite good enough to make in the major leagues, and it’s pretty clear that there are a lot more of them than legitimate prospects.
Keep in mind, there are certain things that are more translatable to the majors from AAA than others. Walks don’t translate that well, but lower strikeouts do; homers definitely translate. If Alonso is going to succeed, it’s going to be with a very different profile than Vogelbach; he’s going to have to pound the ball and make guys pitch around him.
Why did you pick 150 PAs as your floor? Alfonso had 300 in Vegas.
Jabari Blash was 29 last year, and has over 1200 PAs at AAA. His K rate averaged in the mid to high 20%’s throughout his minor league career.
Jose Lobatan is a 33 year old career back up catcher. Hitting well for a 5-6 weeks at AAA doesn’t change anything.
David Freitas is a 29 year old backup catcher. Hitting well for a 5-6 weeks at AAA doesn’t change anything.
Patrick Kivlehan was 28 last year, and has over 1300 PAs at AAA, as well as 242 ML PAs. His minor league career high for HRs is 22.
Socrates Brito was 25 last year, and has over 1100 PAs at AAA, as well as 175 ML PAs. His 18 HR (17 AAA, 1 ML) in 2018 was a career best.
Dan Vogelbach was 25 last year, and has over 1400 PAs at AAA, as well as 146 ML PAs. 2018 was his third year with significant AAA time.
Alonso was 23 last year, and got his first taste of AAA. He may not be ready for the bigs, and he may not succeed when he gets there, but I think you should find some better comps.
I picked it because that was literally what dodgerbleu used as his criteria.
Sorry, it isn’t evident in this layout, but my reply was to dodgerbleu.
FWIW, Alonso started slow in AAA, then put up .308/.392/.731 in August. I know it’s a bit of cherry picking, but I’d much rather see someone start slow then adjust, vs. the opposite.