
2020 ZiPS Projections: Chicago Cubs
After having typically appeared in the hallowed pages of Baseball Think Factory, Dan Szymborski’s ZiPS projections have now been released at FanGraphs for eight years. The exercise continues this offseason. Below are the projections for the Chicago Cubs.
Batters
It’s hard to feel much excitement about the Cubs. They won the World Series when they were one of the best teams in baseball, so to see them in stasis as they pass through the core’s long twilight just doesn’t feel quite right.
I think of the Cubs like one of those expensive, powerful German luxury cars. It was dominating, with an engine that snarled, and looked like it would roll over the mid-size crossovers that were the rest of the NL Central. But it turned out the insurance for the car was expensive, the upkeep and maintenance fell behind, and now it isn’t any more desirable than a late-model, non-luxury brand.
It would not be a shock if this offense, led by stars like Kris Bryant, Anthony Rizzo, and Javier Báez, was enough to get the Cubs to the top of the division in 2020. But it would no longer be a shock if it doesn’t. Chicago’s outfield is in better shape than that of their World Series rivals, the Cleveland Indians, but it’s not a plus and it’s hard to see many pathways to it becoming so this season. There was a brief moment in 2019 when Jason Heyward’s bat seemed to be coming back to life after a long hibernation, but in the end, he had another Jason Heyward Season. He’s a league-average player, sure, but not only is he not the next Willie Mays, he’s not the next Willie McCovey or Willie Davis, though there are worse things than being Willie Kirkland.
The lineup won’t be horrific anywhere and ought to be able to coast by until the team starts losing some combination of Bryant, Báez, or Rizzo. And that day is approaching; Bryant’s feelings about the organization have to be at near all-time lows, and like Báez, Rizzo, and Kyle Schwarber, he’s a free agent after the 2021 season.
The team’s depth has suffered as it has hunkered down financially, and the organization’s ability to lose one of their big three hitters (or practically anyone from the rotation) and survive the division is limited.
Pitchers
As long as everything goes well, the rotation is a decent one, even with Jon Lester on the downswing and Jose Quintana not having gotten near the ceiling that justified the Cubs swapping Eloy Jiménez for him. Lester’s fully into the crafty lefty stage of his career, but as a team’s fourth-best starting pitcher goes, he’s not likely to keep the Cubs from making the playoffs.
ZiPS is all-in on the idea that Yu Darvish is finally back, and after watching the run he had late last summer when he went a month without allowing a walk, I’m also convinced. Unlike a lot of the Cubs, Darvish kept playing well in September, finishing up his season by striking out 14, 13, and 12 batters. In Darvish’s final start, against the playoff-bound Cards, 82 of his 110 pitches were thrown for strikes.
The computer’s always been a fan of Kyle Hendricks, who has never had trouble fooling hitters with a fastball slower than Nolan Ryan’s. (I mean Nolan Ryan’s 2020 fastball.) As long as Hendricks can change speeds effectively, he’ll continue to be a productive borderline All-Star. Signed through 2023 with a mutual option for 2024, he may eventually be the team’s last key contributor from the 2016 championship squad.
The fifth starter position is a concern, one the Cubs have done little to address. Tyler Chatwood is a walking heartburn machine and Alec Mills isn’t likely to be any better. It would have been nice to keep Cole Hamels around for one last year; he played a big part in holding the rotation together early on in 2019.
ZiPS is rather optimistic about Craig Kimbrel; hopefully a healthier season without an odd stint of unemployment, will at least get him back to his Boston form. The bullpen overall projects as a bit above average, with the system liking most of the pitchers likely to get significant time. The projections are quite bullish on Big Trevor Megill, a pitcher taken in the Rule 5 Draft who the team had previously tried to acquire. It’s not the most electric bunch, the bullpen would have to try pretty hard to be less effective than most of last year’s crew.
Prospects
ZiPS has soured on Aramis Ademan thanks to his offensive struggles, but he’s still very young and playing in the low minors, so I wouldn’t be too worried about the weak projection just yet. The computer’s never been a fan of Adbert Alzolay, though his projections improve more than with the typical pitcher if he’s moved to the bullpen. I’m not sure we can really still count him as a prospect at this point, but ZiPS thinks that if Chatwood stumbles, the low-ceiling Jharel Cotton may be the team’s next-best option, preferable to Mills or Alzolay. Cory Abbott’s projection is similar to Cotton’s, though I think it is unlikely that the Cubs turn to him in an emergency without him pitching at Triple-A.
ZiPS is bullish on Miguel Amaya, though the Cubs also have Willson Contreras and Victor Caratini, a more-than-adequate combination. The projections for Nico Hoerner’s upside are rather lackluster, but of the team’s offensive talent, he has the second-best WAR projection for the 2030 season, behind only Amaya! I’m very, very sorry about Hoerner’s top comp; I swear I didn’t just choose that one to be mean.
One pedantic note for 2020: for the WAR graphic, I’m using FanGraphs’ depth charts playing time, not the playing time ZiPS spits out, so there will be occasional differences in WAR totals.
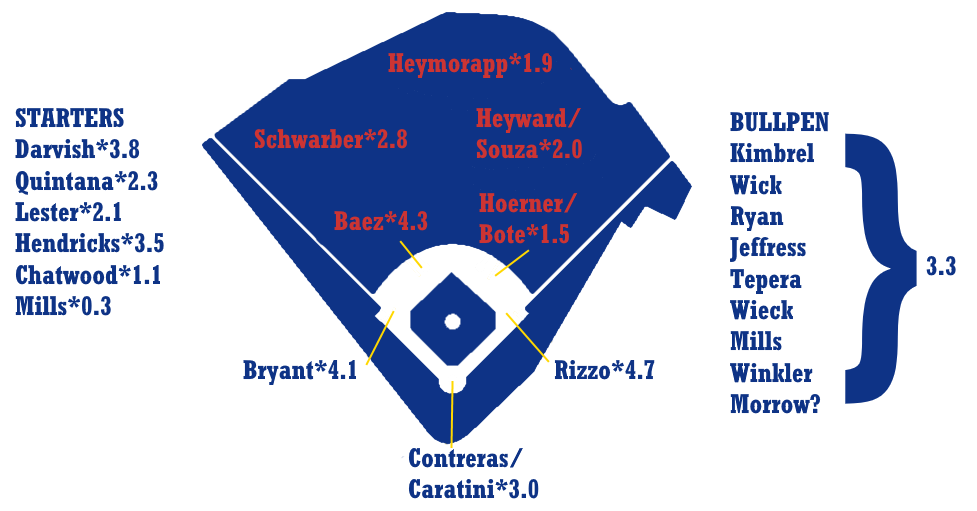
Ballpark graphic courtesy Eephus League. Depth charts constructed by way of those listed here.
| Player | B | Age | PO | PA | AB | R | H | 2B | 3B | HR | RBI | BB | SO | SB | CS |
|---|---|---|---|---|---|---|---|---|---|---|---|---|---|---|---|
| Kris Bryant | R | 28 | 3B | 634 | 543 | 98 | 147 | 32 | 3 | 30 | 79 | 71 | 140 | 5 | 3 |
| Anthony Rizzo | L | 30 | 1B | 613 | 518 | 82 | 147 | 30 | 3 | 27 | 101 | 70 | 86 | 6 | 4 |
| Javier Báez | R | 27 | SS | 590 | 553 | 87 | 151 | 32 | 5 | 31 | 97 | 29 | 158 | 14 | 7 |
| Kyle Schwarber | L | 27 | LF | 547 | 470 | 76 | 115 | 22 | 3 | 32 | 84 | 70 | 153 | 2 | 2 |
| Willson Contreras | R | 28 | C | 460 | 402 | 54 | 102 | 21 | 2 | 19 | 65 | 46 | 111 | 3 | 3 |
| Addison Russell | R | 26 | 2B | 426 | 378 | 50 | 92 | 18 | 2 | 12 | 49 | 38 | 98 | 4 | 1 |
| Jason Heyward | L | 30 | RF | 534 | 474 | 67 | 120 | 21 | 4 | 14 | 61 | 53 | 88 | 7 | 3 |
| Ian Happ | B | 25 | CF | 552 | 478 | 74 | 117 | 23 | 2 | 23 | 72 | 67 | 168 | 11 | 3 |
| Victor Caratini | B | 26 | C | 361 | 319 | 42 | 85 | 17 | 1 | 10 | 42 | 33 | 73 | 1 | 0 |
| David Bote | R | 27 | 2B | 439 | 387 | 53 | 94 | 20 | 2 | 14 | 53 | 43 | 115 | 5 | 2 |
| Nico Hoerner | R | 23 | SS | 508 | 471 | 60 | 127 | 21 | 7 | 8 | 55 | 30 | 59 | 9 | 5 |
| Steven Souza Jr. | R | 31 | RF | 384 | 338 | 44 | 79 | 16 | 2 | 15 | 51 | 40 | 117 | 8 | 3 |
| Miguel Amaya | R | 21 | C | 440 | 386 | 49 | 83 | 20 | 1 | 14 | 49 | 43 | 104 | 1 | 0 |
| Zack Short | R | 25 | SS | 436 | 372 | 48 | 79 | 18 | 3 | 10 | 37 | 56 | 123 | 7 | 5 |
| Ian Miller | L | 28 | CF | 527 | 482 | 56 | 121 | 22 | 4 | 5 | 43 | 34 | 97 | 29 | 6 |
| Dixon Machado | R | 28 | SS | 387 | 341 | 41 | 80 | 16 | 1 | 7 | 38 | 37 | 77 | 3 | 3 |
| Robel Garcia | B | 27 | 2B | 473 | 422 | 59 | 92 | 15 | 4 | 19 | 70 | 43 | 167 | 3 | 5 |
| Hernán Pérez | R | 29 | 2B | 402 | 377 | 45 | 97 | 18 | 2 | 12 | 44 | 21 | 83 | 14 | 3 |
| Corban Joseph | L | 31 | 2B | 469 | 435 | 48 | 114 | 23 | 1 | 9 | 49 | 27 | 57 | 2 | 1 |
| Albert Almora Jr. | R | 26 | CF | 444 | 414 | 52 | 110 | 21 | 2 | 10 | 44 | 21 | 74 | 4 | 2 |
| Jonathan Lucroy | R | 34 | C | 386 | 349 | 37 | 89 | 16 | 2 | 8 | 46 | 29 | 57 | 1 | 0 |
| Trent Giambrone | R | 26 | 2B | 480 | 437 | 54 | 97 | 19 | 1 | 17 | 51 | 36 | 133 | 14 | 6 |
| P.J. Higgins | R | 27 | C | 434 | 385 | 42 | 89 | 16 | 1 | 6 | 34 | 38 | 88 | 3 | 2 |
| Carlos Asuaje | L | 28 | 2B | 434 | 385 | 45 | 92 | 17 | 4 | 6 | 42 | 39 | 82 | 2 | 2 |
| Ben Zobrist | B | 39 | 2B | 324 | 283 | 40 | 73 | 13 | 1 | 5 | 32 | 36 | 45 | 1 | 1 |
| Donnie Dewees | L | 26 | LF | 493 | 450 | 53 | 108 | 19 | 6 | 9 | 49 | 33 | 88 | 10 | 5 |
| Daniel Descalso | L | 33 | 2B | 320 | 273 | 37 | 59 | 12 | 2 | 8 | 38 | 41 | 85 | 2 | 1 |
| Mark Zagunis | R | 27 | RF | 390 | 339 | 43 | 78 | 18 | 1 | 9 | 38 | 43 | 117 | 6 | 3 |
| Jhonny Pereda | R | 24 | C | 428 | 383 | 39 | 86 | 13 | 1 | 4 | 30 | 41 | 78 | 2 | 2 |
| Tyler Payne | R | 27 | C | 317 | 296 | 29 | 63 | 13 | 1 | 8 | 30 | 16 | 73 | 0 | 0 |
| Ian Rice | R | 26 | C | 318 | 274 | 35 | 54 | 11 | 0 | 9 | 28 | 38 | 98 | 0 | 1 |
| Jacob Hannemann | L | 29 | RF | 346 | 314 | 36 | 72 | 15 | 2 | 7 | 31 | 23 | 76 | 16 | 6 |
| David Masters | R | 27 | SS | 322 | 289 | 33 | 57 | 11 | 0 | 8 | 30 | 28 | 92 | 0 | 1 |
| Carlos Gonzalez | L | 34 | RF | 400 | 361 | 49 | 85 | 19 | 1 | 12 | 41 | 34 | 99 | 2 | 2 |
| Josh Phegley | R | 32 | C | 299 | 273 | 35 | 65 | 16 | 1 | 8 | 45 | 16 | 57 | 0 | 1 |
| Noel Cuevas | R | 28 | CF | 362 | 335 | 38 | 82 | 13 | 4 | 7 | 32 | 21 | 76 | 5 | 4 |
| Johnny Field | R | 28 | RF | 373 | 347 | 39 | 79 | 22 | 2 | 10 | 40 | 19 | 100 | 8 | 4 |
| Alfonso Rivas | L | 23 | 1B | 509 | 458 | 51 | 110 | 21 | 3 | 6 | 40 | 43 | 119 | 2 | 3 |
| Cam Balego | R | 25 | 3B | 421 | 370 | 41 | 74 | 17 | 0 | 7 | 33 | 37 | 99 | 2 | 5 |
| Vance Vizcaino | L | 25 | LF | 339 | 310 | 32 | 66 | 10 | 2 | 4 | 24 | 23 | 102 | 18 | 9 |
| Charcer Burks | R | 25 | LF | 484 | 424 | 49 | 87 | 17 | 3 | 6 | 33 | 49 | 145 | 11 | 6 |
| Jim Adduci | L | 35 | 1B | 370 | 347 | 38 | 84 | 17 | 2 | 7 | 39 | 18 | 95 | 7 | 3 |
| Aramis Ademan | L | 21 | SS | 466 | 416 | 43 | 80 | 11 | 7 | 7 | 37 | 38 | 123 | 11 | 9 |
| Jerrick Suiter | R | 27 | 1B | 420 | 387 | 37 | 82 | 15 | 1 | 5 | 34 | 26 | 108 | 3 | 2 |
| Connor Myers | R | 26 | CF | 373 | 345 | 29 | 64 | 13 | 4 | 3 | 23 | 18 | 140 | 10 | 6 |
| Player | BA | OBP | SLG | OPS+ | ISO | BABIP | RC/27 | Def | WAR | No. 1 Comp |
|---|---|---|---|---|---|---|---|---|---|---|
| Kris Bryant | .271 | .369 | .506 | 125 | .236 | .314 | 6.9 | -1 | 4.5 | Tony Perez |
| Anthony Rizzo | .284 | .388 | .510 | 131 | .226 | .296 | 7.4 | 4 | 4.3 | Norm Cash |
| Javier Báez | .273 | .312 | .517 | 110 | .244 | .330 | 6.0 | 4 | 3.8 | Robin Yount |
| Kyle Schwarber | .245 | .346 | .509 | 118 | .264 | .291 | 6.2 | -1 | 2.5 | Dan Pasqua |
| Willson Contreras | .254 | .342 | .458 | 106 | .204 | .305 | 5.6 | -3 | 2.4 | Bruce Edwards |
| Addison Russell | .243 | .320 | .397 | 85 | .153 | .299 | 4.6 | 10 | 2.0 | Nick Green |
| Jason Heyward | .253 | .332 | .403 | 90 | .150 | .285 | 4.9 | 9 | 1.8 | Terrence Long |
| Ian Happ | .245 | .339 | .446 | 102 | .201 | .328 | 5.5 | -8 | 1.8 | Warren Newson |
| Victor Caratini | .266 | .339 | .420 | 96 | .154 | .318 | 5.3 | -3 | 1.4 | Jerry Grote |
| David Bote | .243 | .326 | .413 | 91 | .171 | .310 | 4.8 | 0 | 1.4 | Dale Berra |
| Nico Hoerner | .270 | .319 | .395 | 85 | .125 | .295 | 4.6 | 0 | 1.4 | Ronny Cedeno |
| Steven Souza Jr. | .234 | .321 | .426 | 92 | .192 | .311 | 4.9 | 2 | 1.0 | Terrell Lowery |
| Miguel Amaya | .215 | .302 | .381 | 76 | .166 | .257 | 4.0 | 1 | 1.0 | Henry Blanco |
| Zack Short | .212 | .322 | .358 | 77 | .145 | .289 | 3.9 | 0 | 0.9 | Rolando Pino |
| Ian Miller | .251 | .307 | .344 | 70 | .093 | .305 | 4.2 | 4 | 0.9 | Chris Roberson |
| Dixon Machado | .235 | .313 | .349 | 73 | .114 | .284 | 3.8 | 3 | 0.8 | Brian Grebeck |
| Robel Garcia | .218 | .294 | .408 | 80 | .190 | .309 | 4.0 | 2 | 0.8 | Bobby Smith |
| Hernán Pérez | .257 | .295 | .411 | 81 | .154 | .301 | 4.6 | 0 | 0.8 | Tommy Shields |
| Corban Joseph | .262 | .306 | .382 | 78 | .120 | .285 | 4.3 | 0 | 0.6 | Jack Wilson |
| Albert Almora Jr. | .266 | .300 | .399 | 80 | .133 | .303 | 4.4 | 0 | 0.6 | Quinn Mack |
| Jonathan Lucroy | .255 | .316 | .381 | 81 | .126 | .285 | 4.4 | -5 | 0.5 | Jerry Grote |
| Trent Giambrone | .222 | .285 | .387 | 73 | .165 | .279 | 3.9 | 0 | 0.3 | Jason Moore |
| P.J. Higgins | .231 | .304 | .325 | 64 | .094 | .285 | 3.4 | 0 | 0.3 | Doug Newstrom |
| Carlos Asuaje | .239 | .313 | .351 | 73 | .112 | .290 | 3.8 | -1 | 0.3 | Joe Inglett |
| Ben Zobrist | .258 | .340 | .364 | 84 | .106 | .292 | 4.5 | -5 | 0.2 | Wade Boggs |
| Donnie Dewees | .240 | .296 | .369 | 72 | .129 | .280 | 3.9 | 6 | 0.2 | Phil Dauphin |
| Daniel Descalso | .216 | .320 | .363 | 78 | .147 | .283 | 4.0 | -5 | 0.0 | Dave Matranga |
| Mark Zagunis | .230 | .324 | .369 | 80 | .139 | .324 | 4.2 | -2 | 0.0 | Mike Colangelo |
| Jhonny Pereda | .225 | .300 | .295 | 56 | .070 | .272 | 3.0 | 2 | 0.0 | Brian Moon |
| Tyler Payne | .213 | .259 | .345 | 55 | .132 | .256 | 3.1 | 1 | -0.1 | Mike Ryan |
| Ian Rice | .197 | .302 | .336 | 66 | .139 | .269 | 3.3 | -4 | -0.1 | Matt Garrick |
| Jacob Hannemann | .229 | .289 | .357 | 67 | .127 | .281 | 3.7 | 2 | -0.2 | Phil Dauphin |
| David Masters | .197 | .274 | .318 | 54 | .121 | .259 | 2.9 | 1 | -0.2 | Lou Benbow |
| Carlos Gonzalez | .235 | .301 | .393 | 79 | .158 | .292 | 4.1 | -2 | -0.2 | Shane Spencer |
| Josh Phegley | .238 | .289 | .392 | 75 | .154 | .274 | 3.9 | -7 | -0.3 | Chad Moeller |
| Noel Cuevas | .245 | .294 | .370 | 71 | .125 | .298 | 3.8 | -3 | -0.3 | Bubba Crosby |
| Johnny Field | .228 | .272 | .389 | 69 | .161 | .291 | 3.7 | 1 | -0.4 | Todd Dunwoody |
| Alfonso Rivas | .240 | .310 | .338 | 69 | .098 | .312 | 3.6 | 3 | -0.5 | Michael Paulk |
| Cam Balego | .200 | .290 | .303 | 55 | .103 | .254 | 2.7 | 2 | -0.6 | Ryan Stegall |
| Vance Vizcaino | .213 | .270 | .297 | 48 | .084 | .304 | 2.7 | 5 | -0.8 | Tony Triplett |
| Charcer Burks | .205 | .295 | .302 | 56 | .097 | .297 | 3.0 | 3 | -1.0 | Jason Jackson |
| Jim Adduci | .242 | .279 | .363 | 66 | .121 | .314 | 3.6 | -3 | -1.1 | Jalal Leach |
| Aramis Ademan | .192 | .267 | .303 | 48 | .111 | .255 | 2.5 | -2 | -1.2 | Cleatus Davidson |
| Jerrick Suiter | .212 | .264 | .295 | 46 | .083 | .281 | 2.6 | 3 | -1.8 | Russ Quetti |
| Connor Myers | .186 | .233 | .272 | 31 | .087 | .302 | 2.0 | -1 | -2.0 | Rick Christian |
| Player | T | Age | W | L | ERA | G | GS | IP | H | ER | HR | BB | SO | FIP |
|---|---|---|---|---|---|---|---|---|---|---|---|---|---|---|
| Kyle Hendricks | R | 30 | 12 | 8 | 3.67 | 29 | 29 | 169.3 | 162 | 69 | 22 | 37 | 143 | 3.96 |
| Yu Darvish | R | 33 | 8 | 5 | 3.56 | 27 | 27 | 154.3 | 126 | 61 | 19 | 49 | 190 | 3.43 |
| Jose Quintana | L | 31 | 12 | 10 | 4.27 | 30 | 29 | 164.3 | 164 | 78 | 22 | 52 | 149 | 4.13 |
| Jon Lester | L | 36 | 11 | 9 | 4.38 | 27 | 27 | 152.0 | 157 | 74 | 24 | 51 | 135 | 4.54 |
| Cory Abbott | R | 24 | 8 | 8 | 4.64 | 26 | 26 | 132.0 | 127 | 68 | 20 | 64 | 136 | 4.73 |
| Tyler Chatwood | R | 30 | 6 | 6 | 4.50 | 30 | 14 | 96.0 | 85 | 48 | 9 | 60 | 89 | 4.54 |
| Alec Mills | R | 28 | 6 | 6 | 4.88 | 26 | 21 | 125.3 | 130 | 68 | 21 | 43 | 112 | 4.79 |
| Jharel Cotton | R | 28 | 6 | 6 | 4.77 | 21 | 17 | 100.0 | 98 | 53 | 17 | 40 | 95 | 4.81 |
| Jeffrey Passantino | R | 24 | 5 | 4 | 4.59 | 25 | 10 | 86.3 | 91 | 44 | 15 | 21 | 79 | 4.51 |
| Craig Kimbrel | R | 32 | 3 | 2 | 3.40 | 45 | 0 | 42.3 | 28 | 16 | 5 | 23 | 66 | 3.44 |
| Casey Sadler | R | 29 | 3 | 2 | 4.04 | 44 | 3 | 69.0 | 68 | 31 | 10 | 19 | 58 | 4.47 |
| Jeremy Jeffress | R | 32 | 4 | 3 | 3.70 | 55 | 0 | 58.3 | 55 | 24 | 5 | 20 | 51 | 3.73 |
| Brad Wieck | L | 28 | 4 | 2 | 3.64 | 57 | 0 | 54.3 | 40 | 22 | 8 | 26 | 81 | 3.71 |
| Duncan Robinson | R | 26 | 5 | 6 | 5.02 | 20 | 19 | 98.7 | 112 | 55 | 16 | 28 | 66 | 4.95 |
| Jack Patterson | L | 24 | 5 | 5 | 4.73 | 25 | 10 | 70.3 | 70 | 37 | 8 | 41 | 61 | 4.84 |
| Duane Underwood Jr. | R | 25 | 6 | 6 | 4.93 | 38 | 15 | 104.0 | 106 | 57 | 16 | 46 | 96 | 4.81 |
| Erich Uelmen | R | 24 | 6 | 6 | 5.02 | 18 | 18 | 86.0 | 92 | 48 | 10 | 47 | 61 | 5.09 |
| Brock Stewart | R | 28 | 5 | 6 | 5.08 | 21 | 17 | 90.3 | 95 | 51 | 15 | 39 | 75 | 5.11 |
| Rowan Wick | R | 27 | 2 | 2 | 4.03 | 57 | 0 | 60.3 | 53 | 27 | 6 | 32 | 66 | 4.03 |
| Brandon Morrow | R | 35 | 2 | 1 | 3.56 | 31 | 0 | 30.3 | 28 | 12 | 3 | 10 | 30 | 3.58 |
| Adbert Alzolay | R | 25 | 4 | 5 | 5.10 | 20 | 18 | 83.0 | 82 | 47 | 15 | 42 | 86 | 5.12 |
| Dillon Maples | R | 28 | 5 | 4 | 4.02 | 54 | 0 | 53.7 | 35 | 24 | 4 | 53 | 89 | 4.02 |
| Trevor Megill | R | 26 | 2 | 2 | 4.09 | 36 | 0 | 55.0 | 50 | 25 | 9 | 21 | 67 | 4.13 |
| Keegan Thompson | R | 25 | 6 | 7 | 5.28 | 20 | 20 | 93.7 | 103 | 55 | 18 | 31 | 77 | 5.19 |
| Tony Barnette | R | 36 | 1 | 1 | 4.00 | 32 | 0 | 36.0 | 34 | 16 | 4 | 13 | 34 | 3.90 |
| Wyatt Short | L | 25 | 5 | 4 | 4.27 | 45 | 0 | 59.0 | 56 | 28 | 6 | 32 | 56 | 4.38 |
| Tyler Olson | L | 30 | 2 | 1 | 4.10 | 46 | 0 | 37.3 | 35 | 17 | 5 | 17 | 38 | 4.41 |
| Kyle Ryan | L | 28 | 3 | 3 | 4.34 | 68 | 0 | 58.0 | 55 | 28 | 6 | 29 | 53 | 4.30 |
| Justin Steele | L | 24 | 3 | 3 | 5.12 | 11 | 11 | 38.7 | 38 | 22 | 6 | 23 | 37 | 5.22 |
| Ryan Tepera | R | 32 | 3 | 2 | 4.30 | 48 | 0 | 46.0 | 43 | 22 | 6 | 19 | 41 | 4.53 |
| Oscar De La Cruz | R | 25 | 5 | 6 | 5.19 | 29 | 12 | 85.0 | 88 | 49 | 14 | 39 | 76 | 5.09 |
| Tyson Miller | R | 24 | 7 | 9 | 5.43 | 25 | 25 | 122.7 | 134 | 74 | 24 | 49 | 101 | 5.45 |
| Scott Effross | R | 26 | 3 | 3 | 4.57 | 37 | 1 | 61.0 | 67 | 31 | 7 | 22 | 39 | 4.67 |
| Allen Webster | R | 30 | 2 | 2 | 5.08 | 17 | 6 | 39.0 | 42 | 22 | 6 | 19 | 31 | 5.28 |
| Matt Swarmer | R | 26 | 8 | 10 | 5.44 | 25 | 23 | 132.3 | 149 | 80 | 28 | 40 | 109 | 5.35 |
| Danny Hultzen | L | 30 | 0 | 0 | 4.40 | 17 | 1 | 14.3 | 11 | 7 | 2 | 10 | 20 | 4.51 |
| James Norwood | R | 26 | 3 | 3 | 4.50 | 53 | 0 | 62.0 | 55 | 31 | 8 | 39 | 72 | 4.57 |
| Rex Brothers | L | 32 | 2 | 2 | 4.68 | 38 | 1 | 42.3 | 32 | 22 | 3 | 43 | 59 | 4.50 |
| Jason Adam | R | 28 | 3 | 3 | 4.72 | 40 | 1 | 40.0 | 36 | 21 | 6 | 23 | 43 | 5.01 |
| Xavier Cedeño | L | 33 | 1 | 1 | 4.66 | 40 | 0 | 29.0 | 28 | 15 | 3 | 18 | 26 | 4.59 |
| Dan Winkler | R | 30 | 3 | 3 | 4.65 | 58 | 0 | 50.3 | 46 | 26 | 6 | 29 | 52 | 4.57 |
| Craig Brooks | R | 27 | 2 | 2 | 4.67 | 42 | 0 | 54.0 | 44 | 28 | 6 | 46 | 70 | 4.75 |
| Manuel Rodriguez | R | 23 | 3 | 3 | 4.76 | 37 | 0 | 45.3 | 40 | 24 | 5 | 36 | 52 | 4.90 |
| Brian Duensing | L | 37 | 1 | 1 | 4.98 | 37 | 0 | 34.3 | 37 | 19 | 4 | 15 | 23 | 4.75 |
| Bailey Clark | R | 25 | 2 | 2 | 5.28 | 29 | 3 | 46.0 | 46 | 27 | 5 | 35 | 38 | 5.42 |
| Donnie Dewees | L | 26 | 0 | 0 | 10.80 | 5 | 0 | 3.3 | 5 | 4 | 1 | 4 | 1 | 10.08 |
| Dakota Mekkes | R | 25 | 3 | 3 | 5.00 | 45 | 0 | 54.0 | 48 | 30 | 7 | 40 | 62 | 4.96 |
| Ben Hecht | R | 25 | 2 | 2 | 5.19 | 41 | 1 | 52.0 | 48 | 30 | 6 | 42 | 53 | 5.24 |
| Jesus Camargo | R | 24 | 3 | 4 | 5.29 | 33 | 1 | 64.7 | 70 | 38 | 11 | 28 | 49 | 5.36 |
| Colin Rea | R | 29 | 6 | 9 | 5.98 | 23 | 22 | 114.3 | 126 | 76 | 23 | 58 | 87 | 5.98 |
| Trevor Clifton | R | 25 | 5 | 7 | 6.03 | 24 | 21 | 100.0 | 111 | 67 | 19 | 55 | 77 | 5.94 |
| CD Pelham | L | 25 | 2 | 3 | 6.04 | 47 | 0 | 44.7 | 46 | 30 | 5 | 43 | 37 | 6.07 |
| Bryan Brickhouse | R | 28 | 1 | 2 | 6.97 | 29 | 0 | 31.0 | 34 | 24 | 7 | 23 | 26 | 6.86 |
| Player | K/9 | BB/9 | HR/9 | BB% | K% | BABIP | ERA+ | ERA- | WAR | No. 1 Comp |
|---|---|---|---|---|---|---|---|---|---|---|
| Kyle Hendricks | 7.6 | 2.0 | 1.2 | 5.3% | 20.4% | .284 | 118 | 85 | 3.3 | Dean Chance |
| Yu Darvish | 11.1 | 2.9 | 1.1 | 7.7% | 29.8% | .288 | 121 | 82 | 3.2 | Bert Blyleven |
| Jose Quintana | 8.2 | 2.8 | 1.2 | 7.4% | 21.3% | .300 | 101 | 99 | 2.1 | Mike Cuellar |
| Jon Lester | 8.0 | 3.0 | 1.4 | 7.8% | 20.5% | .300 | 99 | 101 | 1.8 | Geoff Zahn |
| Cory Abbott | 9.3 | 4.4 | 1.4 | 10.9% | 23.2% | .299 | 93 | 107 | 1.2 | Charlie Haeger |
| Tyler Chatwood | 8.3 | 5.6 | 0.8 | 14.0% | 20.7% | .284 | 96 | 104 | 0.9 | Jim Brosnan |
| Alec Mills | 8.0 | 3.1 | 1.5 | 7.8% | 20.4% | .299 | 88 | 113 | 0.8 | Mickey Callaway |
| Jharel Cotton | 8.6 | 3.6 | 1.5 | 9.2% | 21.8% | .290 | 91 | 110 | 0.8 | John Stuper |
| Jeffrey Passantino | 8.2 | 2.2 | 1.6 | 5.7% | 21.4% | .304 | 94 | 106 | 0.7 | Carlos Silva |
| Craig Kimbrel | 14.0 | 4.9 | 1.1 | 12.8% | 36.9% | .280 | 127 | 79 | 0.7 | Troy Percival |
| Casey Sadler | 7.6 | 2.5 | 1.3 | 6.4% | 19.7% | .287 | 107 | 94 | 0.6 | Dan Quisenberry |
| Jeremy Jeffress | 7.9 | 3.1 | 0.8 | 8.0% | 20.5% | .294 | 117 | 86 | 0.6 | Greg Minton |
| Brad Wieck | 13.4 | 4.3 | 1.3 | 11.4% | 35.4% | .288 | 119 | 84 | 0.6 | Armando Almanza |
| Duncan Robinson | 6.0 | 2.6 | 1.5 | 6.5% | 15.2% | .302 | 86 | 116 | 0.5 | Lary Sorensen |
| Jack Patterson | 7.8 | 5.2 | 1.0 | 12.8% | 19.0% | .300 | 91 | 110 | 0.5 | Walt Masterson |
| Duane Underwood Jr. | 8.3 | 4.0 | 1.4 | 10.0% | 20.8% | .301 | 88 | 114 | 0.4 | Tim Byron |
| Erich Uelmen | 6.4 | 4.9 | 1.0 | 11.9% | 15.4% | .301 | 86 | 116 | 0.4 | Preston Hanna |
| Brock Stewart | 7.5 | 3.9 | 1.5 | 9.7% | 18.7% | .297 | 85 | 118 | 0.4 | Dennis Burtt |
| Rowan Wick | 9.8 | 4.8 | 0.9 | 12.1% | 24.9% | .297 | 107 | 93 | 0.4 | George Smith |
| Brandon Morrow | 8.9 | 3.0 | 0.9 | 7.8% | 23.4% | .298 | 121 | 82 | 0.4 | Dick Drago |
| Adbert Alzolay | 9.3 | 4.6 | 1.6 | 11.3% | 23.2% | .299 | 85 | 118 | 0.3 | Denny Bautista |
| Dillon Maples | 14.9 | 8.9 | 0.7 | 21.1% | 35.5% | .307 | 107 | 93 | 0.3 | Jim Kern |
| Trevor Megill | 11.0 | 3.4 | 1.5 | 8.9% | 28.5% | .301 | 106 | 95 | 0.3 | Bill Simas |
| Keegan Thompson | 7.4 | 3.0 | 1.7 | 7.5% | 18.6% | .301 | 82 | 122 | 0.2 | Nate Cornejo |
| Tony Barnette | 8.5 | 3.3 | 1.0 | 8.5% | 22.2% | .297 | 108 | 93 | 0.2 | Fred Gladding |
| Wyatt Short | 8.5 | 4.9 | 0.9 | 12.1% | 21.2% | .299 | 101 | 99 | 0.2 | Marcelino Lopez |
| Tyler Olson | 9.2 | 4.1 | 1.2 | 10.4% | 23.3% | .297 | 105 | 95 | 0.2 | Tippy Martinez |
| Kyle Ryan | 8.2 | 4.5 | 0.9 | 11.3% | 20.7% | .295 | 99 | 101 | 0.2 | Tippy Martinez |
| Justin Steele | 8.6 | 5.4 | 1.4 | 13.1% | 21.0% | .296 | 84 | 118 | 0.2 | Derek Thompson |
| Ryan Tepera | 8.0 | 3.7 | 1.2 | 9.5% | 20.5% | .282 | 100 | 100 | 0.2 | Eddie Watt |
| Oscar De La Cruz | 8.0 | 4.1 | 1.5 | 10.2% | 19.9% | .300 | 83 | 120 | 0.1 | Tim Byron |
| Tyson Miller | 7.4 | 3.6 | 1.8 | 8.9% | 18.4% | .299 | 80 | 126 | 0.1 | Ron Mathis |
| Scott Effross | 5.8 | 3.2 | 1.0 | 8.1% | 14.4% | .302 | 94 | 106 | 0.1 | Casey Cox |
| Allen Webster | 7.2 | 4.4 | 1.4 | 10.7% | 17.4% | .303 | 85 | 117 | 0.1 | Bennie Daniels |
| Matt Swarmer | 7.4 | 2.7 | 1.9 | 6.9% | 18.7% | .303 | 79 | 126 | 0.1 | Bill King |
| Danny Hultzen | 12.6 | 6.3 | 1.3 | 15.6% | 31.3% | .290 | 98 | 102 | 0.1 | Scott Sauerbeck |
| James Norwood | 10.5 | 5.7 | 1.2 | 14.0% | 25.8% | .299 | 96 | 104 | 0.1 | Clay Bryant |
| Rex Brothers | 12.5 | 9.1 | 0.6 | 21.3% | 29.2% | .305 | 92 | 108 | 0.0 | Marshall Bridges |
| Jason Adam | 9.7 | 5.2 | 1.4 | 12.8% | 23.9% | .288 | 91 | 109 | 0.0 | Mark Acre |
| Xavier Cedeño | 8.1 | 5.6 | 0.9 | 13.7% | 19.8% | .298 | 93 | 108 | 0.0 | Marshall Bridges |
| Dan Winkler | 9.3 | 5.2 | 1.1 | 12.8% | 23.0% | .294 | 93 | 108 | 0.0 | Ted Abernathy |
| Craig Brooks | 11.7 | 7.7 | 1.0 | 18.3% | 27.8% | .299 | 93 | 108 | 0.0 | Clay Bryant |
| Manuel Rodriguez | 10.3 | 7.1 | 1.0 | 17.0% | 24.5% | .302 | 91 | 110 | -0.1 | Anthony Chavez |
| Brian Duensing | 6.0 | 3.9 | 1.0 | 9.8% | 15.0% | .300 | 87 | 115 | -0.1 | Darold Knowles |
| Bailey Clark | 7.4 | 6.8 | 1.0 | 16.0% | 17.4% | .297 | 82 | 122 | -0.2 | Ken Wright |
| Donnie Dewees | 2.7 | 10.8 | 2.7 | 21.1% | 5.3% | .308 | 40 | 250 | -0.2 | Chad Miles |
| Dakota Mekkes | 10.3 | 6.7 | 1.2 | 16.0% | 24.8% | .297 | 86 | 116 | -0.2 | Anthony Chavez |
| Ben Hecht | 9.2 | 7.3 | 1.0 | 17.1% | 21.6% | .298 | 83 | 120 | -0.3 | Dave Cole |
| Jesus Camargo | 6.8 | 3.9 | 1.5 | 9.6% | 16.8% | .296 | 82 | 122 | -0.4 | Bob Miller |
| Colin Rea | 6.8 | 4.6 | 1.8 | 11.0% | 16.6% | .294 | 72 | 138 | -0.6 | Robert Ellis |
| Trevor Clifton | 6.9 | 5.0 | 1.7 | 11.9% | 16.6% | .300 | 72 | 140 | -0.6 | Jake Joseph |
| CD Pelham | 7.5 | 8.7 | 1.0 | 19.3% | 16.6% | .304 | 71 | 140 | -0.7 | Brian Adams |
| Bryan Brickhouse | 7.5 | 6.7 | 2.0 | 15.3% | 17.3% | .293 | 62 | 161 | -0.8 | Brad Tweedlie |
Players are listed with their most recent teams wherever possible. This includes players who are unsigned, players who will miss 2020 due to injury, and players who were released in 2019. So yes, if you see Joe Schmoe, who quit baseball back in June to form a ska-cowpunk Luxembourgian bubblegum pop-death metal band, he’s still listed here intentionally.
Both hitters and pitchers are ranked by projected zWAR — which is to say, WAR values as calculated by me, Dan Szymborski, whose surname is spelled with a z. WAR values might differ slightly from those which appear in the full release of ZiPS. Finally, I will advise anyone against — and might karate chop anyone guilty of — merely adding up WAR totals on a depth chart to produce projected team WAR.
ZiPS is agnostic about future playing time by design. For more information about ZiPS, please refer to this article.
Dan Szymborski is a senior writer for FanGraphs and the developer of the ZiPS projection system. He was a writer for ESPN.com from 2010-2018, a regular guest on a number of radio shows and podcasts, and a voting BBWAA member. He also maintains a terrible Twitter account at @DSzymborski.
Baseball
“Baseball”
After checking my notes, I can confirm, yes, we are talking about baseball here. Next point of interest?
Yeah, this team looks like the clear best team in the division if everyone stays healthy, but can you imagine Tyler Chatwood starting in a playoff game if one of the top 4 starters wrecks his arm?
I won’t downvote it, but “clear” best team in the division?
Okay, maybe that was a bit strong. Probably more like: “likely best team in the division.”
Only if everything breaks right
Less so than the other teams.
Two notes of encouragement regarding the outfield:
In 442 plate appearances in batting order locations other than leadoff, Heyward slashed .286/.373/.471, good for a wRC+ of 119. When leading off (147 PAs), he slashed .147/.252/.302, “good” for a wRC+ of a whopping 47. Part of that was BABIP bad luck in a small sample size, but his overall line from 2019 is pulled down by that leadoff sample. I personally think he’s closer to that first line than he is the second; his approach and quality of contact greatly improved in 2019.
A full year of Ian Happ in center is a drastic improvement over what the Cubs ran out in 2019. I love AA as a person, but his career stats and underlying data don’t suggest anything more than fourth outfielder, yet he took almost 400 plate appearances in 2019. That just can’t happen on a team that’s trying to contend.
Meanwhile, Happer put up 1.5 WAR in 58 games. His upside is pretty high, while his floor is also high; his lowest wRC+ was his “down” 2018, where he put up a 106 wRC+. I expect him to fall in the 2.5 to 3.0 WAR range, given a full year and set position. He’ll strike out a ton, but he’ll play average defense and get on base a pretty solid amount. I think this projection is a little low on the defense, thus holding his WAR projection back.
Unsure why this is getting downvoted…
Probably because position in the order means pretty much nothing when it comes to projecting a player. The fact that a lot of Heyward’s bad/unlucky games came as a leadoff hitter was almost certainly a fluke and has no predictive power, you can’t arbitrarily throw out those bad games and raise the projection.
Probably because you don’t get to just dismiss his PA in the leadoff spot out of hand. They count too. His overall numbers were not that far out of line from his numbers the last few years. His Statcast numbers show his EV was up only very, very slightly (& most of that was hitting his ground balls harder) and while his LA was up a little bit, he still drives the ball into the ground way too much. His xwOBA was essentially unchanged from the 2 prior years and not terribly different from the prior 4 years overall.
There just isn’t any way around the fact that he is a 30yo glove-first OF with a league average bat and a no longer GG caliber glove.
Only 4 more years to go on his deal. . . .
I’m not dismissing it, just hoping that Ross puts him in a position to succeed more often than Joe did. I’m all about numbers, but I’d posit that there’s something psychological about hitting leadoff for some players.
I’m also not expecting him to randomly revert back to the 117 OPS+ player he used to be. I just expect him to be right around 100 OPS+, not 90. I also think he’ll see more time in right instead of bouncing between center and right; that’s where he’s most valuable.
Dan Pasqua definitely had a career as a baseball player, but since Epstien reportedly once called Schwarber “Babe F’ing Ruth!” That comp has to be a little disappointing.
Haha. I’ll have to check the WAR totals again. Think Schwarber is still slightly behind the pace…but neck-and-neck on the fat?
Schwarber is nowhere near as big as he was when he came into the league (he was a catcher, now he’s an outfielder) and nowhere near as big as Ruth was
Donnie Dewees’ weak pitching projection shouldn’t be a surprise since the guys 30’d his arm
Robin Yount & Bert Blyleven on the same team is a fun alternate timeline.
This team actually has a really cool comp list; several names I hadn’t heard of since I last organized my baseball cards, probably twenty five years ago. I’d love to see the comp team play together.
I count 4 HOF comps – Perez, Yount, Boggs and Blyleven
Didn’t Quiz make it as well? I don’t remember. Regardless, he’d at least make HoVG, as would Norm Cash and Mike Cuellar. Troy Percival was pretty decent for a while.
Nope. He’s been a cause celebre of Joe Posnanski’s for years, but he did not make it. He was one and done in 1996 with 18 votes, 3.8%. To me he was absolutely brilliant for about 6 years but like his contemporary, Dale Murphy, he just had nothing outside his prime. He also got a late start not making the majors until 27.
Who the heck was Jerry Grote
Who the heck was the other Jerry Grote
Same goes for Tippy Martinez. I mean, what are the odds that there were two different… oh wait. 😉
LOLOLOLO Cubs. Nice dynasty. Back to 4th place irrelevancy
Loser Cub fans downvoting. Still cant admit their organization is trash lmao
I’m not a Cubs fan, and I downvoted you, as your comments are typically juvenile and insulting and add nothing to the conversation.
I’m a White Sox fan and can confirm that guy sucks.
Astros fan here, their organization is top-5/6 in NL, probably top-10 MLB
I am very interested to see how the NL Central plays out this year. Steamer and ZIPs agree on the relative strength of the four competitive teams, but they are in almost exact reverse order of conventional wisdom and satisfaction with the off-season. By FG’s projections (Steamer and ZIPs prorated to FG DC) the order of the teams would be:
1) Cubs (40.5 Steamer, 43.0 ZIPs)
2) Brewers (36.1, 41.5)
3) Cardinals (35.3, 39.5)
4) Reds (32.8, 38.1)
All while the Reds have “won the off-season”, the Cardinals are division champs, the Brewers lost Grandal and Moustakas, and the Cubs signature signing is Jeremy Jeffress.
A much more talented and deeper Cubs team only won 84 games in 2019. I don’t see how this team tops that without exceptional health and somewhat rebounds from an old declining starting rotation. Not to mention the expectation around Chicago sports media is that Bryant is more likely to be traded than starting opening day for the Cubs. It definitely will be interesting to see how this turns out. It might not even take 88 wins to win the division.
The 2019 Cubs had the unluckiest record according to run differential and Baseruns had them as 3rd unluckiest. When projection systems are looking at them they aren’t viewing them as a 84 win team that got worse but more as a 90 win team that got worse. The Reds were also unlucky so they’re a 84 win team that got better, the Cards were pretty even so they’re a 90 win team that stayed about the same, and the Brewers were extremely lucky so they’re a 84 win team that got worse on paper. When you look at it like that it makes sense how the Cubs could be favored to win the division, but even if they do, they don’t look anywhere near the top WS contenders like LA, NY, and Houston
Come on, their Pythagorean record last year was a 90-win team. You’re better than this.
1) I know Dan says we can’t just add up the totals to get what Steve McAnderson did, but could he do something similar even if he’s not running it so we don’t have to guess? Even if it’s not the full Monte Carlo simulation.
2) The big issue there is that by Depth Charts, injuries aren’t easily projected. The Cubs are pretty low on depth; the Cardinals are comparatively high. This is part of the reason why Dan doesn’t want us to do this, since his Monte Carlo simulation supposedly takes this into account, so some mental adjustment is required.
I’d give it: 35% for Cubs, 25% for Cards, 25% for Brewers, 15% for Reds.
Just for fun…I go 33% Cubs, 33% Cards, 33% Brewers/Reds, 1% Pirates
Why not just say that you give it 100% odds that it will be an NL central team
Fans (and writers) are definitely biased toward teams who are adding well-known veterans in the off-season, hence the illogical: “Last year, our RF’s produced -2 fWAR. We just added a 2-win player, so that’s a 4-win turnaround there!” They then sum up these “turnarounds” and declare the most active team in the offseason the favorite.
Best to just go with Steamer & Zips who only look at who’s on your team this year and don’t care who was on your team last year. Bravo, SteveMcAnderson!
Dear Dan,
Please tell ZiPS not to feel bad about the comp for Hoerner. Ronny Cedeno’s career year with Iowa in 2007 led me to grab him up in all my fantasy leagues in 2008 AND 2009.
Sincerely,
tz
P.S. – I no longer play fantasy baseball.
8 wins in 154 innings for Darvish, 11 in 152 for Lester? When such an aspect of your system is so clearly broken, come up with SOME kind of a fix, Dan.
Lester’s projected as a league-average pitcher on an offense projected to be slightly better than league-average. He was 13-9 last year with an ERA *better* than the projection and with the Cubs scoring six runs per nine innings in his starts.
What would *you* project the W-L to be, with decisions in 74% of his starts (rounded from his three-year average) under these assumptions? Remember to show your work.
As for Darvish his decision numbers have been low because with two years of injuries sprinkled in, non-Dodgers teams have been very careful with him. It is beyond the ZiPS mission statement to predict how David Ross will treat Darvish in the future.
Darvish had six wins in *more* innings last year; I’ll be eager to see your prescription for fixing the errors in reality.
Pitcher “wins” are such an analytical atrocity it seems wrong to apply sophisticated projections to them. Getting a “win” isn’t a skill and it’s entirely context-dependent so anyone averaging over 5 IP per start is subject to wild variance. Also we should all stop thinking about that stat forever, starting now.
I’d prefer to not do them at all, but people go nuts if the traditional stuff isn’t included! I get enough people angry at me normally.
The traditional stuff is the only reason the great majority of us care. We use if for roto/fantasy. Why in the world else would I need to know what each member of the Cubs projects to do?
Yeah, we should all think “would Richie want to know this?” before we ever consider releasing any information.
Personally I threw away my WWJD bracelet and replaced it with WWRT, for “What Would Richie Think?”.
Really changed my life for the better
Richie seems super fun to hang out with.
Ah I guess all the writers at Fangraphs are exclusively writing to and for Richie.
Always happy to please.
Fix #1: Honesty. ‘ZIPS is unable to project Wins’.
Fix #2: Runs per game you project the offense to score, runs per start you project the pitcher in question to allow, innings you project.
Actually, I think this is my best moment ever on Fangraphs. The guy who does this for a living challenged me to fix something he himself can’t figure out (primarily because he actually doesn’t give a cat’s heinie about it), and I did so within 20-some minutes. Project those 3 things, all of which we have various systems for doing, and determining projected wins is simply a matter of crunching the historical numbers.
You didn’t fix anything, nor did I say there was an issue.
When I said show your work, I meant it literally. Not just declare what you want, which isn’t the same thing. You solved nothing more than the underpants gnomes; let’s see your superior pitcher win model in action.
What you’re seeing is me trying to be polite to someone who is being unusually strident. As my patience for rudeness is not unlimited, this will be my last exchange with you on this topic.
Pro tip for aspiring writers and bloggers- THIS is how you handle a commenter going into nasty mode. Richie (whom I’ve upvoted plenty in the past) has gone into the online equivalent of road rage. Dan’s wisely pulling a quick exit off the freeway.
If you read why he came to these numbers what you are saying is basically exactly why ZiPs spit out the totals they did. You just restated what he told you and you choose not to believe it.
Its not linear, do you know how wins work?
I thought Zips factored in height+weight in some capacity. If so, you’re going with the official numbers for Kimbrel, aren’t you? Sure would love to see what happens to Kimbrel’s projection upon adding 50 lbs. to his weight.
I don’t know about the numbers, but I bet he’ll get a handsomer comp.
While we’re at it, why not do a projection with Schwarber dropping 40 pounds, or Hendricks adding 11 inches in height.
I thought Addison Russell was no longer on the team?
Most recent team!
You will have a hard time finding someone that loves Anthony Rizzo more than I do. But I am curious as to how ZIPs projects him to have a higher WAR than Baez and Bryant, especially with how playing first base deflates WAR compared to the other 2.
Edit: Nevermind, I looked at the picture of the field and not the chart. Still not sure I buy him having a higher season WAR than Baez, but Baez is hard to project because he loves to swing. O how he loves to swing.
If one assumes that Hoerner was called up too early in his developmental path, and therefore his MLB stats are not very predictive and his minor league stats come mostly from AA and below, is ZiPS any less predictive? I wonder the same about Rule 5 guys – does or should the system account for the notion that their MLB stats are not accrued in the context of a traditional development path but rather can often be accrued because the team is forced to keep him in the majors to avoid offering him back? Like Victor Reyes two years ago, or Luciano last year.
Could be the MLB stats of these types have proven reliable in-system. Could be Hoerner wasn’t “called up too early,” but rather that his early struggles contribute to a legitimately dour outlook. Could be that having a traditional developmental path interrupted is itself a factor that predictably leads to lower career performance.
The question is an honest one, even if I have not posed it very well or the assumptions are flawed.
Thanks
Pardon a bit of a rant that’s not specifically directed at you. A lot of people seem to have the impression that Hoerner struggled in his call up. I’m an admittedly biased Cubs fan, but I watched pretty much every at bat he took and never got that impression.
With the caveat that he was very aggressive and didn’t walk much at all, he also rarely struck out and showed more power than his 2019 minor league numbers would suggest (It’s noteworthy he had a broken wrist early in the season that likely sapped some power upon his return. His minor league ISO prior to the injury was .220. It was .088 in AA the rest of the season after the injury, then .154 in the majors).
At any rate, Hoerner played in 20 MLB games. Going into his 19th game he was hitting .296/.324/.465 (100 wRC+). He ended the season going 1-7 with a sac fly, dropping his season line to .282/.305/.436 (86 wRC+). I feel fairly certain if he had not played in those last two games people looking at his line now would not think he had struggled.
Also worth noting he had an xwOBA of .322 and just a .300 wOBA, so I think his underlying performance was a little better than the final line suggests.
I do think Hoerner can probably benefit from a little more developmental time (especially in being more selective), but considering he only played in 89 minor league games + the AFL, skipped AAA, and was called up unexpectedly after being sent home for the year, I thought he had a really strong showing.
All good, great points. My question did assume that Hoerner’s performance was viewed as disappointing, in part because the discussion of Hoerner included, “The projections for Nico Hoerner’s upside are rather lackluster, but of the team’s offensive talent, he has the second-best WAR projection for the 2030 season, behind only Amaya!” I, perhaps erroneously, figured the “lackluster” projection of upside might have something to do with ZiPS not being impressed with his MLB stats, and that prompted me to wonder how the system might account for the fact that, as you put it, “he only played in 89 minor league games + the AFL, skipped AAA, and was called up unexpectedly after being sent home for the year.” I don’t think the system could account for the “called up after unexpectedly sent home,” but do wonder, for example, if the jump and lack of MiLB experience is baked-in somehow to ZiPS when weighting Hoerner’s 2019 MLB performance. It could be the opposite; it could be that the lack of minor league experience means Hoerner’s 2019 MLB numbers are carrying quite substantial weight in the projections.
Same with Reyes’ Rule 5 performance. It’s all the data ZiPS has from 2018 for Reyes. So it could be a pretty key driver of ZiPS’ projections, and I wonder if the system accounts somehow for Rule 5 circumstances. No criticism if it does not, as I am not sure how that would be done, but just wondered.
Anyway, it could be ZiPS thought Hoerner did well, all things considered, in 2019 with the Cubs and nonetheless believes he has rather lackluster upside. So any assumption ZiPS was disappointed by Hoerner’s 2019 with the Cubs is withdrawn. 🙂
Thanks for the reply.
I didn’t mean to dismiss your question! I think it’s a good one. I suspect that ZiPS is looking at his modest AA production and below average MLB line and doesn’t really factor in the wrist injury so it sees a soon-to-be 23 year old without much power or on base percentage at the upper levels. I think there is going to be more power eventually from Hoerner (and he showed some of it with 3 HRs in 20 games), but right now it’s really not there in his stat line, so I don’t blame ZiPS for not seeing it either. I would think his profile in general is really hard for a system like this to project (there’s just not a ton of pro data due to his injuries and missed time).
If he’s projected to have second highest WAR in 2030 AND his comp is Ronny Cedeno, the Cubs are effed
I would love for my NATS to find a way to get Bryant from the Cubs now that he is “disgruntled” about being a Cub. We are not likely to repeat with the current roster. Check might not even finish higher than 3rd in the division.
Man, just think how this team would look with Gleyber Torres and Eloy Jimenez. I know that means they would have to come up with another SP sine they wouldn’t have Quintana, but that would be an impossible every day lineup to have to navigate. They would also have a couple excellent replacements for the inevitable FA exodus in 2022.
In the universe they still have Gleybar Torres, they might be another “Cubs team that choked in the playoffs” in the history books, and still be the downtrodden Cubs who can never win.
Heck, Chapman had a save in all three Cubs 2016 NLDS wins against SF! If they don’t trade away Torres, it’s possible we would have endured ANOTHER year of Giants EYBS!
Yeah, yeah, yeah. I know. Flags fly forever and all that. Look, Chapman in 2016:
– LDS Game 1 – protecting a 1 run lead facing 1-2-3 (gave up a double to Posey to put the tying run in scoring position but notched the save)
– LDS Game 2 – protected a 3-run lead facing 5-6-7
– LDS Game 3 – blew the save giving up a triple to Conor Gillaspie and then letting the Giants tack on another run on a single to Brandon Crawford, a lefty which he is supposed to dominate. He then gave up a SB and a walk before getting replaced without getting out of the inning.
– LDS Game 4: Protected a 1 run lead facing 9-1-2
– LCS Game 1 – came in for the 6-out save. Proceeded to blow the save with a 2 run single to Adrian Gonzalez, another lefty. then proceeded to give up a SB to A-Gon. Adrian Gonzalez with a SB!?!?!?! Proceeded to get the W when the Yankees bailed him out.
– LCS Game 5 – came in to face 6-7-8 with a 6-run lead. Proceeded to give up 2 runs, including letting 3 lefties reach base.
– LCS Game 6 – came in with a 5-run lead to face 7-8-9
– WS Game 2 – came in with a 4-run lead. Walked Brandon Guyer.
– WS Game 3 – came in with a 1-run deficit and retired the side in order
– WS Game 5 – came in with a 1 run lead and retired the side in order
– WS Game 6 – came in in the 8th with a 5 run lead for reasons that are entirely unclear. Got 2 of his 4 hitters.
– WS Game 7 – Came in in the 8th with a 3-run lead and a man on. Proceeded to blow the save with a double to Brandon Guyer and a 2-run shot to Rajai Davis, a guy with 62 HR in 4,607 PA in his career.
Color me underwhelmed. Gleyber Torres’ career is obviously unwritten but that’s a lot to give up for the above.
That is not at all what happened in Game 5…In Game 5 of the WS Chapman had a 42 pitch 8 out save preserving a 1 run lead in a win or go home game. His WPA was 0.415. It is probably the most important pitching performance any Cub has ever had.
No, you’re right. I missed on that one. That’s still 4 saves (1 of which was of the bare minimum 3 runs/3 outs variety) against 3 blown saves along with 4 appearances in blowouts and 1 appearance in a game they were trailing.
Look, I don’t want this to come across as I think Chapman’s a bum or even that he pitched particularly poorly in that post-season. It is certainly possible that he was the difference in that title, but he also didn’t pitch particularly great either and it’s entirely possible (I would even say likely) that they win the title without him . The point is more that they gave up a middle infielder who went 278/337/535 with 38 HR, 96 R and 90 RBI last year and is under team control for 5 more years in order to get half a season of Chapman.
I agree with what you’re driving at here! But….you’re selling short Game 5 of the World Series. He didn’t just come “in with a 1 run lead and retired the side in order”. He came in with a man on and one out and a one run lead in the 7th inning and got a 2.2 inning save by allowing just one hit and 4 Ks.
I agree that he may not have been instrumental in the title for the reasons you say, but that Game 5 truly may have been where he was the difference.
Wow looking at this roster today…the cubs are sooo lucky they won in 2016 against that version of the Indians. They wouldn’t have stood a chance against the Astros Red Sox Yankeees since 2017. Lucky those teams were still a year away.
Bitter Cubs fans will downvote you but it’s true. That 2016 team was one of the weakest World Series teams ever
That certainly isn’t true. It wasn’t the strongest ever but it wasn’t one of the weakest ever. It isn’t even one of the weakest in recent history, that would be the Royals, that Cardinals team that won like 84 regular season games and probably 2 of the 3 Giants teams that won it are all worse.
Are you saying that the Cubs wouldn’t have won the World Series in 2017/18/19? We all know this since…they didn’t.
Idk what your point is here? The 2016 Cubs put together a great regular season and got lucky in the playoffs (which are basically a course in small sample sizes)
Hot takes:
– Miguel Amaya and Cory Abbott put in work to geth those very, very quality projections. Amaya or Josh Lowe (injured to open 2020 unfortunately) might be the most underrated prospects in baseball, though I guess I should wait for Amaya to do damage in AA. Alot of the projection algorithms seem to like Abbott, which makes sense considering he’s borderline ML ready in just his third pro season off some top of the league performances with plenty of innings at his stops. Hotter take is that Corey Abbott just sounds like the name of an MLB pitcher
– Yu Darvish pulling a near 4 WAR projection, over only 154 IP too, is badass and speaks to his talent. Between the NPB and MLB Darvish has a shot at ending 2020 with 2500 innings of sub-3 ERA AND RA9 production. Things have to go amazing but I think a HOF push is possible over the next 4 years with the Cubs and maybe beyond
– I’m taking the over on that WAR for Ian Happ. Those are some monster Isos. Been asking the clouds for years, years, for a switch hitting, high Iso, power/speed CF. He’s not a FA until 2024 too
– Anthony Rizzo is another one very quietly putting together one hell of a career, still earning 4+ WAR projections
– They get alot of crap for their pitching development but the projections for Abbott, Wieck, Wick, Brooks, Wyatt Short, and Patterson all caught my eye when scanning through…Solid HR prevention from that group to go with being tough to hit and missing bats
Jeffrey Passantino, Mr. Irrelevant in the 2017 draft, projects for a lower FIP than Lester, Chatwood, Mills, Alzolay, and Cotton (among other more notable prospects like Abbott, Steele, Patterson, etc.). No idea if he’s really that good, but his numbers last year were outstanding.
Go ahead and admit it. Your “comp” choice for Hoerner was just to be mean. LOL