A Graphical Look at Philly’s Infield Defense

The 2020 Philadelphia Phillies were bad at defense. Bam, there’s the story. Print it. Talk to you again tomorrow.
Oh, you want more than that? A reasonable request — this is FanGraphs, after all. Fine, then. The Phillies allowed a .342 BABIP last year, the highest mark in baseball and one of the highest marks ever. Some of that is due to the short season — it’s easier to be extreme in fewer observations — but some of it was because their defenders were inept at turning batted balls into outs.
What went wrong? For one thing, the Phillies played below-average defenders at most infield spots. We’ll exclude catcher, of course, because that’s a different kind of defense, but the tough defense extended across the diamond. Alec Bohm is a first baseman playing third. He’s not there for his defense, but with Rhys Hoskins at first, the Phillies got his bat into the lineup by any means necessary.
Next to Bohm on the diamond, Didi Gregorius is similarly defensively stretched. He played an acceptable shortstop earlier in his career, but he’s now on the wrong side of 30 and trending downwards. Both DRS and Statcast’s OAA think that he’s been one of the worst shortstop defenders in baseball over the past two years (UZR thinks he’s acceptable).
At second base, Jean Segura is the lone Philadelphia defender who you could consider overqualified for the position. He was a below-average defender at shortstop, but he’s adapted well to playing second base. All three defensive systems saw him as an above-average defender at second. He’s the only defender (other than Realmuto) on the entire team where that was the case in 2020.
Unfortunately, Segura was forced to cover a lot of ground, because he was flanked by two range-deficient defenders. We’ve already covered Gregorius, but Rhys Hoskins manages to show that first base defense isn’t completely meaningless. He’s one of the worst defenders there by every metric, and it’s not just scoops or stretches or any of those things you expect first basemen to fail at. He simply has no range whatsoever; he combines below-average top end speed with DH-esque burst; it’s not apples to apples, but his home-to-first time is about the same as J.D. Martinez and Nelson Cruz’s.
The outfield was potentially worse. Today, though, I’m going to keep focusing on the infield, because I found a fun way to visually show what’s going on. Take a look at this graph:
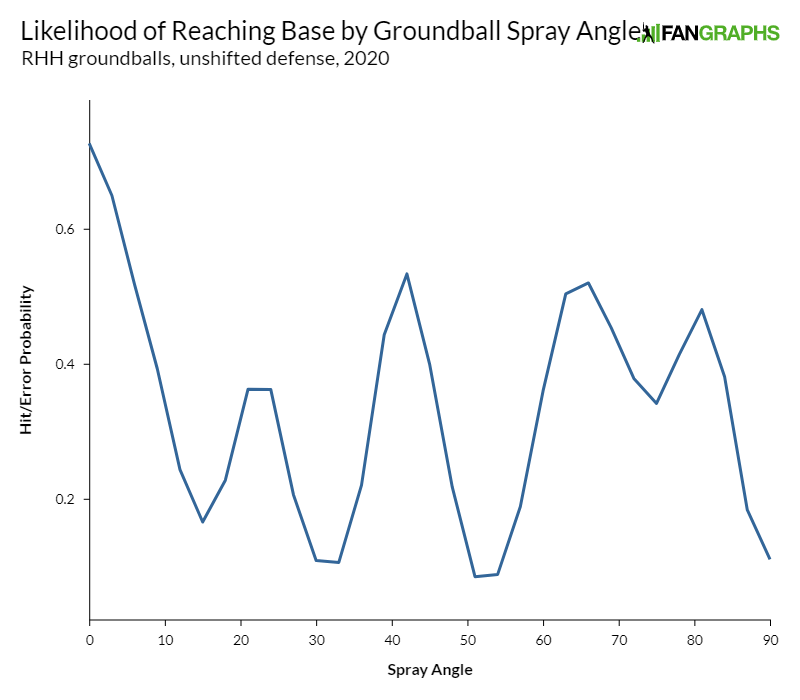
This is the likelihood of a grounder turning into a baserunner based on where it was hit. More specifically, I took every grounder hit by a right-handed batter against a standard defensive alignment in 2020. I did a bit of smoothing, then looked at the chances of a batted ball at a given horizontal angle turning into either a hit or an error.
The dead middle of the plot, 45 degrees, is second base. The valleys are more or less where defenders stand, which is why I limited this to batted balls with no overshift. The peaks are the holes in the defense; smash it down the third base line or in the gap between first and second basemen, and you’re very likely to reach base. That weird dip between first and second? My sense is that that’s due to the fact that first basemen sometimes play off the bag with no runners on base.
This isn’t a foolproof way of looking at defensive data. One problem is obvious: the only data I’m taking on each batted ball is its angle. A smashed grounder and a 17-hopper look the same in this data. A ball that dies three feet in front of the catcher does too. In a large sample, that can all even out, but we’re dealing with a small one here.
With the caveat that we’re looking at a third of a season’s worth of data, and will thus have some inevitable noise, let’s also look at how the Phillies did in converting grounders into outs:
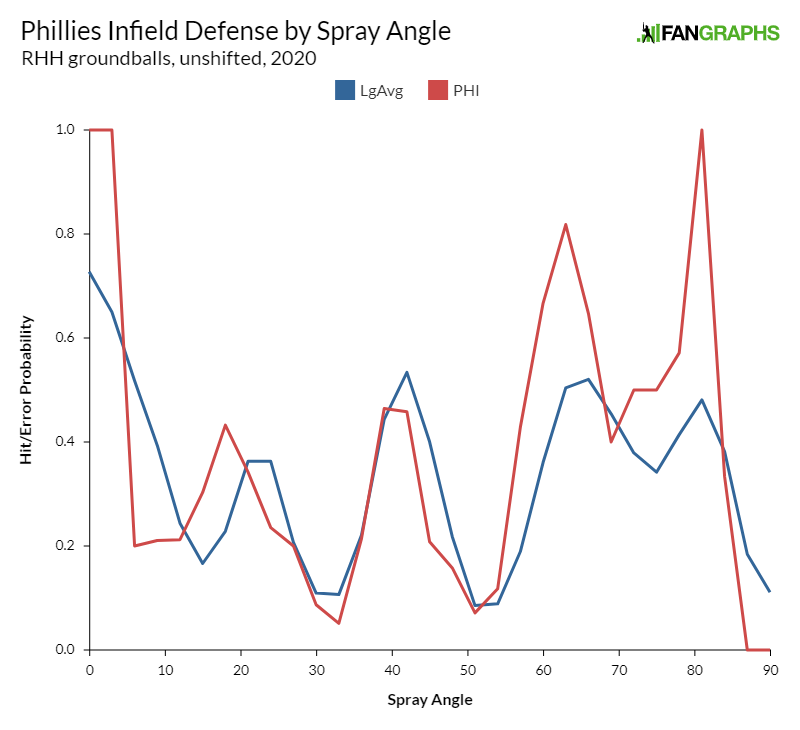
The locations of hit-probability valleys tell us something about how Philadelphia approached defensive positioning. The third-base valley is closer to the line than major league average. That makes sense — Bohm is limited range-wise, so he hugged the foul line more than normal to make up for it. That moves the peak between third and short, because the greatest gap between the fielders isn’t in the exact same place.
The valleys where Gregorius and Segura play also roughly mirror league average, with one exception: Segura is shaded towards the bag relative to most second basemen. That makes some sense — Gregorius is both range-limited and trying to help Bohm out. You can see that the Phillies were actually better than average at balls hit directly over the bag, because Segura is over that way helping. The downside of that is that they allow more hits on balls hit between first and second.
So far, so boring — until we get to the general first base area. There, it suddenly feels like we’re living in a horror movie. What’s going on here? It’s partially sample size. There simply aren’t that many batted balls in this subset in only 60 games of data. Some hits count as grounders but aren’t playable. Here’s Miguel Rojas with a “groundball single” per Statcast:
More worrisome: Hoskins is a sieve. Here, Zach Eflin induces a double-play ball:
Hoskins simply can’t get to it, despite decent positioning. This next one is a tougher play, but one that a more competent first baseman might have picked, or at least knocked down:
I couldn’t find a great camera angle for that one, so maybe I’m selling him short, but here’s one where you can see the glove in action (or glove inaction, see, I’m very clever):
That’s Scott Kingery at second making a near-spectacular play, but Hoskins had a chance to turn that into an out and whiffed.
To make matters worse, shifting the second baseman over to help out on the other side of the infield leaves them vulnerable on the right side of the infield. Here’s one that might have been an out with a less shaded defensive alignment:
One silver lining: not all patches of the infield are created equal, and it’s less important to be air-tight away from the pull side. Only 27.5% of these grounders were on the right side of the infield, because righty batters simply don’t hit opposite-field grounders very often.
Given that, let’s quickly look at what happened when lefties batted. A word of caution: lefties get shifted far more often, which means our dataset will be split in two. Here are the Phillies when overshifted against lefties:
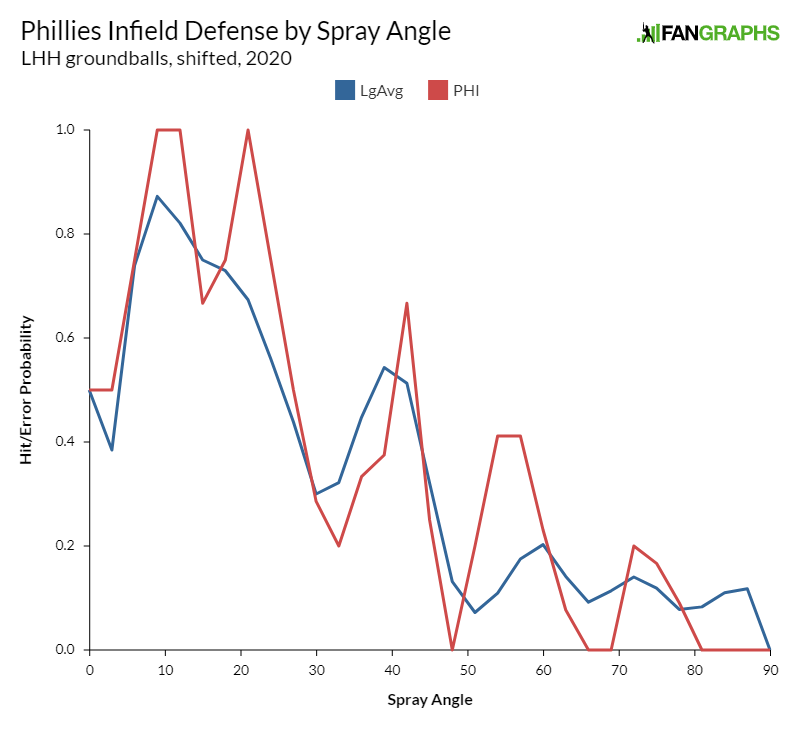
Not bad! There’s no shame in leaving the left side of the infield open against lefty batters. Here, the Phillies look almost average. With only 93 batted balls, though, I’m not sure how much we can say about this one. Here’s the unshifted data:
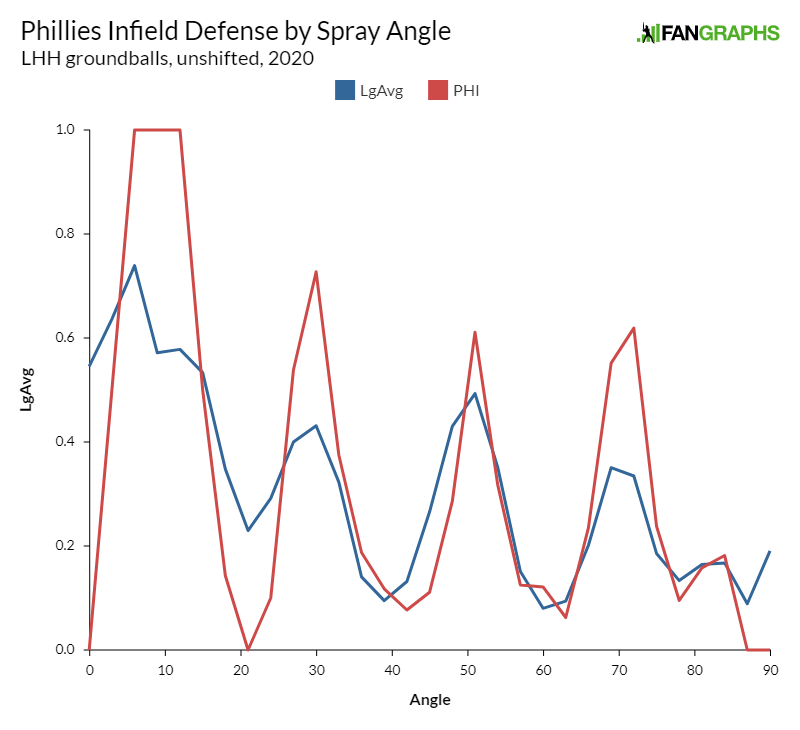
Here, the Phillies do a good job of moving their shortstop over the second base bag, which you can see at the 45 degree mark. The holes are all in the same place; they’re simply sharper. That’s partially a sample size issue, but it’s also an issue of range. Bohm and Gregorius overlap far less than an average infield; the same is true for Segura and Hoskins. They’re sure-handed in their zone, but no one is getting to the in-between balls. And sometimes, this happens (against the shift, though that hardly matters):
What’s the takeaway from all of this? Mainly I just wanted to show off these cool graphs. It’s fun to think of where the defenders are standing, where balls are hit, and how those two interact. None of those charts change the central problem, though. Bohm and Hoskins are under-qualified for their respective positions. Gregorius is a liability himself, and Segura can’t pick up all the slack.
Philadelphia is right on the border of contention this year. Last year, they were undone by their bullpen, but also by their defense. They’ve bolstered the bullpen, but unless the defense improves, we might be seeing more of the same this year. Given that it’s all the same players, it’ll be up to them to shore up the leaks in their infield and turn enough grounders into outs to keep their patchwork bullpen afloat.
Ben is a writer at FanGraphs. He can be found on Bluesky @benclemens.
I would really enjoy if you would produce some of these graphs for other defensive extremes, from other teams with some notorious infield defensive issues (like the Mets) to teams that have individuals with reputations for extreme defensive performance (say, the Arenado Rockies or the Chapman A’s) and teams with notoriously low BABIPs allowed (like the Dodgers consistently manage)