
Aaron Bummer’s Sinker Is No Disappointment
This season, the AL Central could feature three above-.500 teams for the first time since 2015. The Twins and Indians should remain at the top of the division, but after an active offseason, the White Sox could very well join them in a tight race. It reminds me a bit of the NL East in recent years: a lot of good teams, but none without a glaring hole somewhere.
The White Sox are hardly immune. Their rotation doesn’t project to be great, and there are still a few question marks in the lineup, like whether Yoán Moncada will regress, or Nomar Mazara will progress, and how Luis Robert will hit.
But even with those options, I would argue that Chicago’s most prominent weakness is their bullpen. By projected WAR, the White Sox relief unit ranks 26th in the majors, their worst individual ranking among any of the 12 positions we currently have listed on our Depth Chart pages. Most of their expected value comes in the form of Aaron Bummer, who flew far under the radar last season despite being among the best at one extremely important skill: inducing groundballs.
| Rank | Name | GB% |
|---|---|---|
| 1 | Zack Britton | 77.2% |
| 2 | Aaron Bummer | 72.1% |
| 3 | Adam Kolarek | 66.3% |
| 4 | Mark Melancon | 62.1% |
| 5 | Joe Kelly | 61.2% |
| 6 | T.J. McFarland | 61.1% |
| 7 | Luke Jackson | 60.5% |
| 8 | Clay Holmes | 60.3% |
| 9 | Chad Bettis | 59.6% |
| 10 | Richard Bleier | 59.2% |
In 2019, hitting against this lefty was quite the bummer, if you’ll forgive the pun. Batters posted a .235 wOBA in 262 plate appearances against Bummer, which is actually a few points worse than the offensive output of Austin Hedges in his 347 trips to the plate (.242 wOBA). Bummer was clearly doing something right, and much of his success can be attributed to his 72.1% groundball rate, which ranked only second to Zack Britton’s (77.2%) among qualified relievers. In fact, Bummer’s 2019 groundball rate was the ninth-highest of all 1,417 qualified reliever seasons during the 2010s. Here he finds himself on a list dominated by Britton and Brad Ziegler:
| Rank | Season | Name | GB% |
|---|---|---|---|
| 1 | 2016 | Zack Britton | 80.0% |
| 2 | 2015 | Zack Britton | 79.1% |
| 3 | 2019 | Zack Britton | 77.2% |
| 4 | 2012 | Brad Ziegler | 75.5% |
| 5 | 2014 | Zack Britton | 75.3% |
| 6 | 2017 | Scott Alexander | 73.8% |
| 7 | 2015 | Brad Ziegler | 72.8% |
| 8 | 2011 | Jonny Venters | 72.5% |
| 9 | 2019 | Aaron Bummer | 72.1% |
| 10 | 2018 | Brad Ziegler | 71.1% |
For Bummer to remain productive in 2020, he must repeat this skill. Bummer’s 3.41 FIP suggests he was quite a bit worse than his 2.13 ERA indicated (a gap that’s hardly unusual for a pitcher who relies on groundballs for outs), and that’s because his strikeout and walk numbers sat right around the league average for a reliever. That’s not to say that every reliever must have a dominant strikeout-to-walk ratio to have sustainable success. In fact, we have every reason to expect Bummer’s groundball rate to remain elite again this year — running through the data quickly, groundball rates for relievers are pretty sticky from year-to-year, with an r-value of 0.75 from 2018 to 2019:
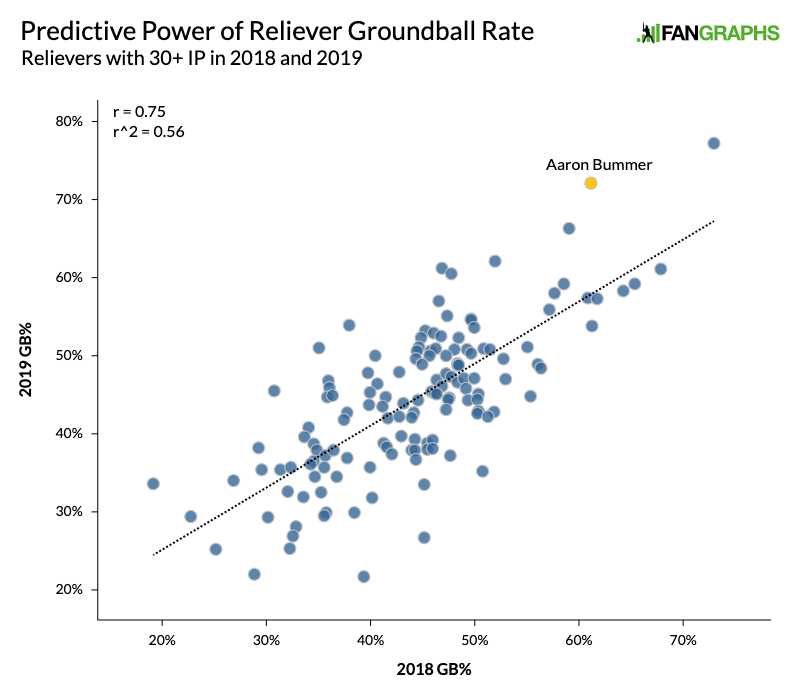
Bummer actually experienced one of the largest absolute changes in year-to-year groundball rates from 2018 to 2019. When looking at the absolute value of the deltas, he comes out with the 11th-highest change in year-over-year groundball rate among the 141 relievers with at least 30 innings in both years. He had the seventh-highest percentage point increase in year-over-year groundball rate:
| Rank | Name | 2018 GB% | 2019 GB% | Delta |
|---|---|---|---|---|
| 1 | Amir Garrett | 38.0% | 53.9% | 15.9% |
| 2 | Justin Wilson | 35.1% | 51.0% | 15.9% |
| 3 | Héctor Neris | 30.8% | 45.5% | 14.7% |
| 4 | Tyler Clippard | 19.2% | 33.6% | 14.4% |
| 5 | Joe Kelly | 46.9% | 61.2% | 14.3% |
| 6 | Luke Jackson | 47.8% | 60.5% | 12.7% |
| 7 | Aaron Bummer | 61.2% | 72.1% | 10.9% |
| 8 | Luis Avilán | 36.0% | 46.8% | 10.8% |
| 9 | Jace Fry | 46.6% | 57.0% | 10.4% |
| 10 | Mark Melancon | 52.0% | 62.1% | 10.1% |
While Bummer was certainly well above-average at this skill in 2018, he turned in an unprecedented season of grounders in 2019. For further proof of him newfound dominance, examine his average launch angle against, which fell from +0.7 degrees to -3.4 degrees. That was the second-lowest average launch angle in baseball, among the 436 pitchers to allow at least 100 batted balls last season. Only Britton’s -8.9 degree (!) average launch angle against was lower, and only five pitchers overall held hitters to a sub-0 mark.
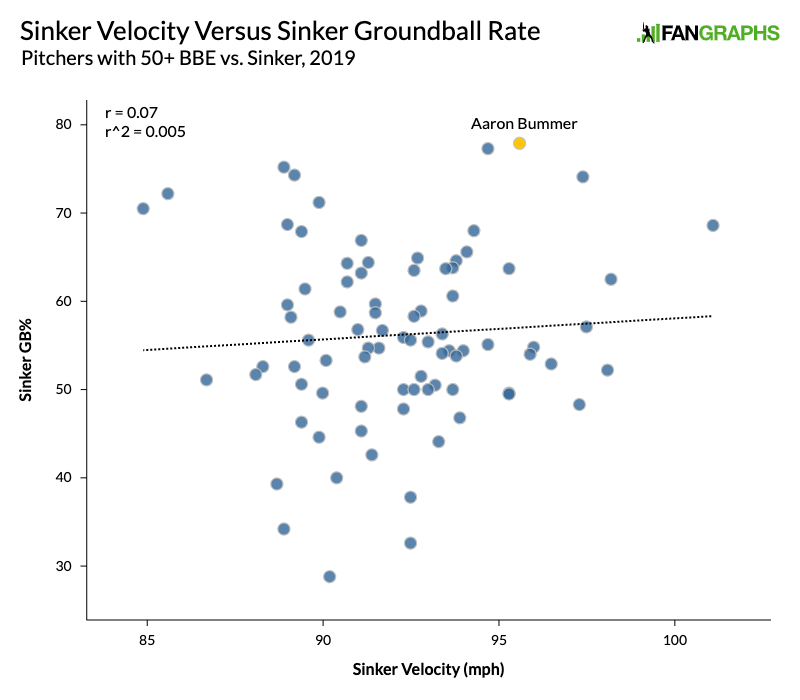
Bummer clearly became really good somewhere, and it’s obvious that his outstanding sinker had something to do with it. He added 2.5 mph on the pitch from 2018 to 2019, which could serve as a decent hypothesis to explain why his groundball rate shot up. A faster sinker could have been harder to square up, which, in turn, could have led to more groundballs. But there’s almost no correlation (r = .07) between a pitcher’s average sinker velocity and his sinker groundball rate alone, indicating that other factors might be at work here:
In order to evaluate Bummer’s improvement in full, I built a multiple linear regression model for pitcher’s sinkers and their respective groundball rates, accounting for three input variables using data from Baseball Savant and PITCHf/x: sinker velocity, sinker vertical movement, and the absolute value of sinker horizontal movement (because lefties and righties experience opposite x-movements on their sinkers).
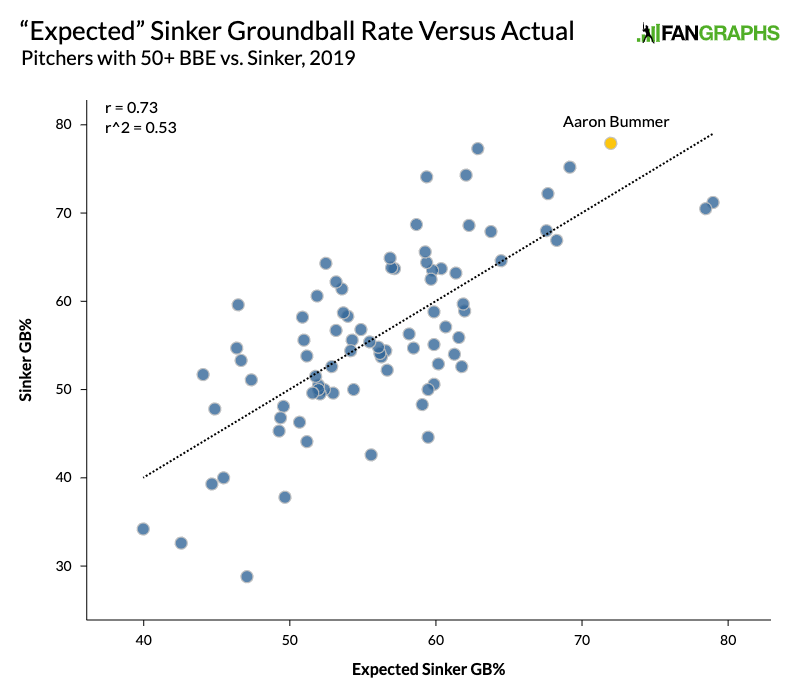
Of these three inputs, vertical movement proved to be the most important, with a one-point increase of vertical drop resulting in, on average, a 3.1-percentage-point increase in sinker groundball rate. Horizontal movement also played a rather significant role, but with the opposite effect: on average, a one-point increase in horizontal movement yielded a 2.0-percentage point decrease in sinker groundball rate. Velocity, too, played a role when looked at in combination with these other variables.
Thus we can more fully understand why Bummer’s sinker became extraordinarily dominant in 2019. Not only did he add velocity, he experienced 31% more vertical drop than the average sinker at his velocity and 20% less horizontal movement than the average sinker at his velocity. While the extreme vertical movement was consistent from 2018 to 2019, the extreme lack of horizontal movement on Bummer’s sinker (for its velocity) was new:
| Year | Velocity | Inches of Drop | Drop Above Avg | % vs. Avg | Inches of Break | Break Above Avg | % vs. Avg |
|---|---|---|---|---|---|---|---|
| 2018 | 93.1 | 28.9 | 7.1 | 33% | 13.6 | -1.0 | -7% |
| 2019 | 95.6 | 27.3 | 6.5 | 31% | 12.1 | -3.0 | -20% |
It’s tough to discern this difference from the naked eye — we are only talking about a few inches here — but for posterity’s sake, here’s a Bummer sinker from 2018:
And here’s one from 2019:
Admittedly, it’s hard to notice a difference. I’d rather have the data tell me something changed for Bummer, and indeed, that is what it indicates. The data also demonstrates the uniqueness of Bummer’s pitch: No other pitcher in baseball even came close to featuring a sinker with as much velocity, as much vertical break, and as little horizontal break as Bummer.
As long as Bummer maintains this combination of factors on his sinker, there’s no reason to think he can’t anchor the White Sox bullpen again in 2020. Perhaps worse BABIP luck is on the horizon. Even still, maybe Chicago’s bullpen won’t be so bad after all. At a minimum, they should feel confident they can trust Bummer to get valuable outs for them this year.
Devan Fink is a Contributor at FanGraphs. You can follow him on Twitter @DevanFink.
Love the article Devin. If Jace Fry can figure out how to not walk batters again, the White Sox could have two nasty left handed relievers for 2020.
It seems Bummer’s sinker is less of a downer now than last year.
Definitely some good stuff here–I’d like to see that xGB% regression model–but I’m wondering if you’re maybe overthinking it a little? I wrote about Bummer for the community blog over the summer (https://community.fangraphs.com/inside-aaron-bummers-transformation-or-how-to-make-a-lights-out-reliever-from-scratch/), and I found that in addition to the velo bump, his command seems to have improved significantly. Location charts show that the biggest year-over-year change was really that he figured out how to throw the sinker where righties in particular wouldn’t crush it. He also scrapped the slider completely for a cutter that pairs much better with the sinker in terms of velo and movement. All of that is an easy recipe for more weak contact and a LOT of ground balls. Seems like it’s actually a pretty textbook improvement path.
I love poring over data like this, but it also makes it easy to forget that it’s a two-player game, so to speak. Sinkers with extra V-break don’t induce more grounders just by virtue of having more V-break, they do because more V-break means it’s more likely to end up in a spot where the hitter can’t do anything but put it on the ground. Doing all that work to figure out the implications of gaining or losing an inch of break is cool and potentially useful, but I think in this case it’s losing the forest for the trees a bit. There’s a lot of bigger contextual factors that can/should be assessed before we start breaking down an inch or two of pitch movement, at least most of the time, IMO.
I know the rotation wasn’t the point here but you brought it up and you said what everybody is saying – the projections say it is going to be middle of the pack at best. While that may be the median or mean outcome, I think that is a big over-simplification. They have Giolito whose projections may be dragged down by his pre-2019 numbers, but his peripherals make last year look sustainable. Then they have Cease and Kopech who don’t have enough track record for the projection systems to love yet but have been prized prospects and behind that they have Hansen and Rodon returning from TJS mid year. Stiever seems to be on the rise, having added velo last year. Even Reynaldo Lopez has some upside potential although the longer he goes without realizing it the less likely that happens. That doesn’t even get into Keuchel, who probably won’t be bad, and Gio Gonzalez who should at least be nice depth.
So while it is true that the rotation doesn’t project as great, I think it is also true that it has far more volatility and more upside potential than most rotations that are predicted to be of similar quality. Without doing a deep dive, I wouldn’t be surprised if at least half the GM’s in MLB prefer the White Sox collection of starters (current and near future) to their own.
TL;DR there’s a big difference between having five 30 year old journeymen each predicted for 2 WAR and a bunch of kids who total 10 WAR, have been highly rated prospects, but no track records and are recovering from Tommy John.
White Sox’s 1-2-3 of Bummer, Marshall and Colome was lights out last year though. I guess Colome and Marshall were pitching way above their peripherals though. How does Marshall’s grounder tendencies look like versus Bummers?