Anthony Rendon and Alex Bregman Are the Same, and Also Different

If you watch enough baseball, players start to blend together in your brain. You know what I’m talking about — Corey Seager is injury-prone Carlos Correa. Ozzie Albies is caffeinated Jose Altuve (no small feat, since Altuve is a Five Hour Energy spokesperson). Newly minted $100 million man Alex Bregman is Anthony Rendon with good hair. The Bregman/Rendon comparison occurred to me even before I saw Bregman play. A highly-drafted college third baseman with an excellent all-around game? More power than you’d think despite a swing that seems designed to put the ball in play? Probably a little better at baserunning than you’d expect, even if he isn’t a burner? Yeah, that pretty much covers both guys.
Nothing Bregman has done since reaching the majors has changed this early comparison in my mind. Between 2017 (Bregman’s first full year in the bigs) and 2018, he’s recorded a 141 wRC+ to Rendon’s 140. Bregman has walked 11.3% of the time, Rendon 11.6%. Bregman has struck out 13.7% of the time to Rendon’s 13.6%. Bregman has a .219 ISO; Rendon’s is .230. Bregman has 50 home runs; Rendon has 49.
You get the general idea — both players have been incredible, and both have done it in really similar ways. Rendon has been worth 13 WAR over the past two years, second-best among third basemen. Bregman has been worth 11.1 WAR, good for fourth. Here’s another thing they have in common — they were both among the most extreme swing-rate changers from 2017 to 2018. Plot twist, though! It was in opposite directions. Bregman decreased his swing rate by the third-most among qualified hitters, while Rendon increased his by the second-most. Yes, we’ve finally found a place where Anthony Rendon and Alex Bregman are different — extremely different.
For Alex Bregman, 2017 must have been a mix of satisfaction and frustration. His 217 PA in 2016 exhausted his rookie eligibility, and while he held his own in his first big league action (114 wRC+), he looked very much like someone struggling to adjust to big league pitching. He struck out in 24% of his plate appearances, light years higher than his 10% career minor league rate (and 7.5% college rate). His swinging strike rate was 11.8%, meaningfully above league average. In short, he didn’t look like the hitter scouts expected him to be.
2017 was a huge step in the right direction — a 15.5% strikeout rate probably still felt quite high to him, but made a lot more sense for someone with his talents. Still, though, Bregman’s full-season line fell short of his minor league numbers — he hit .284/.352/.475, good for a 123 wRC+ and 3.5 WAR, a better than solid regular but not quite an All-Star. The Astros won the World Series, and it’s obviously hard to beat that thrill, but Bregman probably felt like he hadn’t unlocked his full potential.
In 2018, Alex Bregman’s swing profile changed completely. He went from the 56th-lowest Swing% among qualified batters to the 5th-lowest, which isn’t a thing you do by half-measures. He swung 7.7% less overall. He swung 8.6% less at fastballs and 6.7% less at secondary pitches. He swung 5.8% less often at balls, 5.9% less often at strikes. He swung 12% less often on the first pitch. About the only place where he didn’t decrease his swing rate was with two strikes, where he actually swung a touch more often (58.2%) in 2018 (the league average is a touch above 60%). Why make this change? Some of it comes down to organizational philosophy. As hitting coach Dave Hudgens said in an interview in 2017, “I don’t want guys swinging at a pitch unless they can do damage. If you go in with that mind-set, you’re not going to miss your pitch as often.”
Pretty much every Astro has decreased their swing rate over time, though none to quite as striking a degree as Bregman. Why did the change help him so much in particular? I can’t speak for Bregman, but I do have a theory. See, Alex Bregman isn’t the biggest guy in the world. He needs to work for his power — he can’t just Aaron Judge-it up there and hit everything out. Where does that power come from? Well, in the center of the strike zone or inside, with a small splash of up and away:
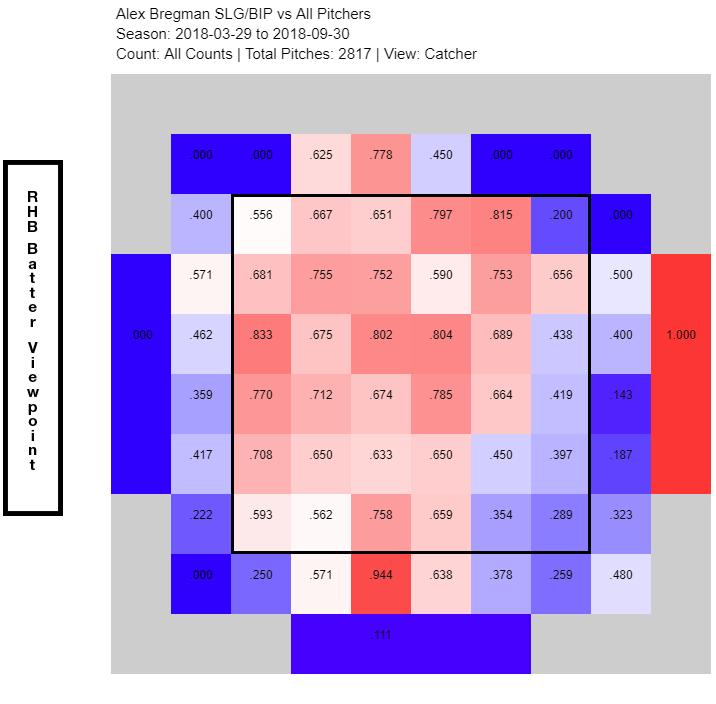
That’s Alex Bregman’s slugging by zones in 2018, and that’s just common sense. One small problem, though. Here’s where Bregman swung in 2017:
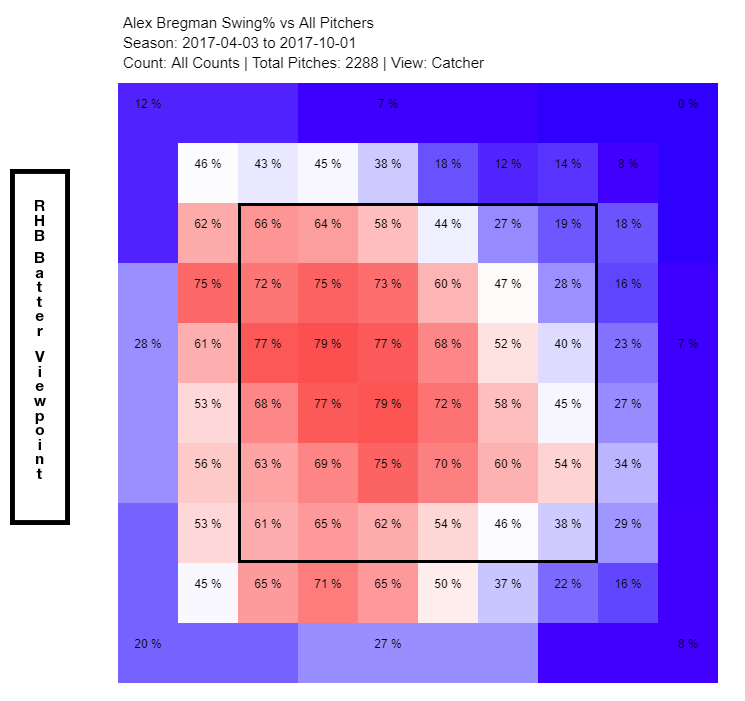
Look, I’m no pattern scientist, but I can tell that’s not ideal. There are just too many swings in zones where he isn’t generating that much power. Even worse, Bregman doesn’t swing and miss much, so he was making contact with those inside pitches, both high and low, and not doing much with them. The pitches off the inside edge are especially damaging for someone who relies on getting the barrel on the ball to hit for power. Here’s Bregman’s 2018:
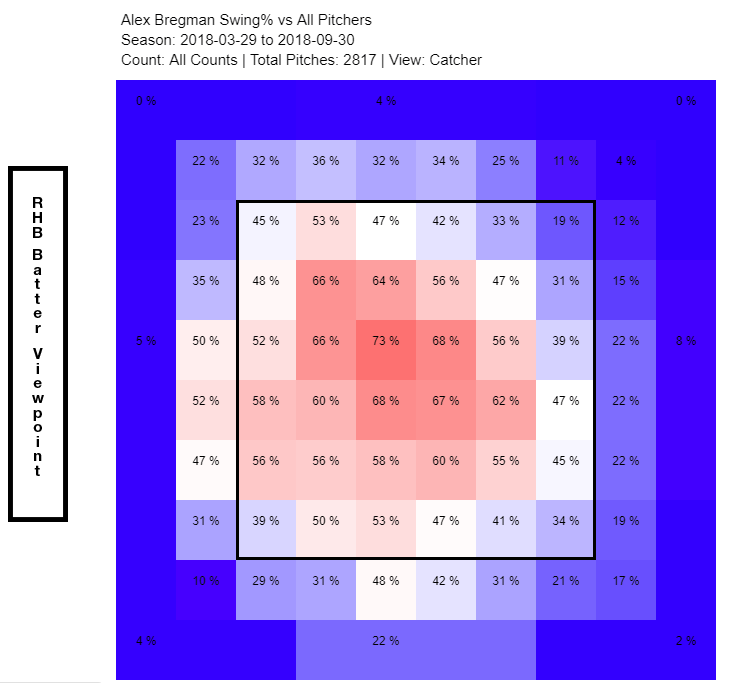
Ahhhh, much better. Alex Bregman was swinging at too many pitches, both balls and strikes that weren’t in his preferred part of the strike zone. He decided to be more selective and hunt a pitch to hit early in the count, and boy did it pay off. There was an important auxiliary benefit as well. In 2017, Bregman saw a middle-of-the-pack 14.5% of his plate appearances reach a 2-0 count (league average is about 14%). In 2018, that climbed to 18.7%. 2017 Bregman got to a 3-1 count 9.7% of the time. 2018 Bregman did it 14.4% of the time. What about 3-0 counts, that mythical Shangri-La of batting? Bregman was dead on league average in 2017, 4.6% of plate appearances, before seeing them 6.8% of the time in 2018. In each case, he went from middle-of-the-pack to one of the top 20 batters in baseball in terms of reaching those counts. Not only was Bregman swinging at better pitches when he swung early in counts, he was reaching hitters’ counts more often. That’s a recipe for success.
Okay, the story of swinging less often and getting better at hitting is easy to tell. Admit it — when I got to the evidence backing up Bregman’s improvement, you switched to skim mode, looking for pictures and clever turns of phrase, because you didn’t need to see the proof. I get it — that one just makes intuitive sense. Swinging markedly more, though? That’s not an adjustment I expected. And when I say swinging more, I really do mean swinging more, by the way. Rendon swung at 7.3% more of the pitches he saw in 2018 than he did in 2017. He swung more at fastballs. He swung more at secondary pitches. He swung more at pitches in the zone, and he swung more at pitches out of the zone. If you’re getting an inverse Bregman vibe here, I’m with you. It’s gratifying that the answer isn’t as simple as “Oh Rendon just got better.” If he magically swung more at pitches in the zone without increasing his chase rate, we’d just chalk it up to going full Votto. If he started ambushing fastballs without swinging more at filthy curves, hey, good work, no further analysis necessary! Luckily, it’s not quite that simple.
Rendon didn’t show the same marked improvement in 2018 that Bregman did, but that’s largely because he was already great in 2017. He slashed a sensational .308/.401/.533, good for a 141 wRC+, and his 6.7 WAR was a career high. There wasn’t much impetus to tap into more of his power, because he’d just hit for a career-high ISO. Strike out less? He had a career-low strikeout rate in 2017. Walk more? You guessed it — a career-high walk rate. Rendon didn’t need to change his batting approach to improve, because he was firing on all cylinders already. 2018, then, was more a story of Rendon adjusting to what pitchers threw him.
To wit: Rendon has always been a high-contact hitter, but he’s generally been a very patient hitter as well. In 2017, he was in the 10th percentile among qualified hitters in terms of first-pitch swings. Despite this, pitchers were pretty careful with Rendon. They threw pitches in the strike zone slightly more than league average and fastballs slightly more than league average, but basically treated him like an average batter. In 2018, pitchers pushed the envelope a little bit more. They upped the percentage of 0-0 pitches in the strike zone from 55% to 58.5%. They upped the percentage of fastballs from 68.2% to 70.7%. Maybe batting Rendon earlier in the lineup changed how many strikes he saw, though there’s not much evidence of that. Mostly, pitchers seemed to just try to steal a few more strikes against a patient but formidable hitter.
How did Rendon respond? Well, as I mentioned above, Rendon was in the 10th percentile of 0-0 swingers in 2017. In 2018, he moved up to the 45th percentile, raising his swing rate by 9%. Here’s the most obvious way to think about it: In 2017, if you threw Rendon a first-pitch fastball in the strike zone, he swung 27.5% of the time. More than two thirds of the time, that’s a free strike. In 2018, he swung 45.5% of the time, a tremendous increase. That was bad news for the pitchers facing Rendon — his wOBA was a comical .534 when he put the ball in play on these swings, with six doubles, a triple, and three home runs in 35 results. This targeted aggression was definitely part of Rendon’s plan for 2018, and it worked to perfection. Pitchers fed Rendon first-pitch hittable fastballs, and he feasted.
For the most part, this was a brilliant adjustment. The main downside of swinging more on the first pitch is more 0-1 counts, and Rendon is the exact kind of player to minimize that downside. He’s reached an 0-1 count 1675 times in his career and compiled a 94 wRC+ in those plate appearances. If that sounds uninspiring, well, MLB as a whole has put up a 65 wRC+ after 0-1 over that time frame. Rendon’s phenomenal contact rate keeps him alive in pitcher’s counts, and he took advantage of that fact in 2018 to look for more pitches to hit early in the count.
How did Rendon’s decision to swing more on the first pitch pan out? Well, his wRC+ fell from a career-high 141 to … 140. His strikeout rate increased from a career-low 13.6% all the way to … 13.7%. His xwOBA actually rose, from .378 to .388. All of these numbers, by the way, vastly outstripped his projections. ZiPS had Rendon striking out 16.1% of the time on the way to a 119 wRC+, while Steamer pegged his K% at 16.3% and his wRC+ around 121. In short, Rendon beat the regression bug, and he did it by evolving. In 2019, Rendon projects to have a 127 wRC+ and a 15.2% strikeout rate. Can he make another adjustment to keep defying gravity? Only time will tell.
So, there you have it. Alex Bregman and Anthony Rendon are almost an exact match at surface level. If you enhance, enhance, enhance all the way down to the swing level, though, they’re nearly perfect opposites. Bregman picked a new approach to focus on his strengths. Rendon picked a new approach to take advantage of pitchers’ tendencies. The two approaches went in exactly opposite directions, and yet they were both right. Sometimes baseball is amazing.
Ben is a writer at FanGraphs. He can be found on Bluesky @benclemens.
“Newly minted $100 million man Alex Bregman is Anthony Rendon with good hair.”
This is the single most incorrect thing ever written on FanGraphs.
No respect for the flow!
Having never noticed either guy’s hair, I looked it up and . . . Sleepy is right.
Rendon’s hair is spectacular. He had a day off toward the end of 2017, and he let it down and washed out the gel, (maybe picked it out?) and it was huge and glorious.