Ben Clemens FanGraphs Chat – 3/9/20
by Ben Clemens


March 9, 2020
Keston Hiura hit 38 home runs last year. There are qualifications to that statement, sure — 19 of those home runs came in the homer-happy PCL, and the majors weren’t much better when it came to mass dingerization. But still — Keston Hiura, who hit 13 home runs in 535 plate appearances in 2018, hit 38 home runs in 2019. What did he do to become such a great power hitter, and should we expect to see it again in 2020?
The first place you’d generally look, when considering an outlandish result like this, is for something wildly unsustainable. Maybe he turned half of his fly balls into home runs, and we can just point at that and move on. Indeed, Hiura’s HR/FB% was a juicy 24.1% in the majors last season, and an even more preposterous 36.5% in Triple-A.
Let’s throw out the Triple-A numbers for now. The combination of a new stadium in San Antonio and a wildly changed offensive environment makes putting those home runs into context difficult, so we’ll simply focus on the major league numbers. Non-pitchers hit home runs on 15.4% of their fly balls in 2019. Lower Hiura’s 24.1% to average, and he would have lost out on seven home runs. Easy peasy, let’s get lunch… right?
Well, yeah, not so much. I prefer to look at a different denominator: balls hit with between 15 and 45 degrees of launch angle rather than “fly balls.” That adds some line drives, which are potential home runs, and removes balls hit at too high of an angle to get out. Hiura had 83 of those in 2019, and turned 22.9% of them into homers. The league turned roughly 15% of theirs into dingers. Still the same seven home runs.
But batters aren’t all average. They have control over their home run rates, far more so than pitchers. Regress Hiura’s results in 2019 back towards the mean, and they suggest a true talent home run rate around 20.5%. That would still give him 17 home runs in the majors, not too much worse than his actual production. Read the rest of this entry »
Take a look at any Mets prospect list from 2017 and Amed Rosario was the headliner. He was all fast-twitch muscles and gorgeous defense. His frame was the type that looks perfectly suited for shortstop: tall and rangy, but not so lanky that he couldn’t one day hit for power. We saw him as a 65 FV prospect, the third-best in all of baseball.
After 2017 and 2018, that assessment looked sorely misguided. Over 762 plate appearances across those two seasons, he put up every scary number imaginable. He walked only 4.2% of the time while striking out 22% of the time, both worse than he’d performed in any full minor league season. Pitchers knocked the bat out of his hands; he hit for a .129 ISO despite 12 triples. The speed that made those triples possible didn’t translate into extra value; his BABIP was only .318, which is good but not great, and he was caught stealing a brutal 14 times.
Those are just offensive outputs, but the offensive and defensive approach were perhaps even scarier. He swung at 42% of pitches outside of the zone, the sixth-highest chase rate in the bigs. Every hitter who chased more often than him, however, channeled their aggression better; he somehow swung at a below-average percent of pitches over the heart of the strike zone in 2018 despite all the chasing. Read the rest of this entry »
In April of 2018, Trevor Bauer conducted an experiment. While he never admitted it, he mysteriously threw the ball with significantly more spin for an inning. Given Bauer’s repeated insistence that adding pine tar or some other equivalent foreign substance could increase his spin rate by 200-300 rpm, and the fact that his spin rate was almost exactly 300 rpm higher in the first inning as compared to the rest, he might as well have winked.
So, uh, let’s talk about last September. The following graph is Bauer’s average four-seam fastball spin rate by game:
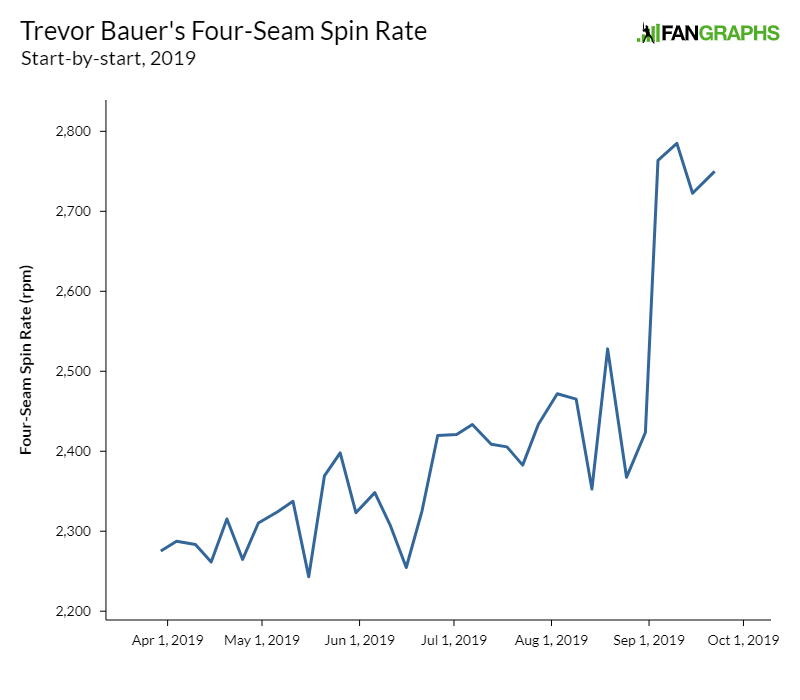
Now, I’m not a baseball scientist. But short of Alan Nathan and Meredith Wills and David Kagan, those are in short supply. So I thought I’d conduct a non-rigorous but still curious investigation of these September starts to see if I could get to the bottom of what happened.
Let’s get something out of the way first: my base case, before I started investigating, is that Bauer got back into the sticky stuff. The jump is just so clean, so consistent within each game, that it doesn’t look at all accidental. In a single earlier game, on August 19, Bauer seemingly discovered some spin, posting his then-highest single game average spin rate, just over 2500 rpm. For the rest of 2019, however, he lived between 2250 and 2500 rpm. Then, like magic, every single pitch Bauer threw in September had a spin rate higher than 2500 rpm.
What could cause this, if it isn’t some type of sticky substance? It’s a long shot, but maybe Bauer started cutting the pitch. What does that mean? If you already know, you can skip this section, but I’ll go over it quickly. Picture a tire rolling down the road. Now, picture that same motion by a ball in air, with no road in the way. That’s transverse spin. Picture the baseball with that tire-style spin, with the car in reverse, and you have a 100% spin efficiency fastball. Read the rest of this entry »
The “problems” the Los Angeles Dodgers face must seem foreign to most other major league teams. When Dave Roberts discussed his Opening Day rotation last weekend, it wasn’t in the same way most managers do. You know that way, because your favorite team’s manager probably does it. “Here are three good starters, one starter who we hope is good, and one starter who we hope is decent.” Not every team takes this approach, of course, but the league isn’t awash in great fourth starters, never mind fifth starters.
But the Dodgers aren’t the league. Their top three — Clayton Kershaw, Walker Buehler, and David Price — are locks. The team is using Julio Urías, who has bounced between starting and relieving, in the rotation. And Alex Wood, who was an above-average pitcher each of his last two years in Los Angeles before injuries ruined his 2019, is overqualified as a fifth starter.
It doesn’t stop there; the next four starters are all interesting as well. Dustin May, who might have made the rotation decision tougher for Roberts if he weren’t injured, is a top 15 prospect in all of baseball. Jimmy Nelson may not pitch, but if he does, he’s potentially excellent. Tony Gonsolin filled in last year in the rotation when the team faced injury issues and acquitted himself well. Read the rest of this entry »
When you think of Anthony Rendon, you probably think of consistency. He’s good every year, in roughly similar ways: he doesn’t strike out much, walks a good deal, hits his fair share of homers and doubles, and plays good defense. He’s been worth more than 4 WAR in every one of his full seasons. He’s a line drive hitter, a batting average machine. If anything, he’s become more consistent over time: in each of the last three years, he’s been worth between 6 and 7 WAR and struck out between 13% and 14% of the time.
I don’t buy it, though. Rendon might seem consistent on the surface, but under the hood, he’s completely revamped his game to unlock progressively more offensive potential. In fact, I can retell the Anthony Rendon story as a progressive improvement over time. Let’s try that now.
In 2015, the first year for which we have Statcast data, Rendon was hurt. He sprained his MCL in spring training, sprained his oblique while rehabbing the MCL, and somehow got forced off of third base — a year after a 6 WAR season — by Yunel Escobar. He played the majority of the season at second and scuffled.
That’s a low baseline, which makes any tale of improvement easier to tell. But let’s start there anyway. Rendon didn’t hit the ball with much authority that year — oblique strains aren’t good for power. When he put the ball in play, he generated a .343 wOBA, significantly below the league average of .361. Those numbers don’t really mean much out of context, so think of it this way: in 2019, Luis Arraez and Kolten Wong were below league average by roughly that amount. Read the rest of this entry »
I’d like to show you a graph. It’s not a surprising graph, nor a shocking one. Here’s the production on batted balls across all hitters in 2019, grouped by launch angle:
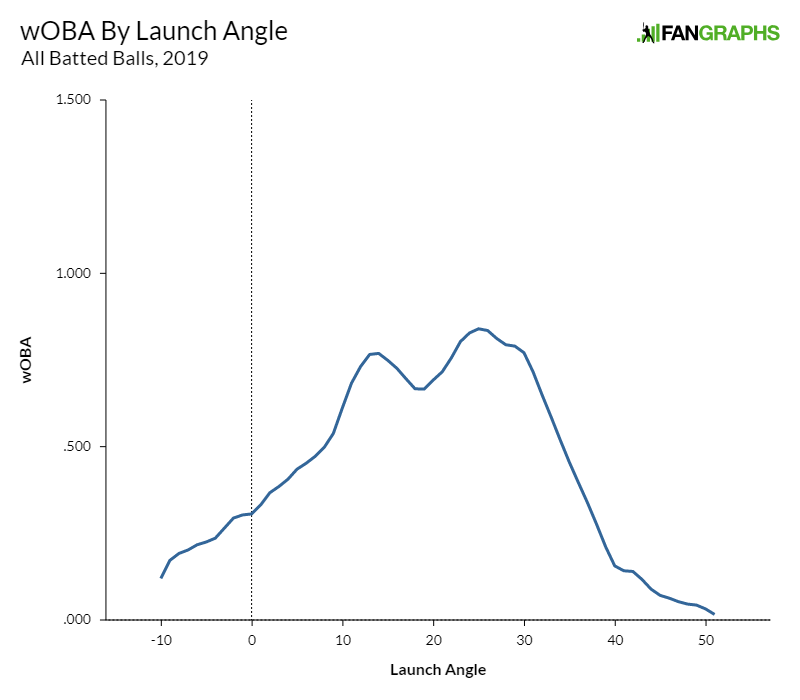
It’s not exactly rocket science. Hitting the ball straight down is death, hitting the ball straight up is just as bad, and most of the juice comes in line drives and fly balls that don’t approach popup status. There’s even a cute little dimple right around 15 degrees, where the ball has too much loft to be a flare but not enough that you’re all that likely to hit a home run. That all seems to make sense.
Next, let’s complicate it slightly. Here’s the same graph, only with batted balls hit less than 95 mph excluded: Read the rest of this entry »
Last week, when giving our playoff odds a quick once-over, I stumbled across something interesting. In translating from player statistics to our projections, we strip out the impact of reliever leverage. That seems intuitively weird, so I wanted to delve into the thinking behind it and see if I could find a workaround.
First, a quick recap of the issue. When we calculate WAR for relievers, we include the impact of leverage. This makes sense — the last reliever off the bench is mostly pitching in blowouts, so their contribution, good or bad, is less important than the closer’s. If you used a dominant reliever in a mop-up role, they’d be far less valuable than if they got to pitch in games where the outcome was uncertain.
How do we adjust for leverage? It’s reasonably straightforward. Take a reliever’s gmLI, which you can find in the Win Probability section. Kirby Yates, for example, had a gmLI of 2.16 last year. gmLI is the average leverage index when a pitcher enters the game. You can find a recap of leverage index here, but it’s essentially a measure of how important a given plate appearance is. A leverage index of 1 means that the situation is exactly as important as the average plate appearance, 2 means the situation is twice as important, and so on. Read the rest of this entry »