Author Archive

Joe Mauer’s Deal Finally Finalized

Worry no more Minnesota fans; a soothing balm to news on Joe Nathan’s season-ending surgery has quickly arrived. According to sources, Joe Mauer has done what we mostly all expected and come to an extension agreement. There had been progress toward this all winter and while I am sure the news today bums out fans in New York and Boston, they should not be surprised.

At least, the idea that Joe Mauer is staying in Minnesota should not surprise them. What they, along with everyone else, might be surprised about is for how long. Though an ultimately bogus lead earlier in the off season had Mauer signing a ten-year contract, today’s announcement of an eight-year, $184 million deal is still an incredibly big one. Beginning in 2011 and covering only what would have been free agent years, Mauer averages $23 million per season through 2018, covering his age 28 through 35 seasons.

Mauer was worth an incredible eight wins last year even without any credit for his defense, which most regard as above average. Both CHONE and the Fans expect Mauer to be worth 7.3 wins this coming season, though I am skeptical that he maintains such a high value as a hitter while also catching as often as the projection systems have him doing. Mauer spent 109 games at catcher last season and 28 at designated hitter and I think that’s a roughly fair expectation for him in the future as well. You should always strive to be conservative when it comes to catchers.

Overall, I think a 6.5-win projection is a little more realistic for Mauer, a total that even with the recently depressed market, surpasses his AAV salary. In the short term, this deal is fair to both sides. Where it might get dicey is down the line when Mauer reaches his mid-30s. I don’t think him staying at catcher is needed for this to work out though. Mauer’s bat is good enough to stand a move to first base and he would benefit from a likely increase in playing time. My concern is simply that for being on the hook for eight years and giving him a full no trade clause, I feel the Twins should have gotten a bit more of a discount.

The general rule is that long term contracts get about a 10% discount for compounding injury risk. If you apply that here, Mauer’s $23 million per year acts more like $25.5 million in valuation, a figure that would require him to maintain a 6-win pace for the duration of his contract. Can he do that? Sure. He might even exceed it, but the downside outstrips the upside here. That’s only a nitpick though and it might turn out that some of that money is deferred. In the end, if Minnesota had to cover a few extra million in order to keep Mauer in the Twin Cities, it’s going to be worth it to them from a PR perspective and it’s great for baseball that such a star is staying in his home organization.


Spring Training Thoughts

I have never been much of a fan of Spring Training, or of exhibition matches in any sport. Spring Training irked me more because my love of baseball necessitated that I be more acutely exposed to the reports that came out from these meaningless games. I have a hard time caring less which players are in the best shape of their life or who worked on the most new pitches over the winter. I wanted no part of it.

All that went out the window when I was offered the opportunity to head down to Arizona with my fellow FanGraphers for a weekend stay. Just the chance to get out from the cloudy Seattle weather was motivation enough, but a chance to meet and commisserate with baseball people far more informed and curious than I was an excellent bonus. I can heartily say that I had a great time and David Appleman deserves endless thanks not just for this trip but for paving all the roads that lead there in the first place.

Did any of the baseball actually change my mind on Spring Training? Not really. I still don’t care much for the “news” making parts of Arizona and Florida games, but the trip did bring to light an angle that I had previously been ignorant of. After a nearly six month layoff from baseball, it really was gratifying to see some being played again, even if it meant nothing. Getting to see it in conjunction with a mini-vacation, as the south is for those of us aboding up north, made it all the more better as did the wonderful company.

I will say that tickets to the games were cheaper than I anticipated, running around $12 for field seats and under $10 for the general admission outfield grass “bleachers.” That was a welcome surprise in an industry so accustomed to squeezing out every cent possible. If asked before the trip what my advice would be for would-be Spring Training attendees, I would have said “don’t go.” With the benefit of hindsight, I now would say “go once, at least.” Just make sure you bring some sunscreen, a car and some patience for the traffic.


Vegas and the Fans

Vegas odds principally aim to achieve equal bettor action on over/unders. That is, the oddsmakers set the lines so that they can best achieve a 50/50 split on the bets. Their general aim is then to predict what the average gambling public will think about the number of wins a given team will achieve.

The fan projections here at FanGraphs, converted into wins by David Appelman, measures much the same goal except that the input comes from what is most likely a more forward-thinking and baseball-educated crowd and appeals to the same people.

These similar goals presents a great comparison opportunity. Here are some of the more egregious differences between the Vegas oddsmakers and the FanGraphs readership with CHONE’s projections provided as well.

Arizona. Vegas: 82.5, Fans: 87 (CHONE: 79)
Baltimore. Vegas: 73.5, Fans: 78 (75)
Cubs. Vegas: 82.5, Fans: 78 (79)
Angels. Vegas: 84.5, Fans: 80 (81)
Athletics. Vegas: 77.5, Fans: 81 (81)

Phillies. Vegas: 92.5, Fans: 84 (87)
Padres. Vegas: 69.5, Fans: 79 (78)

The first five teams listed all had about a 4-win difference between the fans and Vegas with CHONE mostly siding with the fans, aside from Arizona, and waffling between the two on Baltimore. The bottom two represented the largest divergence between Vegas and FanGraphs readers and, again, CHONE mostly agrees with the fans.

Is there a common thread running through the five teams where the fans and CHONE offer different opinions than the Vegas oddsmakers? I would say the general public, and Vegas by extension, are too prone to be swayed by 2009 results. Hence, teams that were good Angels, Phillies) or bad (San Diego, Oakland) suffer from some residual effects. The Cubs are present I expect because of their large and devotedly optimistic fan base.

In the end, I would consider shorting the Phillies, Angels and Cubs and buying on the Padres and Athletics.

Hat tip to Jonah Keri for passing along the odds.


Edwar to Texas

Matt Klaassen wrote on March 1st about Edwar Ramirez’s designation from the Yankees and today the seemingly inevitable trade was worked out. That the trading team was Texas presents some interesting considerations.

As Klaassen pointed out, a big part of Ramirez’s troubles in 2007 and 2009 aside from his walks were his home runs allowed. We do not yet have enough data on New Yankee Stadium to ascertain how home run friendly it is, but suffice to say that a move to Texas is not going to do much to help Edwar keep his many flyballs in the yard.

The projection systems do see some improvement coming for Ramirez, but almost entirely in a recovered walk rate. The strikeout rate from 2007 might be gone forever as there is generally only so long that you can dominate with a change up when your fastball averages below 90mph. If Edwar cannot get his walks figured out, then he’s unlikely to have a long enough leash to figure things out, especially since he’s almost assured to be allowing a lot of home runs in the launching pad that is Arlington with his ground ball rate in the low 30%’s.

The Rangers got Ramirez for “cash considerations” so ultimately the actual cost to them is going to be pretty low. The biggest risk they face are the innings that they let him pitch. Those are a scarce commodity, and is Ramirez does not improve from his 2009 performance then those innings would have been easily allocated in a better fashion. The biggest upside they have is that Edwar returns to being a serviceable reliever by getting his walks under control and avoiding too many damaging home runs. Even then, he’s unlikely to provide too much value and I wouldn’t be optimistic about a positive outcome.


Appreciating Extra Innings

I was in Vancouver last weekend following along with the hockey games and got to raging against the overtime method used in the final game. I can understand limiting overtimes during the run up to the medal games as there are a lot of games to play in a short amount of time but for the medal games I firmly believe it should stay 5-on-5 and go until somebody scores.

My discussion on the matter lead me back to thinking about NFL’s overtime rules, which seem to be under review, and then to Tango’s two prompts about possible rule changes in baseball and it clicked how much I enjoy baseball’s overtime rules compared to every other sports.

To me, baseball gets it perfect. I want overtimes to not fundamentally change the sport and I want them to present equitable opportunities for both teams. The NFL fails drastically on the latter aspect and college football on the former. I think shootouts and penalty kicks and other gimmicks are dumb, but tolerable if you really cannot stomach the idea of a tie and they are contained to the regular season only.

When it comes to the playoffs though, you need to let the players play the sport they’re being paid for. Does anyone enjoy the World Cup being decided on penalty kicks? The US-Canada gold medal game was thrilling but the chance of a shootout deciding it was a possible wet blanket hovering over the enthralling overtime period.

I know some people toy around with the idea of modifying the innings once extras are reached. I understand the thoughts behind starting each inning with a man on second for example, but I am perfectly content with extra innings as they are now. It makes games longer, sure, but that extra tension is part of the fun for me.

I am by no means a traditionalist and generally welcome discussion on any subject that might conceivably make a sport more enjoyable, but it’s a subjective measure of enjoyment and personally there’s no way to top what we have now. Kudos, baseball, for getting that one right.


The BA List

Baseball America released their list of the overall top 100 prospects in baseball today. The link to it is here.

Generally, I am not much of a fan of prospect lists. Lists are an easy way to deliver content and I think the goal of most prospect lists is to inform people about some various players that they might not otherwise be exposed to. That’s a good goal, but it strikes me that often most of the ensuing discussion revolves around minute differences in opinion on the ranks themselves, rather than about the varying merits of the players. Maybe people keep track of prospects better than I do and so everything on these lists is old news to them, but is it really important to debate whether Stephen Strasburg should be number 1 instead of number 2?

That is not to say that I don’t look at the rankings, but I like to look them more as groupings than as strict delineations. For instance, Miguel Sano coming in only in the mid-90s after all the hype that he got? That surprised me and drove me to read some more recent reports on him to try and understand BA’s ranking. I liked how Brett Wallace was ranked 27th and Michael Taylor 29th. I guess BA sees that trade as pretty even?

Aroldis Chapman all the way up at 22? I am a bit skeptical that he should be that high, but I can understand why scouts would drool over him. Similar to Tanner Scheppers being all the way at 42. To me, nobody with his injury history should be that high until he shows himself well past the recovery phase, but I think that could be a fun debate.


Groundballs and the Overall Picture

I have seen people claim that a pitcher’s ground ball rate is not a useful piece of information because grouping pitchers by it shows no meaningful difference in runs allowed. FIP is comprised of a pitcher’s strikeouts, free passes (walks plus hit batsmen) and home runs. Based on the last few posts the data seems to indicate that strikeouts and free passes are not meaningfully effected by a pitcher’s ground ball rate and home runs decrease. A scatter plot bears out the expected result.

Instead of artificially grouping pitchers, a full trend line points to a pitcher’s ground ball rate being a useful piece of information, even on its own. It is not just FIP though but actual runs scored follows the same trend.

In conclusion from the previous five pieces here is a a list of variables that appear to have no meaningful deviation as a pitcher’s ground ball rate increases:

  • Home run rate per non-groundball
  • Overall strikeout rate
  • Overall walk rate
  • Slugging percentage on line drives in play.
  • And here is a run down of what I consider the be the key results found for what does happen as a pitcher’s ground ball rate increases:

  • Slugging percentage on fly balls in play increases.
  • Overall slugging percentage on non-ground balls increases.
  • Less pop ups are allowed.
  • More runners reach via error.
  • Fewer home runs are hit.
  • Their FIP goes down.
  • Their RA goes down.

  • Groundballs and Walks (and Strikeouts)

    I have looked at ground balls and fly balls in isolation and how increasing ground ball rates interact with a pitcher’s home run and slugging percentages. What about plate appearances that do not end with a batted ball? I took a look at strikeouts and walks as well and found them both to decrease in absolute frequency as ground ball rates rose.

    That is not unexpected since the more ground balls a pitcher gets, or more fly balls, or anything really, the fewer plate appearances there are available to be ended in a strikeout or a walk. Still, it was worth a look at these absolute frequencies since the raw strikeout and walk totals are the inputs into FIP-based metrics.

    I was not satisfied with looking only at those absolute rates however. I wanted a fairer judge of whether gunning for ground balls had a meaningful effect on a pitcher’s ability to get strikeouts or prevent walks. My answer to that was to change the denominator from plate appearances to plate appearances that did not end in a batted ball.

    Imagine two pitchers, one a Brandon Webb-esque groundballer, the other a Jered Weaver-type flyballer. Each of these two pitchers have a certain amount of batters faced that end in a strikeout, a walk, a hit batsmen or some other freak occurrence that was not a batted ball. Of those plate appearances, what percentage ended in a strikeout? What percentage ended in a walk?

    It turns out to not have a meaningful difference. Fly ball pitchers might get more strikeouts and fewer walks as a percentage, and it might even be statistically significant, but the rate of change here is so small though as to be immaterial. The expected difference between the two biggest reasonable extremes in ground ball rate (30% to 60%) amounts to fewer than five strikeouts or walks over 200 innings pitched.

    Given that there appears to be little change in strikeout and walk rates and an obvious decline in home runs as ground ball rates increase, how does a pitcher’s ground ball rate affect overall performance? That’s next.


    Groundballs and Slugging Rates

    Beyond noting that ground balls are less damaging on their own than fly balls I also looked into the effects that a pitcher’s ground ball rate has on his home run rates and found no compelling evidence to support the theory that ground ball pitchers suffer higher rates of home runs on the fly balls they do allow. There’s more to damaging run scoring than just home runs though. I went digging further and started looking at slugging percentage allowed on the batted ball types, absent home runs.

    Looking at line drives that ended up in play, were they more dangerous as a pitcher’s ground ball rate increased?

    Nope. As it turns out based on the data that I have looked at is that as a pitcher’s ground ball rate goes up, the quality of line drives that he does allow, both the ones that go for home runs and the ones that stay in the park, do not change. Moving on to fly balls however, the first negative trend for ground ball pitchers emerges.

    Interestingly, though the rate of fly balls that go for home runs appears to fall as a pitcher’s ground ball rate increases, the slugging percentage on the fly balls that stay in the park goes up. Why? I don’t know. Maybe outfielders shade in and more fly balls go over their heads. Maybe there is some systemic shift in the type of fly balls allowed, though it would be weird for them to be hit harder and yet not see an increase in home runs.

    All told, it does look like ground ball pitchers see a rise in their slugging percentage allowed on non-ground batted balls. The effect is neither large nor overly consistent but it appears to be present. Up next, I look at strikeouts and walks.


    Groundballs and Home Run Rates

    Yesterday, I looked at balls hit on the ground versus balls hit in the air and their relative weights of offensive levels. The conclusion that arose from that was that ground balls are far less harmful to pitchers than fly balls. I do not think that should come as a shock to anyone, though the magnitude of difference might have been surprising.

    Of course, pitching is not isolated. In order to get more strikeouts, pitchers generally have to pitch more out of the zone and thus risk more walks as well. Pitchers that seek ground balls tend to pitch lower in the strike zone, and one theory that has been prevalent is that ground-ball pitchers allow home runs more often on their fly balls since their “mistake pitches” are elevated into the hitting sweet spot. In other words, when they aim low and miss high, watch out. It makes some sense, but does the data bear this out? I went looking at figures from both leagues over the 2007 through 2009 seasons.

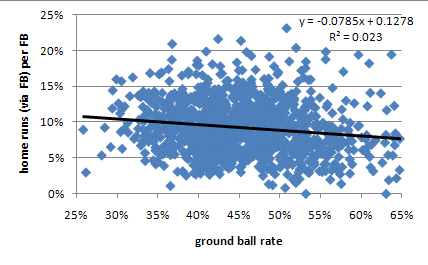
    Looking only at batted balls classified as fly balls (no line drives or pop ups), as a pitcher’s ground ball rate increases does a pitcher’s home runs allowed via fly ball per fly ball increase?

    No. In fact, it goes down a little. This might be surprising to some, but I expected something close to this result as it is something I have looked at a couple different times over the past few years and continually end up with the same answer. This look was slightly different as I restricted the home runs in question to only those coming off fly balls. I usually find a trend line that is close to horizontal if I include all types of home runs. Either way, nothing close to a positive trend.

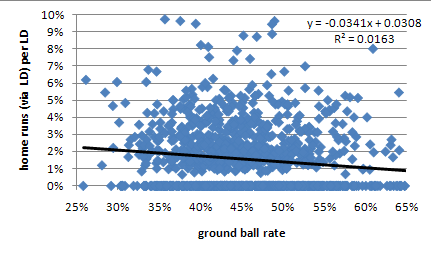
    What about line drives? Looking only at batted balls classified as line drives, as a pitcher’s ground-ball rate increases does a pitcher’s home runs allowed via line drive per line drive increase?

    Also no. I was genuinely surprised by this. Even if you restrict the data to pitchers that allowed a line-drive home run (to get rid of the influence of all those zero values) the slope is still negative. Line drives are the squarest form of contact by the hitter and I did buy into the theory of more damagingly placed mistake pitches from ground-ball pitchers at least a little.

    It turns out that while ground-ball pitchers are expected to allow more line drives, on a rate basis, than fly ball pitchers, the line drives themselves are less likely to leave the yard. My guess is that this would be due to some fuzziness in the distinction between hard hit ground balls and line drives and that ground-ball pitchers see a greater share of line drives credited against them that have no chance of clearing the fence.

    Combining the previous two questions, as a pitcher’s ground-ball rate increases does a pitcher’s home runs allowed per non-ground ball increase? No. Less surprising now given the answer to the two previous looks, but worth mentioning for completeness. Also worth noting is that on all of these the R^2 values are incredibly low and the slopes are not dramatic. The best rule of thumb I can state from this look is that a pitcher’s ground ball rate has no impact on his various rates of yielding home runs and what impact there is might actually be negative.