Author Archive

The Fastest Freeze in History

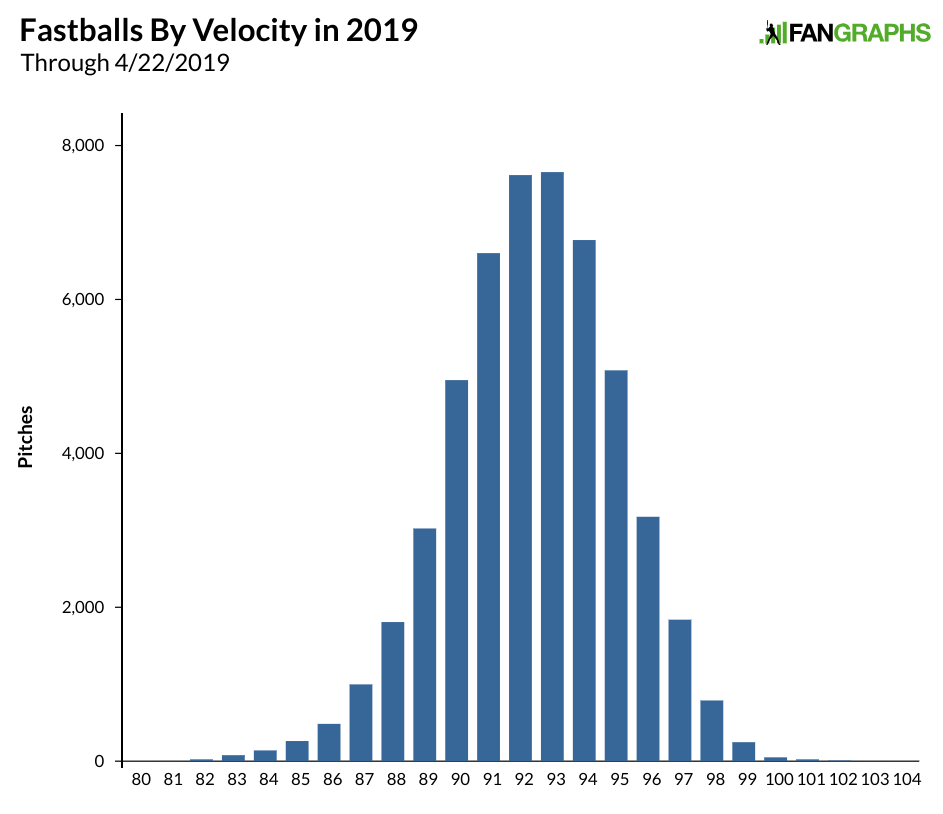
All major league pitchers throw pretty hard, and on average, fastballs are hitting close to 93 miles per hour these days. Pitchers throwing 95 seems common-place, and we regularly see pitches in the upper-90s. Pitchers throwing the ball really hard seems routine, but that should make us appreciate pitchers throwing the hardest even more. As pitch velocities get higher and higher, there are still upper limits, and the players who tend to reach those upper limits seem to find themselves alone. Right now, Jordan Hicks is alone.

The graph below represents all the fastballs thrown, except those by J.R. Murphy, this season.

It might be difficult to see the bars at 102 mph and above, so here’s a chart showing those pitches.

Fastest MLB Pitches in 2019
Player Date MPH
Jordan Hicks 4/21 104.2
Jordan Hicks 4/21 103.7
Jordan Hicks 4/21 103
Jordan Hicks 4/21 102.8
Jordan Hicks 4/21 102.4
Jordan Hicks 4/17 102.3
Jordan Hicks 4/21 102.1
Jordan Hicks 4/7 102.1
Jordan Hicks 4/17 102.1
Jordan Hicks 4/17 102
SOURCE: Baseball Savant

And to further clarify matters, here’s the average fastball velocity for pitchers with at least 10 fastballs this season.

Fastest MLB Pitchers in 2019
Player Fastballs Avg Fastball Velocity
Jordan Hicks 71 100.5 MPH
Jose Alvarado 147 98.3 MPH
Tayron Guerrero 127 98.3 MPH
Ryan Helsley 28 98.2 MPH
Felipe Vazquez 129 98.1 MPH
Diego Castillo 76 98.0 MPH
Ryne Stanek 109 97.7 MPH
Trevor Rosenthal 90 97.7 MPH
Lou Trivino 64 97.6 MPH
Noah Syndergaard 292 97.6 MPH
Robert Stock 69 97.6 MPH
Aroldis Chapman 106 97.5 MPH
SOURCE: Baseball Savant

Read the rest of this entry »


What Clayton Kershaw Still Has

As players decline, we tend to focus on what they have lost since their primes. Whether it is velocity, speed, or power, what is newly absent is typically most notable. This is particularly true for once-great, Hall of Fame-type players like Clayton Kershaw. The Dodgers’ ace is one of the greatest pitchers of all time, but the last few seasons have seen his fastball velocity dip considerably, which has negatively affected his numbers. I noted late last season that Kershaw was no longer a fastball pitcher, and instead used his slider as his dominant pitch. This spring, some focus switched to his changeup, and how Kershaw might need something new to combat what he has lost. So far this season, Kershaw has been effective by going to his strengths and using hitter tendencies to his advantage.

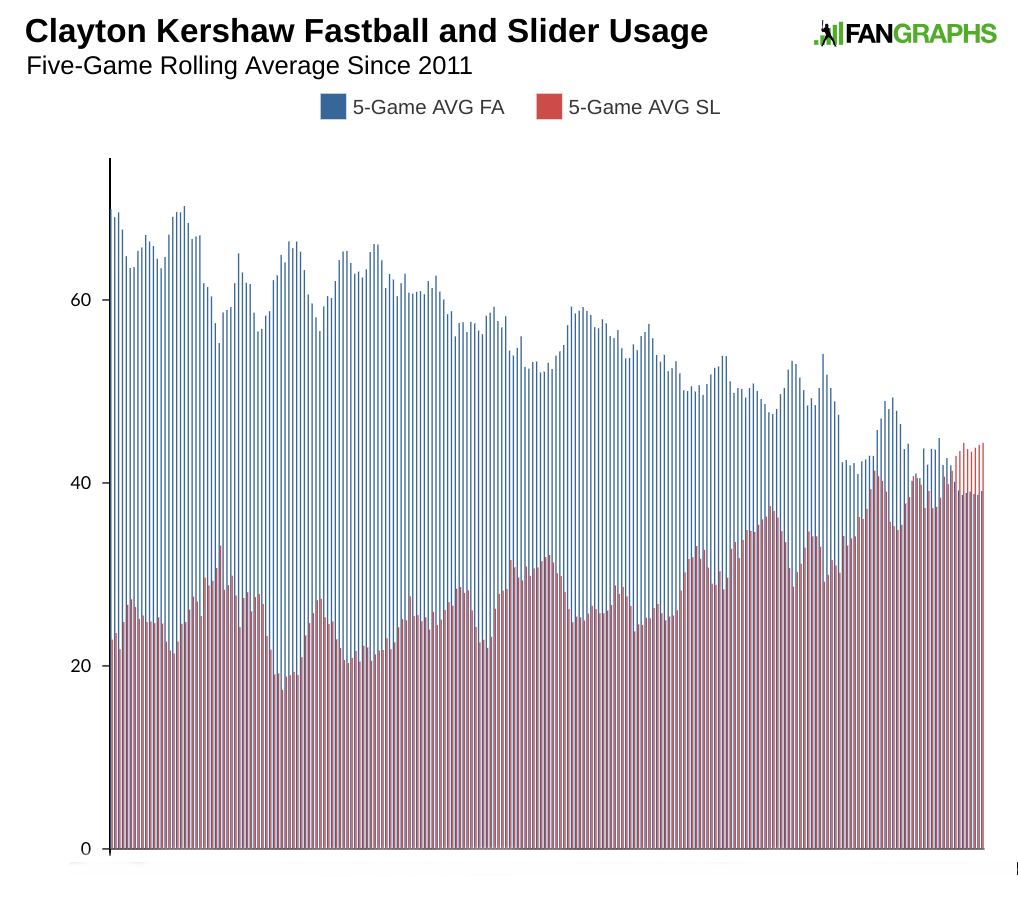
Through two starts, Clayton Kershaw has pitched 13 innings, struck out 13 batters, walked four, and given up two homers and four runs total. If we assume that Kershaw will give up homers at a slightly lesser rate but keep the same strikeout and walk numbers, he’d be one of the best 10 or 20 starting pitchers the rest of the season. While we obviously can’t say he will do that, we can look at what he’s done so far and see what has made him successful this season compared to years past. While we won’t focus on Kershaw’s fastball, we can’t escape it entirely. Here’s the graph I used last year showing how Kershaw’s slider usage overtook his fastball.

That trend has held up so far this season, with Kershaw throwing one more slider than fastball in his first two games. That fastball has averaged just over 90 mph, several ticks slower than his prime. It’s a fine fastball, but the velocity is below-average. To get batters out, Kershaw has been forced to go away from his fastball and to his offspeed offerings. This is particularly true when Kershaw is ahead. The graph below shows Kershaw’s fastball usage when ahead in the count since 2011. Read the rest of this entry »


Khris Davis Agrees to Hit .247 in Oakland Through 2021

Khris Davis really likes playing for the Oakland A’s. He’s been with the club since 2016, bashing 143 homers with a 130 wRC+ and averaging 2.5 WAR per year, with his value held down only because his best position is designated hitter. Last April, when a contract extension was being discussed, Davis said the following:

“I want to be an Oakland Athletic,” Davis said. “I think I fit in well here. I like the organization, I like the coaching staff, I like my teammates.”

Then, last July:

“I envision myself winning a championship in Oakland,” he said. “I think there’s a lot of tradition here. It’s got a rich history of championships. I feel like I could bring a championship to Oakland one day.”

In February:

“I’d like to be here. I hope something gets done,” Davis said. “It’s not a good thing being a free agent right now. For my security, it’s going to impact a lot. That’s the way the business is. I’m already 31 so I don’t know if I’m too old. There’s a lot of things that run through my head. Who knows. If it happens, it happens.”

“Shoot, I want to stay here at least three more years, but that’s a long time to be an Oakland A. But if anybody can do it, I guess it’s me, hopefully,” Davis said. “I don’t think they’ll trade me as long as we’re doing good. So we better do good so I don’t get traded.”

It appears Davis is getting his wish. Susan Slusser reported that Davis will sign an extension through 2021 that will pay him $16.75 million in both years. Davis is receiving $16.5 million in his final year of arbitration, so he gets a slight raise and another guaranteed season. Assuming he has another good year, he would have been a candidate for a qualifying offer that would likely have been around $18 million. Davis is 31 years old and as a slugging designated hitter, it’s not clear how he would have done in free agency. A low batting average, barely above-average walk numbers, and high strikeout rates kept Davis from the seasons J.D. Martinez had heading into free agency. The lack of a designated hitter in half of baseball would also serve to limit his suitors. Edwin Encarnacion averaged four wins per year for five seasons heading into free agency, though at 33 years old, he is a couple years older than Davis. Read the rest of this entry »


Jason Heyward’s Surprising New Strategy for Success Will Shock You

Jason Heyward was a very good baseball player for a very long time. From 2010-2015, his 25 WAR was one of the top 20 marks in the game and in his final two seasons before free agency, his 10 wins was 10th in all of baseball. In his one season in St. Louis, Jason Heyward was worth 5.6 WAR. In three-plus seasons for Chicago, Heyward has been worth 4.6 WAR as he approaches the midway point of his $184 million contract. To say the contract hasn’t worked out ignores that the Cubs won a World Series in his first season with the club and have won 90+ games in the two subsequent seasons. Heyward hasn’t been a good value early on, but he trended upward slightly last season, hitting at an average level and producing at a above-average level overall when factoring in baserunning and defense. This season, Heyward has been one of the better hitters in baseball in the early going thanks to an a absurd 10 walks compared to just six strikeouts as well as new secret trick: hitting the ball hard.

We probably don’t need to go through all of Heyward’s history, but the table below shows that in his final year before joining the Cubs, Heyward hit the ball relatively hard and often on the ground while with the Cubs, Heyward got the ball in the air more, but hit the ball with less authority.

Jason Heyward Exit Velocity
Team Average Exit Velocity % Rank (min. 200 BB) Average Launch Angle wRC+
2015 Cardinals 89.2 66.2% 4.6 121
2016 Cubs 86.7 25.5% 10.6 72
2017 Cubs 86.4 30.3% 10.9 88
2018 Cubs 88.1 47.0% 9.4 99
SOURCE: Baseball Savant

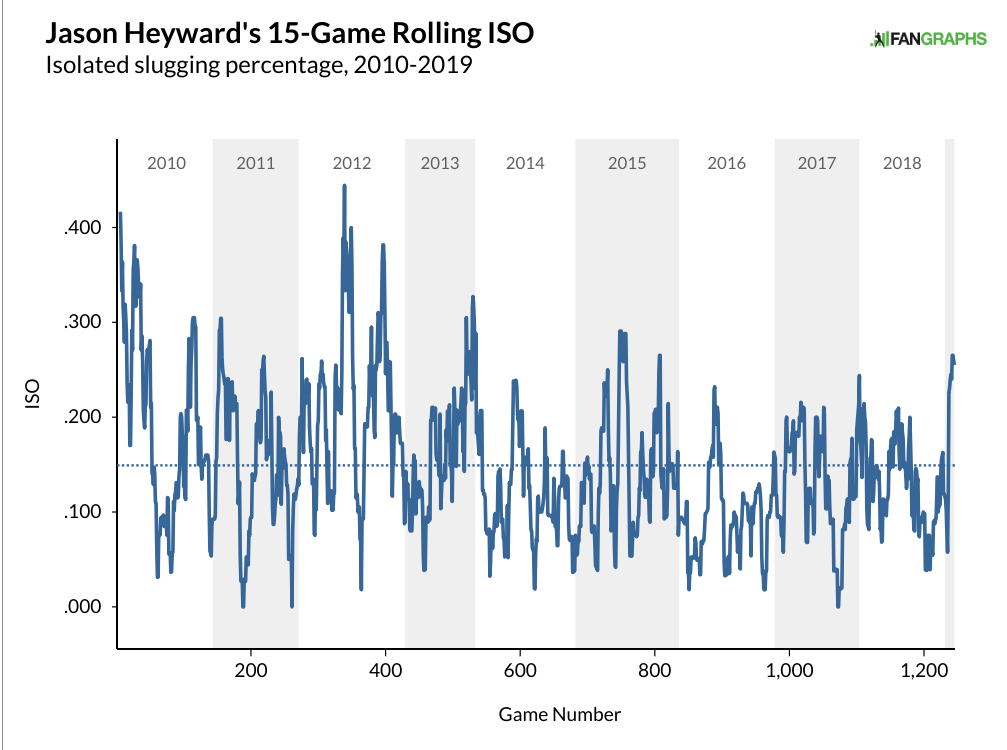
This season, Heyward is off to a great start with a 165 wRC+; his average launch angle is 18 degrees and his exit velocity thus far is 90.5 mph, per Baseball Savant. When we talked about the launch angle revolution and trying to get players who hit the ball hard on the ground to put the ball in the air more, Jason Heyward was a prime example of a player who might benefit. Heyward hit the ball pretty hard with the Cardinals, and most of the time it went on the ground. His ISO wasn’t anything superlative, but he hit the ball hard enough to make himself an above-average offensive player. Heyward did have the one year in 2012 when he hit 27 homers, but that has become an anomaly as his career has progressed. In the first 15 games this season, Heyward has a .255 ISO. Look at this 15-game rolling ISO chart and try to spot the places where Heyward has ever hit with this much power, even in a small sample.

There’s literally no 15-game period with the Cubs in which he’s hit for this much power. He had one, maybe two brief stretches with the Cardinals, he closed the 2013 season well, and had a handful of hot periods during the first three seasons of his career. Since the end of the 2013 season, a period now encompassing more than five seasons, Heyward has had a short stretch like this just a couple of times. His career ISO is .149; the league has averaged an ISO of .151 over that span. Heyward has been, at best, an average power hitter, and over the last few years, he’s been well below. That makes what he has done unusual so far. Of his five extra base hits this season, four have been homers; if a couple of those homers had been doubles, we’d be looking at something more reasonable, though Heyward’s .367 xwOBA indicates he’s still been hitting the ball well, regardless of how many balls have gone over the fence.

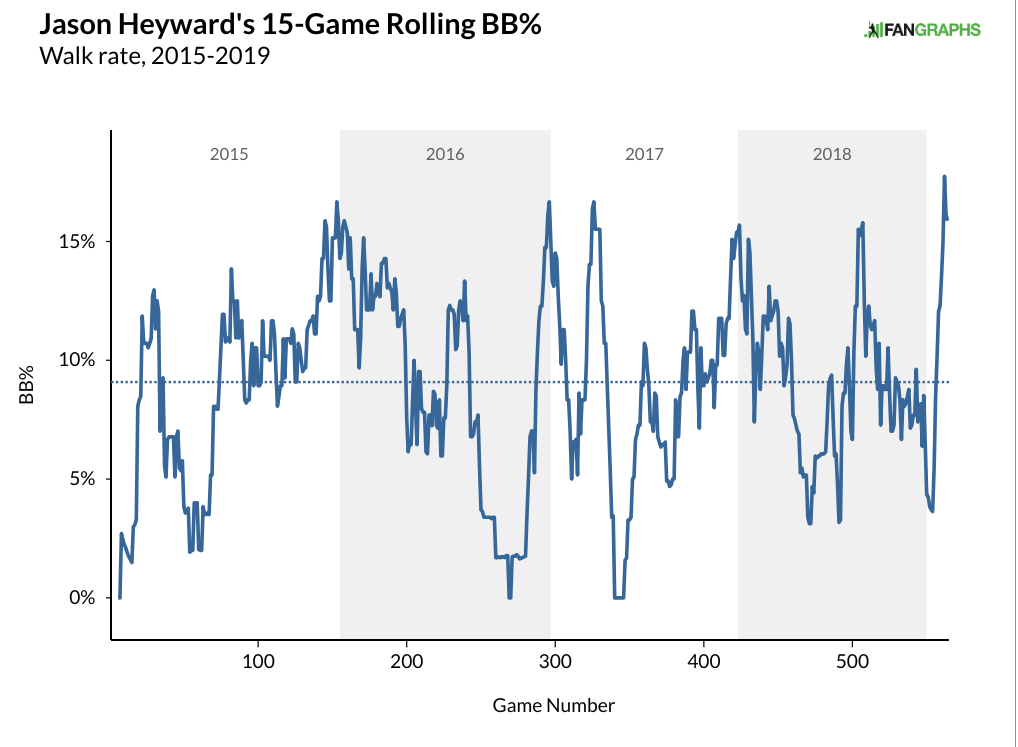
What’s even more striking than Heyward’s power output is his discipline. Heyward has walked in 10 of his 63 plate appearances and struck out just six times. He has long been a player who has walked a lot while striking out at a rate better than league average, but this walk rate is one unseen since before his 2015 in St. Louis.

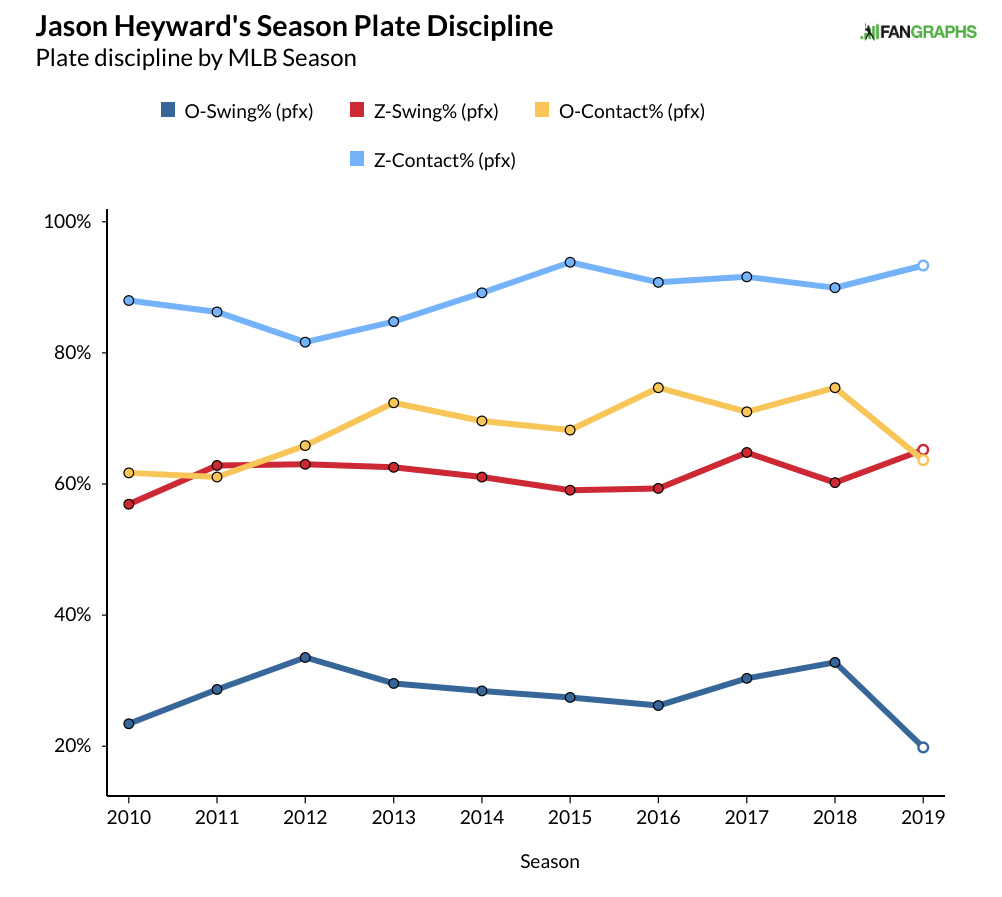
Heyward’s changes in walks and strikeouts are fueled, perhaps unsurprisingly, by swinging at fewer pitches outside the zone and more pitches in the zone.

As he has swung at more pitches in the zone, he’s making contact on more of those pitches as well. One notable part of the graph above is the contact percentage out of the zone. While Heyward has swung at considerably fewer pitches outside the strike zone, he’s missed on those swings at a higher rate. This might suggest that those pitches outside the zone aren’t pitches that are close resulting in weak contact, but rather are pitches where he is actually fooled. Given that his contact rate in the zone has gone up, it’s possible Heyward is simply swinging a bit harder, or more comfortably, at pitches he feels he can drive. That brings us back to launch angle.

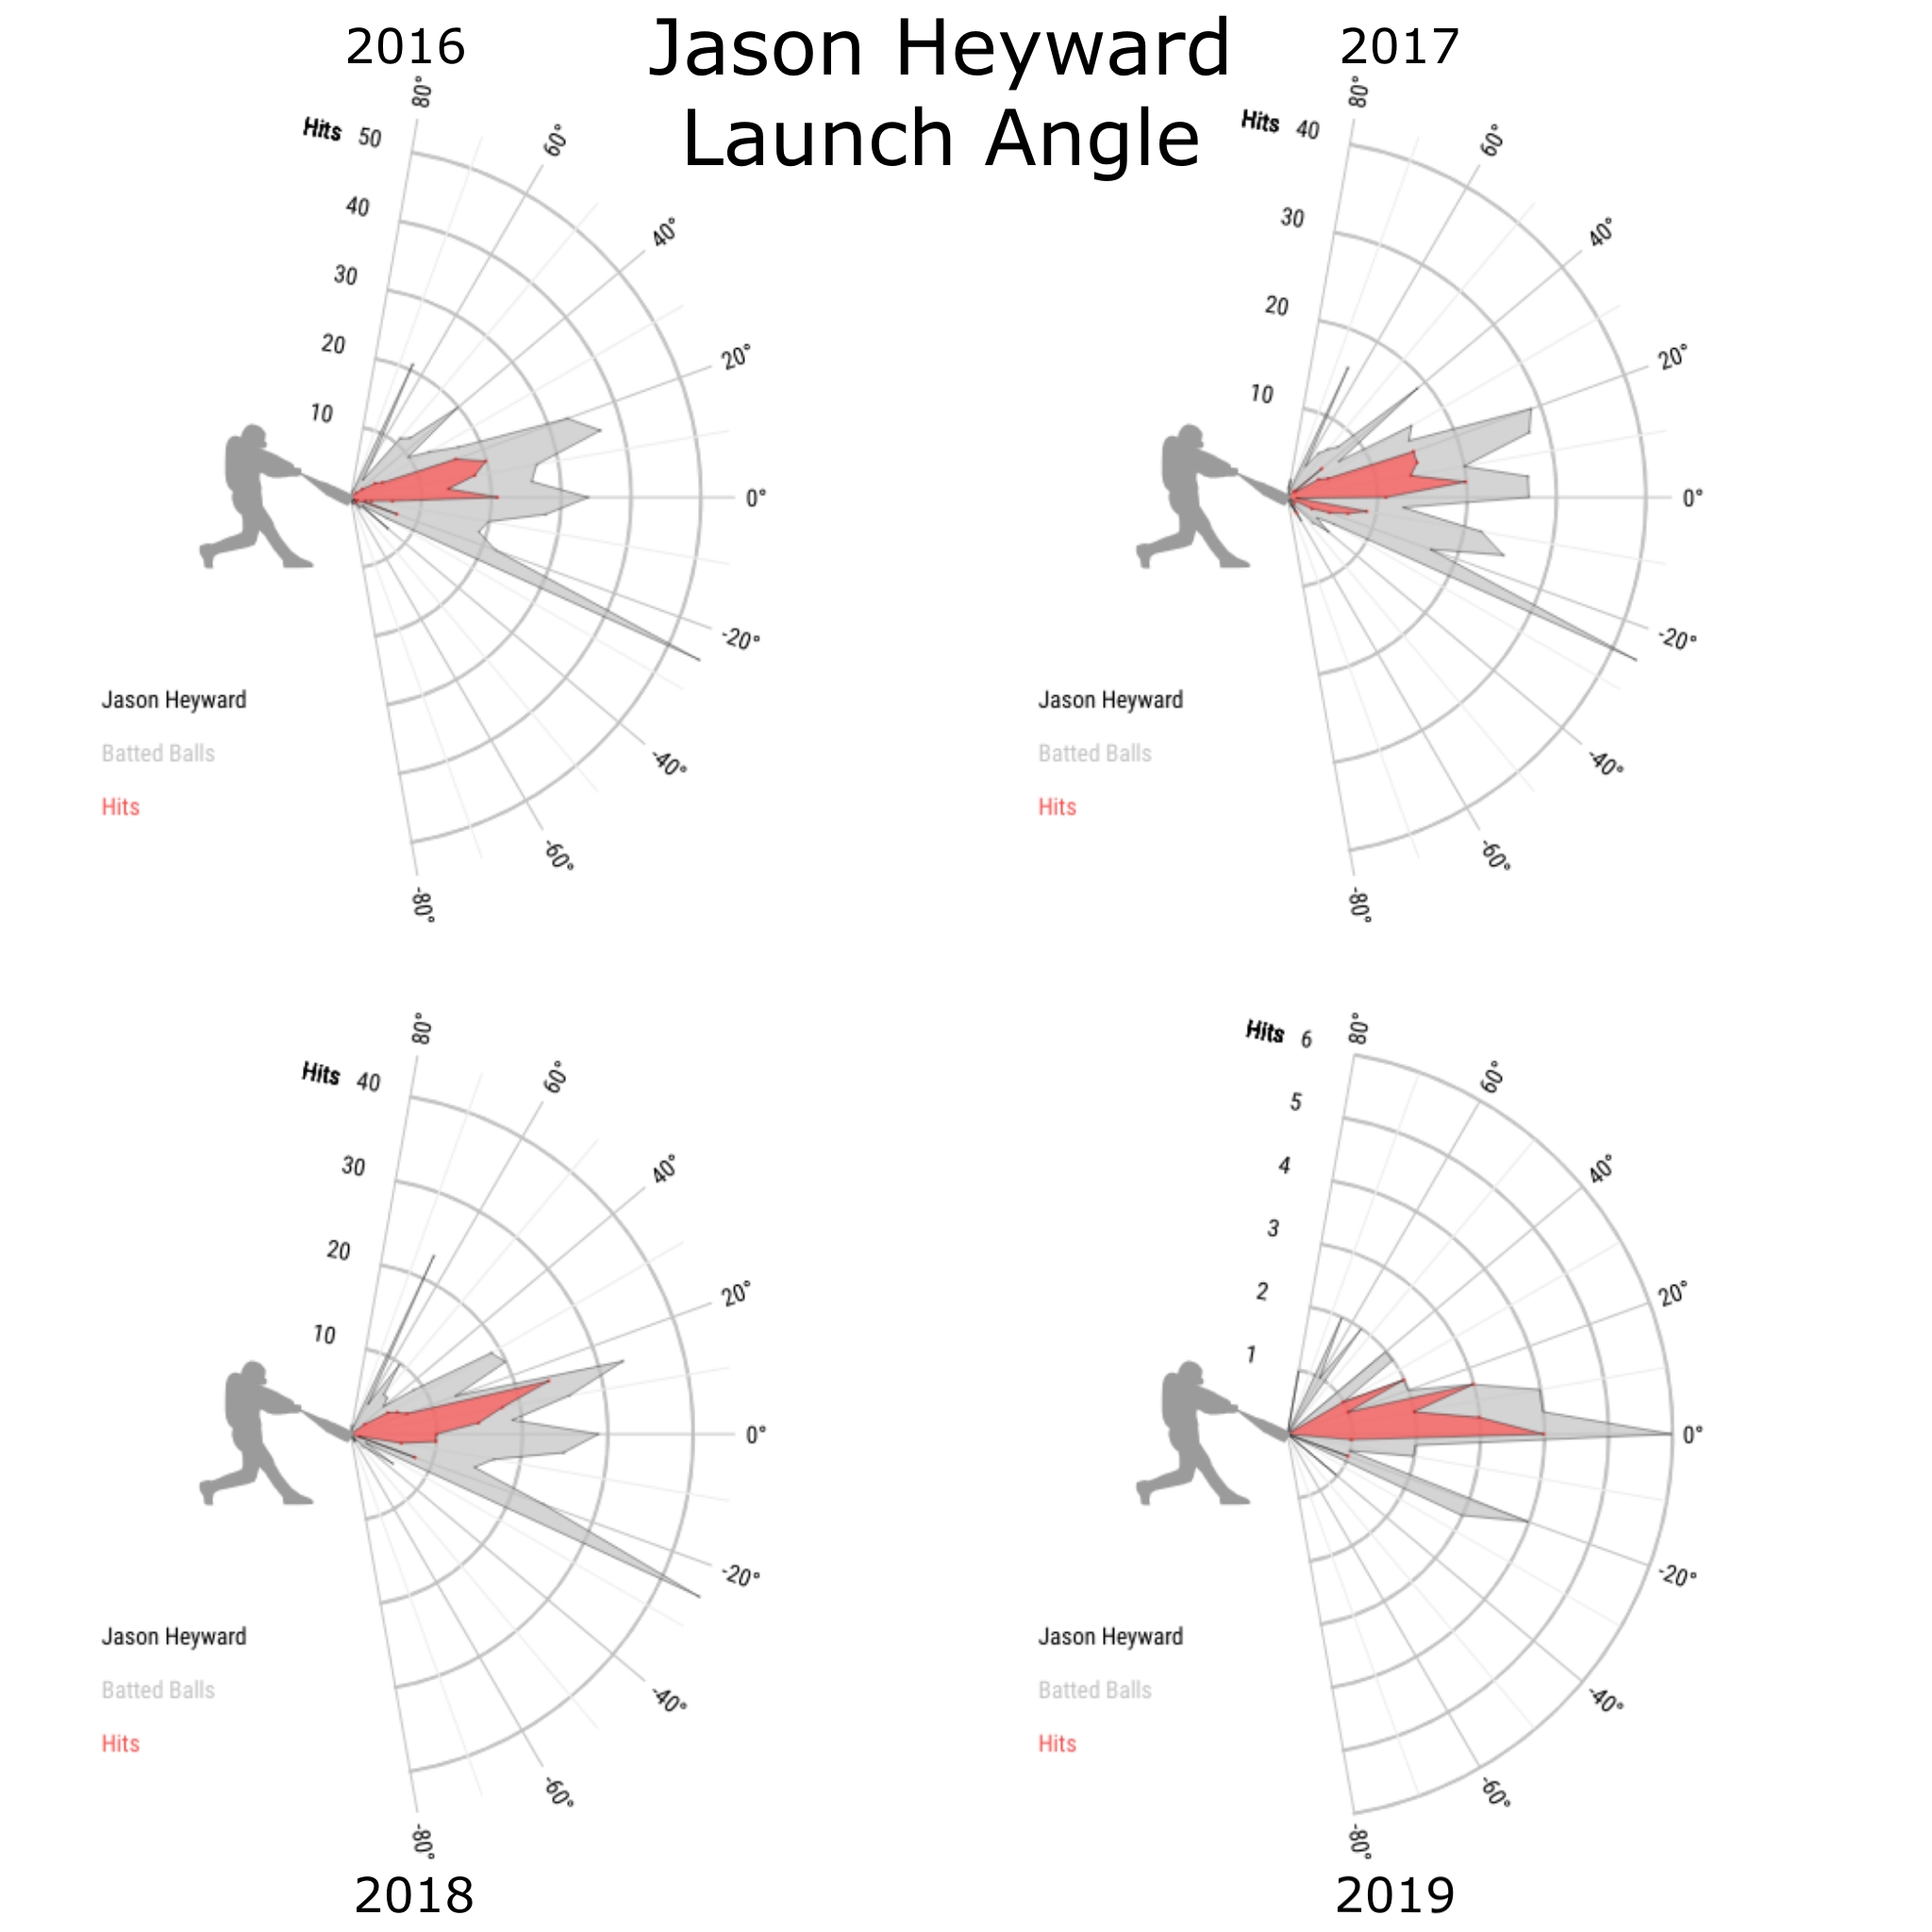
Looking purely at average launch angle can be a bit deceiving at times. As the table at the beginning of the post indicates, Heyward did a better job of getting the ball in the air, but he was a much worse hitter. Launch angle charts can help provide some insight into why. First, look at this chart from Heyward’s year in St. Louis, from Baseball Savant.

That huge needle at -25 degrees represents a ton of ground balls that resulted in basically no hits. Then we see a bunch more batted balls from negative 20 degrees though positive 25 degrees with a decent number of hits. Then we see a tiny blip at 40 degrees and another small one at around 60 degrees, basically representing infield fly balls. Heyward was successful above because he hit the ball hard. The graphs below show the Cubs years when Heyward got the ball in the air a little more, but didn’t hit it hard and got poor results.

From 2016 through 2018, there is a massive spike at negative 25 degrees and a lot more negative numbers. There are a few more balls between zero and 20 degrees compared to what we saw in 2015, but not measurably so. We then see an uptick at the higher levels when Heyward was popping balls up; his infield fly percentage was over 18% in each of the past two years, the worst in the majors among the 165 batters with at least 900 plate appearances. Exchanging a few ground balls for infield flies might be a good way to see your average launch angle rise, but it doesn’t make for a better hitter.

It is very early, but Heyward isn’t hitting as many ground balls or infield flies, instead hitting balls much more likely to land for hits or home runs. It’s possible what we are seeing is just a blip and Heyward will revert back to the average hitter he was last year, or regress further. It’s also possible that among all of Heyward’s hitting tweaks over the last decade and improved health, he’s finally found something that can turn his hard-hitting ground ball tendencies into a launch angle converted power hitter. The Cubs tried to tap into Heyward’s power when he first arrived by changing his swing, but a swing designed to turn on inside pitches plus a wrist injury just made Heyward a poor hitter. He has slowly improved the last few seasons, and he’s off to a great start this year. He’s finally hitting the ball hard, again, and if he can keep putting the ball in the air on strikes in the zone, he just might hit well enough to make opting out of his four years and $86 million a consideration instead of a complete non-starter.


Craig Edwards FanGraphs Chat–4/18/2019

Read the rest of this entry »


Yoan Moncada is Different

There are varying tactics when it comes to approaches at the plate. Getting ahead and waiting for the right pitch is one. Swinging at the first good pitch you see because you might not get another is a second. Protecting the plate when behind in the count comes up often. Hitters use some or all of that when they step up to bat, but Yoan Moncada’s patience last season ended up hurting what could have been a much better season. A more aggressive approach thus far has shown much better results this year as Moncada attempts to take the next step in his development.

Last season, Moncada has a walk rate of 10.3%, which is good, and a strikeout rate of 33.4%, which is bad. The only players at 23 years of age or younger to put up double-digit walk rates and a strikeout rate above 30% (which is going to limit how far back we go given the massive rise in strikeouts) are Kris Bryant (2015) and Joey Gallo (2017). Gallo hit 41 homers to make himself an offensively valuable player. Bryant was constantly making great contact when he did put the ball in play on his way to a Rookie of the Year campaign. Moncada hit the ball hard when he made contact, but not at the same level as Bryant, and ended with a 97 wRC+ on the year. Changes are necessary to improve on that mark, and it looks like Moncada may indeed be making them.

Last week at MLB.com, Mike Petriello also wrote about Moncada, noting just how terrible he was on two-strike pitches, notably pitches on the edge, which caused an absurdly high number of called third strikes.

That made the problem easy to diagnose, if not easy to solve. Don’t get to two strikes. But also, don’t get to two strikes being so desperate that you start expanding your zone and flailing at bad pitches.

We know this, because Moncada and the Sox spent a lot of time talking about it.

“As long as he maintains an aggressive approach within the strike zone, which he has been increasing,” Chicago manager Rick Renteria said to MLB.com in July, “he has a chance of having really good success obviously.”

“We made a plan,” Moncada said to MLB.com in December, referring to extensive offseason work with White Sox coaches. “Right now, I am in a better position to succeed and to be a better player next season. It was a very good experience, overall.”

“We ended up attacking the topic of his strike-zone approach,” Renteria said. “He has great ability to take pitches. That’s something that’s innate in him.”

Petriello noted that Moncada was being a bit more aggressive, particularly with the zone, and he was hitting the ball harder and striking out less, all good outcomes. Moncada has lowered his strikeout rate to 24% on the season, and while that might not necessarily represent a new skill level, even after 66 plate appearances it is enough to change our expectations considering last year’s 33% mark. Moncada’s walks have gone down to about 6%, but he is tearing the cover off the ball with a .242 ISO and a .395 BABIP, which has helped lead to a 152 wRC+. The decrease in walks isn’t great for Moncada, but the lowered strikeouts more than make up for that. Consider that when Moncada put the ball in play last season, he put up a 175 wRC+, one of the top 30 marks in the game. This year, he’s putting up a 227 wRC+ when he puts the ball in play, but he doesn’t need that to keep up to make a different to his overall line as we know that BABIP is going to come down some even if we reasonably expect him to post a high value. Read the rest of this entry »


Here’s Why the Ozzie Albies Deal Was Terrible

Dan Szymborski has already laid out why Ozzie Albies’ recent extension with the Atlanta Braves is surprising, and a bargain for the team. He detailed the hundreds of millions of dollars Albies is potentially giving up by signing this contract. This post deals less with Albies’ future and more with his past. We can speculate on what Albies might do in his career and what he might be worth, but we don’t need to speculate about what he’s already done and what other players in similar situations have received in contract extensions.

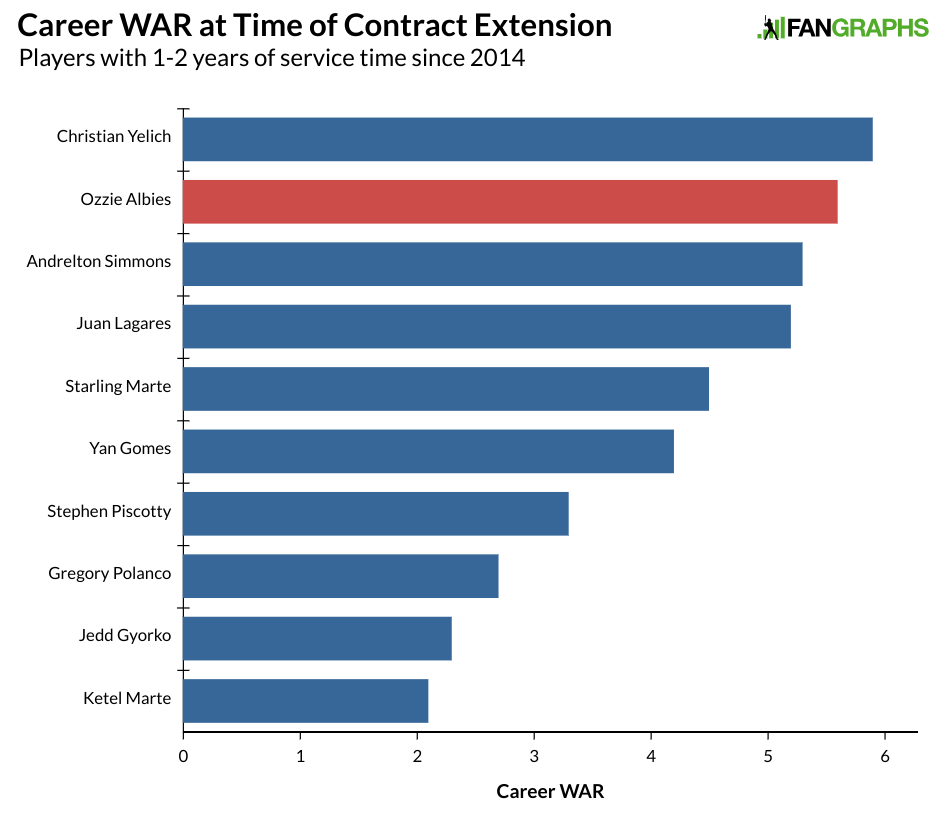
Since 2014, nine players have signed contract extensions after accruing at least one year of service time and less than two. These were all players needing five full seasons to reach free agency, and each signed away at least one year of free agency based on a search of MLB Trade Rumors. Here’s the career WAR of each of those players when they signed that contract.

Albies compares favorably to the two best players on this list, Christian Yelich and Andrelton Simmons.

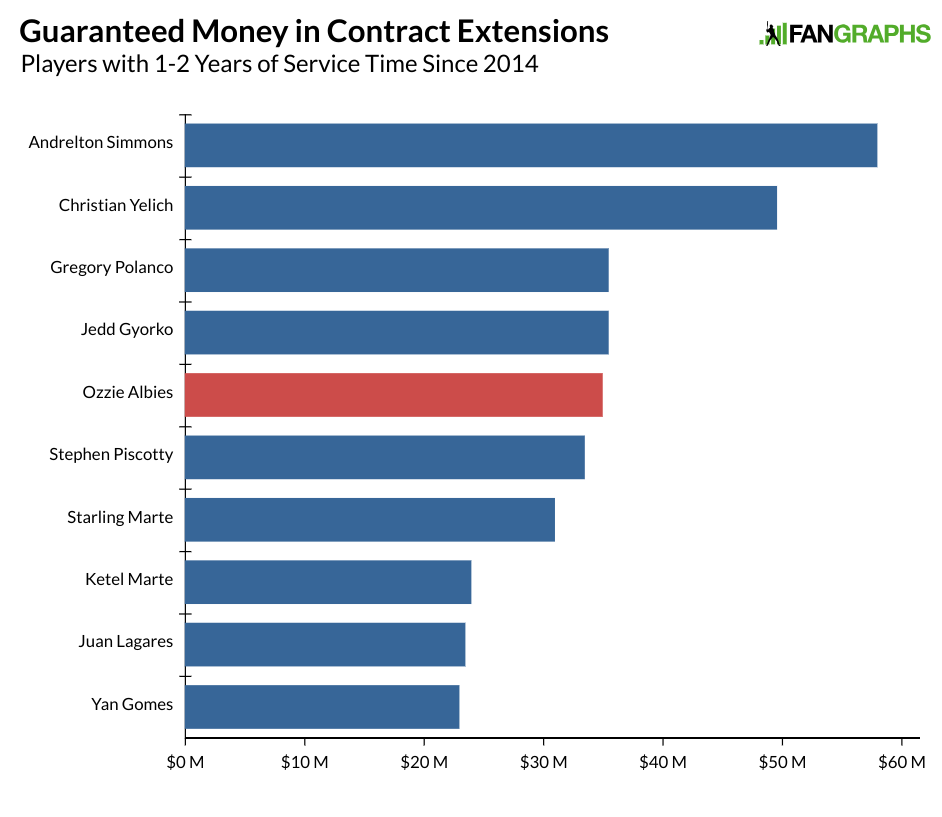
Now, here’s how each of these players did on their guarantees.

Yelich and Simmons got over $50 million each, but their guarantees were about 50% higher than the one Albies just got.

Generally, teams pay extra for free agent years. Here’s how many free agent seasons the above guarantees bought out. Read the rest of this entry »


Craig Edwards FanGraphs Chat–4/11/2019

Read the rest of this entry »


We Asked You What Mike Trout Should Make and You Told Us

This offseason, a narrative emerged surrounding the big contract extensions we saw signed that, after a couple of slow winters, players are afraid of free agency. That narrative is not without support. First, we have the presence of all of the extensions to star-level players, which indicate that players are at least willing to forego free agency and sign long-term deals. Mike Trout, after signing his extension, told Business Insider that, “People want to stay away from free agency.” That seems like a pretty clear indicator that players have trepidations about entering the market, presumably worried that the riches once there for them are no longer available. But while I wouldn’t want to be accused of doubting Mike Trout, not all extensions are created equal, and many of the extensions we saw signed this winter were for players for whom the free agency picture was still likely rosy.

When we talk about contract extensions as an indicator of a new reluctance to participate in free agency, it’s important to distinguish between players in different phases of their careers. Deals made by players like Aaron Nola, Blake Snell, Luis Severino, Alex Bregman, or Ronald Acuna, Jr., are quite different than those for players like Trout or Chris Sale or even Nolan Arenado. Players in Acuna and Bregman’s cohort were all three or more years from free agency. If we can make assumptions about their state of mind, they seem less likely to worry about what happens when they get to free agency, though that is no doubt still a concern, and more concerned about getting there in the first place, worrying about succumbing to injury or ineffectiveness before they’re able to sign a big deal.

The chilliness of today’s market, and concerns over service time manipulation delaying free agency further, may have exacerbated those concerns, but MLB owners have been capitalizing on those fears for more than a decade. The extension that buys out arbitration and free agency years is not a new phenomena. These players present a related but importantly different case from the Trouts and Sales, who, prior to their extensions, faced free agency much sooner, while the current collective bargaining agreement is still in effect. Indeed, 10 of the big contracts agreed to this winter were for players within one or two years of free agency, making them less likely to worry about reaching free agency and more concerned about the state of the market when they get there. That is the population I’m interested in exploring today.

Seven recent contract extensions went to players who would have been free agents at the end of this season, with another three deals going to players who would have been free agents after the 2020 campaign. We generally see contract extensions as team-friendly deals motivated by owners wishing to provide a guarantee now in exchange for cheaper free agent years later. That reasoning is less clear when players are so close to hitting the market. If free agency was working poorly for those players who signed contract extensions one season early, then the players should be taking a discount now on what would be expected of them had they waited. To help uncover potential motivations from both the players and the owners, we need to attempt to determine the size of the discount the players took. To make such an attempt, I enlisted the readers of FanGraphs.

I asked our readers two questions. First, I asked them to gauge the contract the players would have received if they were free agents right now. Second, I asked them what those players’ expected contracts would have been had they reached free agency. There are some problems with attempting to crowdsource this way, the main one being that we already know what type of extension the players actually signed. That can have an anchoring effect. Another issue is that we know considerably less about potential market factors and player performance now compared to when free agent contracts are typically crowdsourced. Despite these issues, inviting readers, who do a pretty good job estimating contracts in the offseason, should shed some light on potential fear on the part of players.

First, here are the results of the crowd when it comes to the 10 players who signed extensions, as well as a bonus player who might.

Contract Extension Crowdsourcing Results
Today-Years Today-Total AAV After 2019/2020 Years After 2019/2020 Value AAV
Mike Trout 12.8 $492.9 M $38.5 M 11.3 $441.2 M $39.0 M
Nolan Arenado 9.1 $276.2 M $30.4 M 8.2 $249.6 M $30.4 M
Anthony Rendon 7.4 $199.4 M $26.9 M 6.7 $181.6 M $27.1 M
Jacob deGrom 6.2 $191 M $30.8 M 5.1 $158 M $31.0 M
Chris Sale 6.3 $189.8 M $30.1 M 5.3 $157 M $29.6 M
Xander Bogaerts 7.5 $176.1 M $23.5 M 7 $163.5 M $23.4 M
Paul Goldschmidt 5.5 $148.8 M $27.1 M 4.7 $126 M $26.8 M
Justin Verlander 3.1 $89 M $28.7 M 2.4 $68.9 M $28.7 M
Aaron Hicks 4.9 $84 M $17.1 M 4.4 $73.4 M $16.7 M
Kyle Hendricks 4.2 $72.9 M $17.4 M 3.5 $57.8 M $16.5 M
Miles Mikolas 4 $69.6 M $17.4 M 3.7 $61.9 M $16.7 M
Orange=Would be Free Agent after 2020. All others after 2019.

For the most part, these figures look pretty reasonable. It’s interesting to compare similar players like Chris Sale and Jacob deGrom, as well as Kyle Hendricks and Miles Mikolas. The crowd favored Hendricks slightly at present, but when factoring in the distance from free agency, we see a slight reversal. That makes sense. We don’t see the same scenario with Sale and deGrom, and it seems possible that Sale’s early struggles might have entered into the crowd’s thinking as he saw the biggest percentage drop off of the players just one year to free agency outside of Verlander, whose proximity to retirement limits the number of years he would receive. It also seems like Anthony Rendon might be a tad underrated, or at least the crowd expects him to receive much less than Arenado, despite similar profiles.

Likely more interesting is how the players’ actual deals compared to the crowdsourced estimates. First, the players just one year from free agency.

Contract Extension Crowdsourcing Results
After 2019 Crowd Actual After 2019 Contract Opt-Out Discount Discount with Opt-Out
Nolan Arenado $249.6 M $244 M Yes 2.2% -3.8%
Chris Sale $157 M $145 M Yes 7.6% -1.9%
Xander Bogaerts $163.5 M $120 M Yes 26.6% 17.4%
Paul Goldschmidt $126 M $130 M No -3.2% -3.2%
Justin Verlander $68.9 M $66 M No 4.2% 4.2%
Aaron Hicks $73.4 M $70 M No 4.6% 4.6%
Miles Mikolas $61.9 M $68 M No -9.9% -9.9%
TOTAL $900.3 M $843 M 6.4% 1.4%
Opt-out generically estimated at $15 M.

While anchoring to the already-known extension is certainly a factor, the seven potential free agents above basically signed for their expected free agent totals. We could argue a little about how much opt-outs are worth, but it certainly seems as though teams have received little to no discount for signing free agents. As to the crowd’s accuracy, we clearly can’t reproduce the exact same sample used in the offseason, but generally speaking, the crowd has come pretty close to forecasting the big contracts over the past five seasons, undershooting the totals by less than 10% overall.

Now, here are the three extensions signed by player who would have been eligible for free agency after the 2020 season.

Contract Extension Crowdsourcing Results
After 2020 Crowd Actual After 2020 Contract Opt-Out Discount Discount with Opt-Out
Mike Trout $441.2 $360 No 18.4% 18.4%
Jacob deGrom $158 $97.5 Yes 38.3% 28.8%
Kyle Hendricks $57.8 $43.5 No 24.7% 24.7%
TOTAL $219 $167 23.7% 16.9%
Opt-out generically estimated at $15 M.

Players two years from free agency had to take a significant discount to get their deals done. That makes sense because there is more risk for the team making the guarantee and more risk for the player to wait two years. In the case of deGrom and Hendricks, that is even more true because their 2020 contracts weren’t guaranteed as they would have been in their final year of arbitration. We see potential bargains in the last group, but the group of pending free agents above is lacking in that regard. Maybe Arenado, Sale, and Bogaerts could’ve gotten more in free agency, but all three have opt-outs that will prevent any real steals by their teams. Goldschmidt and Verlander are older, while Hicks and Mikolas don’t have long track records.

I know I’ve brought up the potential of anchoring distorting these contracts a few times, but keep in mind that the narrative that players have trepidations about free agency and are therefore taking contracts at a discount due to that fear is also prevalent. We could be seeing a general lowering of expectations for free agent contracts, but we just saw two $300 million contracts handed out plus another $140 million to Patrick Corbin. Most of the players above are closer to Machado, Harper, and Corbin compared to others who have struggled to get their desired deals.

When we see players avoiding free agency, concluding that players are afraid of the open market strikes a cord because it ties in well with recent slow free agent periods and owners generally having the upper hand over players financially. It’s not clear that these particular examples, especially the pending free agents, are a symptom of a potential larger problem. What seems to be the case is that teams have an enormous amount of money to spend and they are offering what are pretty close to free agent prices to players at the top of the market. For the players’ side, free agency is designed to get veterans large amounts of money. These contract extensions are very much a favorable outcome in service of that goal. Players get their free agent money without putting themselves at risk for another season. Could they have gotten more by hitting free agency next winter? That’s certainly possible, but the most likely scenario for most of these players is playing out the season and getting a contract very similar to the one that was already offered by their current team.

This study doesn’t address the players who have yet to see a big contract and sign away multiple free agent seasons because it takes 6-7 years just to get to free agency. It also doesn’t address the many players in the league’s middle-class who get to free agency only to fail to find desirable contracts after having their salaries capped for more than half a decade. There are certainly issues with free agency, minimum salaries, the arbitration system, the split of revenue between owners and players, and the CBA as a whole. Those concerns will no doubt drive the next CBA negotiation. But when looking at the holes in free agency, this study would seem to suggest that the big-money extensions for pending free agents is not the void you’re looking for.

The Cardinals Really Like Matt Carpenter

Heading into this season, Matt Carpenter was in the final guaranteed year of a $52 million contract with a $18.5 million 2020 option that he signed back in 2014. Yesterday, Carpenter and the Cardinals agreed to an extension that will guarantee that option year, which was already very likely to be picked up, and add an additional year at the same price along with a vesting option for 2022 with a $2 million buyout. Derrick Goold first reported the parties had apparently reached an agreement ahead of a mystery press conference, and later confirmed with contract details.

For the Cardinals this isn’t exactly an extension the team needed to do, but the club has operated similarly in the past when it comes to players they really like, handing out a three-year extension to Yadier Molina in 2017 a year before he would’ve been free-agent eligible and giving Paul Goldschmidt a $130 million deal this spring. Given that Carpenter was still two years away from free agency, and will be 35 years old in 2021, it’s fair to say the Cardinals really want to keep the third baseman around. As for why the club might reward him for past performance, Carpenter’s track record speaks for itself. Since becoming a full-time player in 2013, here’s where Carpenter ranks among all position players by WAR.

WAR Leaders Since the Start of 2013
Name PA HR OBP SLG wRC+ WAR
1 Mike Trout 3948 210 .426 .586 177 55.4
2 Josh Donaldson 3535 172 .375 .516 145 35.6
3 Buster Posey 3489 87 .372 .449 127 35.2
4 Paul Goldschmidt 3994 187 .406 .542 149 33.1
5 Mookie Betts 2976 113 .369 .518 134 30.8
6 Jose Altuve 4098 91 .373 .468 132 29.9
7 Manny Machado 3922 170 .338 .488 121 29.4
8 Freddie Freeman 3782 145 .392 .515 144 29
9 Joey Votto 3739 137 .436 .509 154 29
10 Andrew McCutchen 4060 143 .380 .478 136 28.9
11 Matt Carpenter 4006 128 .378 .471 133 27.2
12 Giancarlo Stanton 3342 212 .362 .544 143 27.1
13 Bryce Harper 3405 166 .397 .522 144 26.9
14 Christian Yelich 3519 100 .376 .468 131 26.7
15 Anthony Rendon 3326 106 .362 .475 124 26.7
16 Robinson Cano 3776 136 .358 .479 130 26.6
17 Lorenzo Cain 3300 60 .355 .423 112 25.2
18 Nolan Arenado 3746 186 .346 .537 117 25.1
19 Adrian Beltre 3433 131 .360 .490 125 24.7
20 Anthony Rizzo 4086 177 .375 .495 134 24.3

Carpenter has been one of the best players in the game over the last six-plus seasons, likely bettering some players who are more highly regarded. Removing some of those early seasons pushes Carpenter further down the list, but never out of the top-40. Last season, Carpenter caught fire midway through the season and ended with a five-win campaign that ranked 19th among position players. This season, his 4.1 projected WAR according to ZiPS is the 25th-best among position players. At his $14.5 million salary this season, that production is a bargain. Carpenter has moved all over the infield in his career, amassing more than 200 games at second, first, and third base. The majority of his starts have come at third, where he plays now, but prior defensive concerns pushed him to first base in previous seasons.

With the addition of Goldschmidt, Carpenter moved back to third. His reputation there is probably worse than his performance. His clunky throwing motion doesn’t inspire confidence, but over the course of his career, he’s been just slightly below average at the hot corner. At 33 years old, Carpenter isn’t likely to get better in the field, and with Goldschmidt with the club through 2024, Carpenter is going to have to make third work absent the designated hitter coming to the National League.

As opposed to solely being a reward for past play, expectations are still decent for Carpenter going forward. We now have three-year ZiPS on FanGraphs player and projections pages, and Carpenter’s forecast a productive player over the next three seasons.

Matt Carpenter Three-Year ZiPS Projections
Season Age PA HR OBP SLG wOBA WAR
2019 33 597 26 .371 .484 .363 4.1
2020 34 562 22 .362 .464 .352 3.3
2021 35 527 19 .354 .447 .343 2.6

The Cardinals certainly could have waited to see if Carpenter reaches the four-win mark before picking up his option, and then for a good three-win season in 2020 before trying to sign him in free agency. If Carpenter did put up those projected seasons, he might have gotten two more years at a salary similar to what Michael Brantley received in free agency this season. The Cardinals remove that option by guaranteeing an extra $20.5 million. If Carpenter still performs well in 2021, the team can bring him back for one more year at the same salary; Carpenter can make 2022 vest by reaching 1100 plate appearances in 2020 and 2021 as well as 550 plate appearances in 2021. Those aren’t easy milestones for Carpenter to reach, but if he does, he will likely still be playing at a high level.

In terms of justifying this new contract for the Cardinals, we don’t need to do too much of a deep dive. The team is only guaranteeing one extra year beyond his previous 2020 option, and even if Carpenter falls off a cliff in the next two seasons, a salary under $20 million isn’t going to break the bank. One thing this contract does do for St. Louis is help them avoid free agency, both with Carpenter and with other potential options at third base, and builds a bridge to last year’s first round draft pick, Nolan Gorman. Still 18 years old, but already performing well in Low-A, an extra year of Carpenter could build a bridge to Gorman as he advances through the minors. A lot has to happen on Gorman’s end to make that plan work, but it certainly has to be in the back of the Cardinals’ minds as they made this deal with Carpenter.

As for free agency generally, it would be fair to say that the Cardinals haven’t been particularly good at it in the last half-decade. Deals for Mike Leake, Dexter Fowler, and a parade of relievers haven’t worked out as planned while the team has missed on their larger targets. Since watching Albert Pujols leave, the Cardinals have avoided free agency with Adam Wainwright and Yadier Molina (twice), and recently with Miles Mikolas and Paul Goldschmidt while signing Matt Carpenter, Carlos Martinez, Paul DeJong, and Kolten Wong to extensions long before they reached free agency. The Cardinals can attribute a lot of their success and sustained contention to the work they’ve done to avoid free agency, while their failures to reach 90 wins the last three seasons can be traced to their deficiencies in free agency. This deal fits in with the Cardinals preferred mode of operation, though it changes little for their long term future.