What Clayton Kershaw Still Has
As players decline, we tend to focus on what they have lost since their primes. Whether it is velocity, speed, or power, what is newly absent is typically most notable. This is particularly true for once-great, Hall of Fame-type players like Clayton Kershaw. The Dodgers’ ace is one of the greatest pitchers of all time, but the last few seasons have seen his fastball velocity dip considerably, which has negatively affected his numbers. I noted late last season that Kershaw was no longer a fastball pitcher, and instead used his slider as his dominant pitch. This spring, some focus switched to his changeup, and how Kershaw might need something new to combat what he has lost. So far this season, Kershaw has been effective by going to his strengths and using hitter tendencies to his advantage.
Through two starts, Clayton Kershaw has pitched 13 innings, struck out 13 batters, walked four, and given up two homers and four runs total. If we assume that Kershaw will give up homers at a slightly lesser rate but keep the same strikeout and walk numbers, he’d be one of the best 10 or 20 starting pitchers the rest of the season. While we obviously can’t say he will do that, we can look at what he’s done so far and see what has made him successful this season compared to years past. While we won’t focus on Kershaw’s fastball, we can’t escape it entirely. Here’s the graph I used last year showing how Kershaw’s slider usage overtook his fastball.
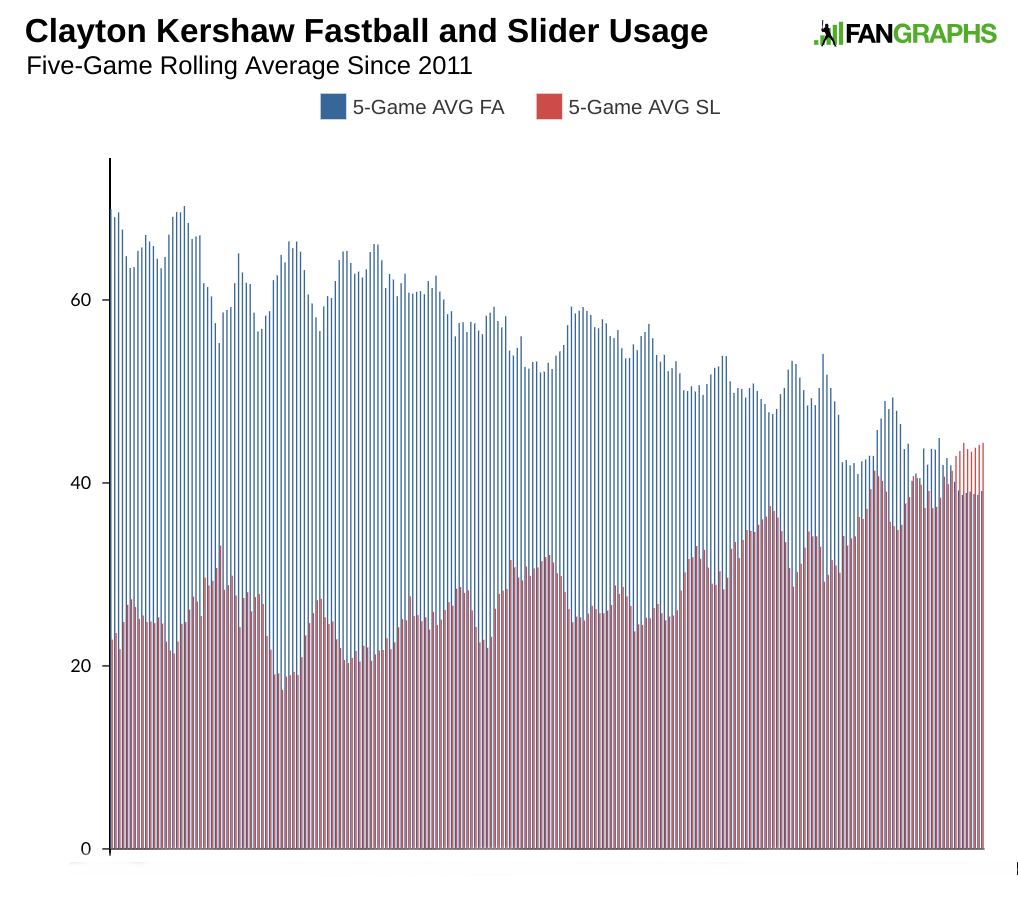
That trend has held up so far this season, with Kershaw throwing one more slider than fastball in his first two games. That fastball has averaged just over 90 mph, several ticks slower than his prime. It’s a fine fastball, but the velocity is below-average. To get batters out, Kershaw has been forced to go away from his fastball and to his offspeed offerings. This is particularly true when Kershaw is ahead. The graph below shows Kershaw’s fastball usage when ahead in the count since 2011.
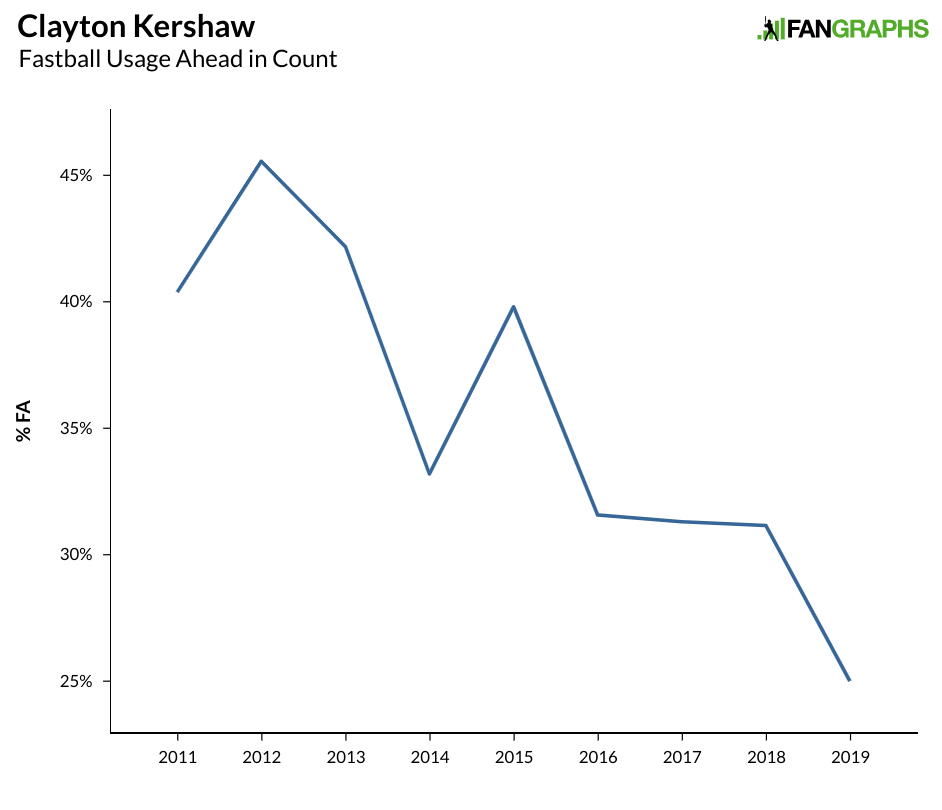
Kershaw has more frequently gone to either his curve or slider when ahead in the count over the past few years, and in the small sample we have this season, that has been particularly true. It’s not just that Kershaw is using his curve and slider to put hitters away more often — it is where he is throwing his pitches. The graphs below show where Kershaw has been throwing his curve and slider when ahead in the count since 2011.
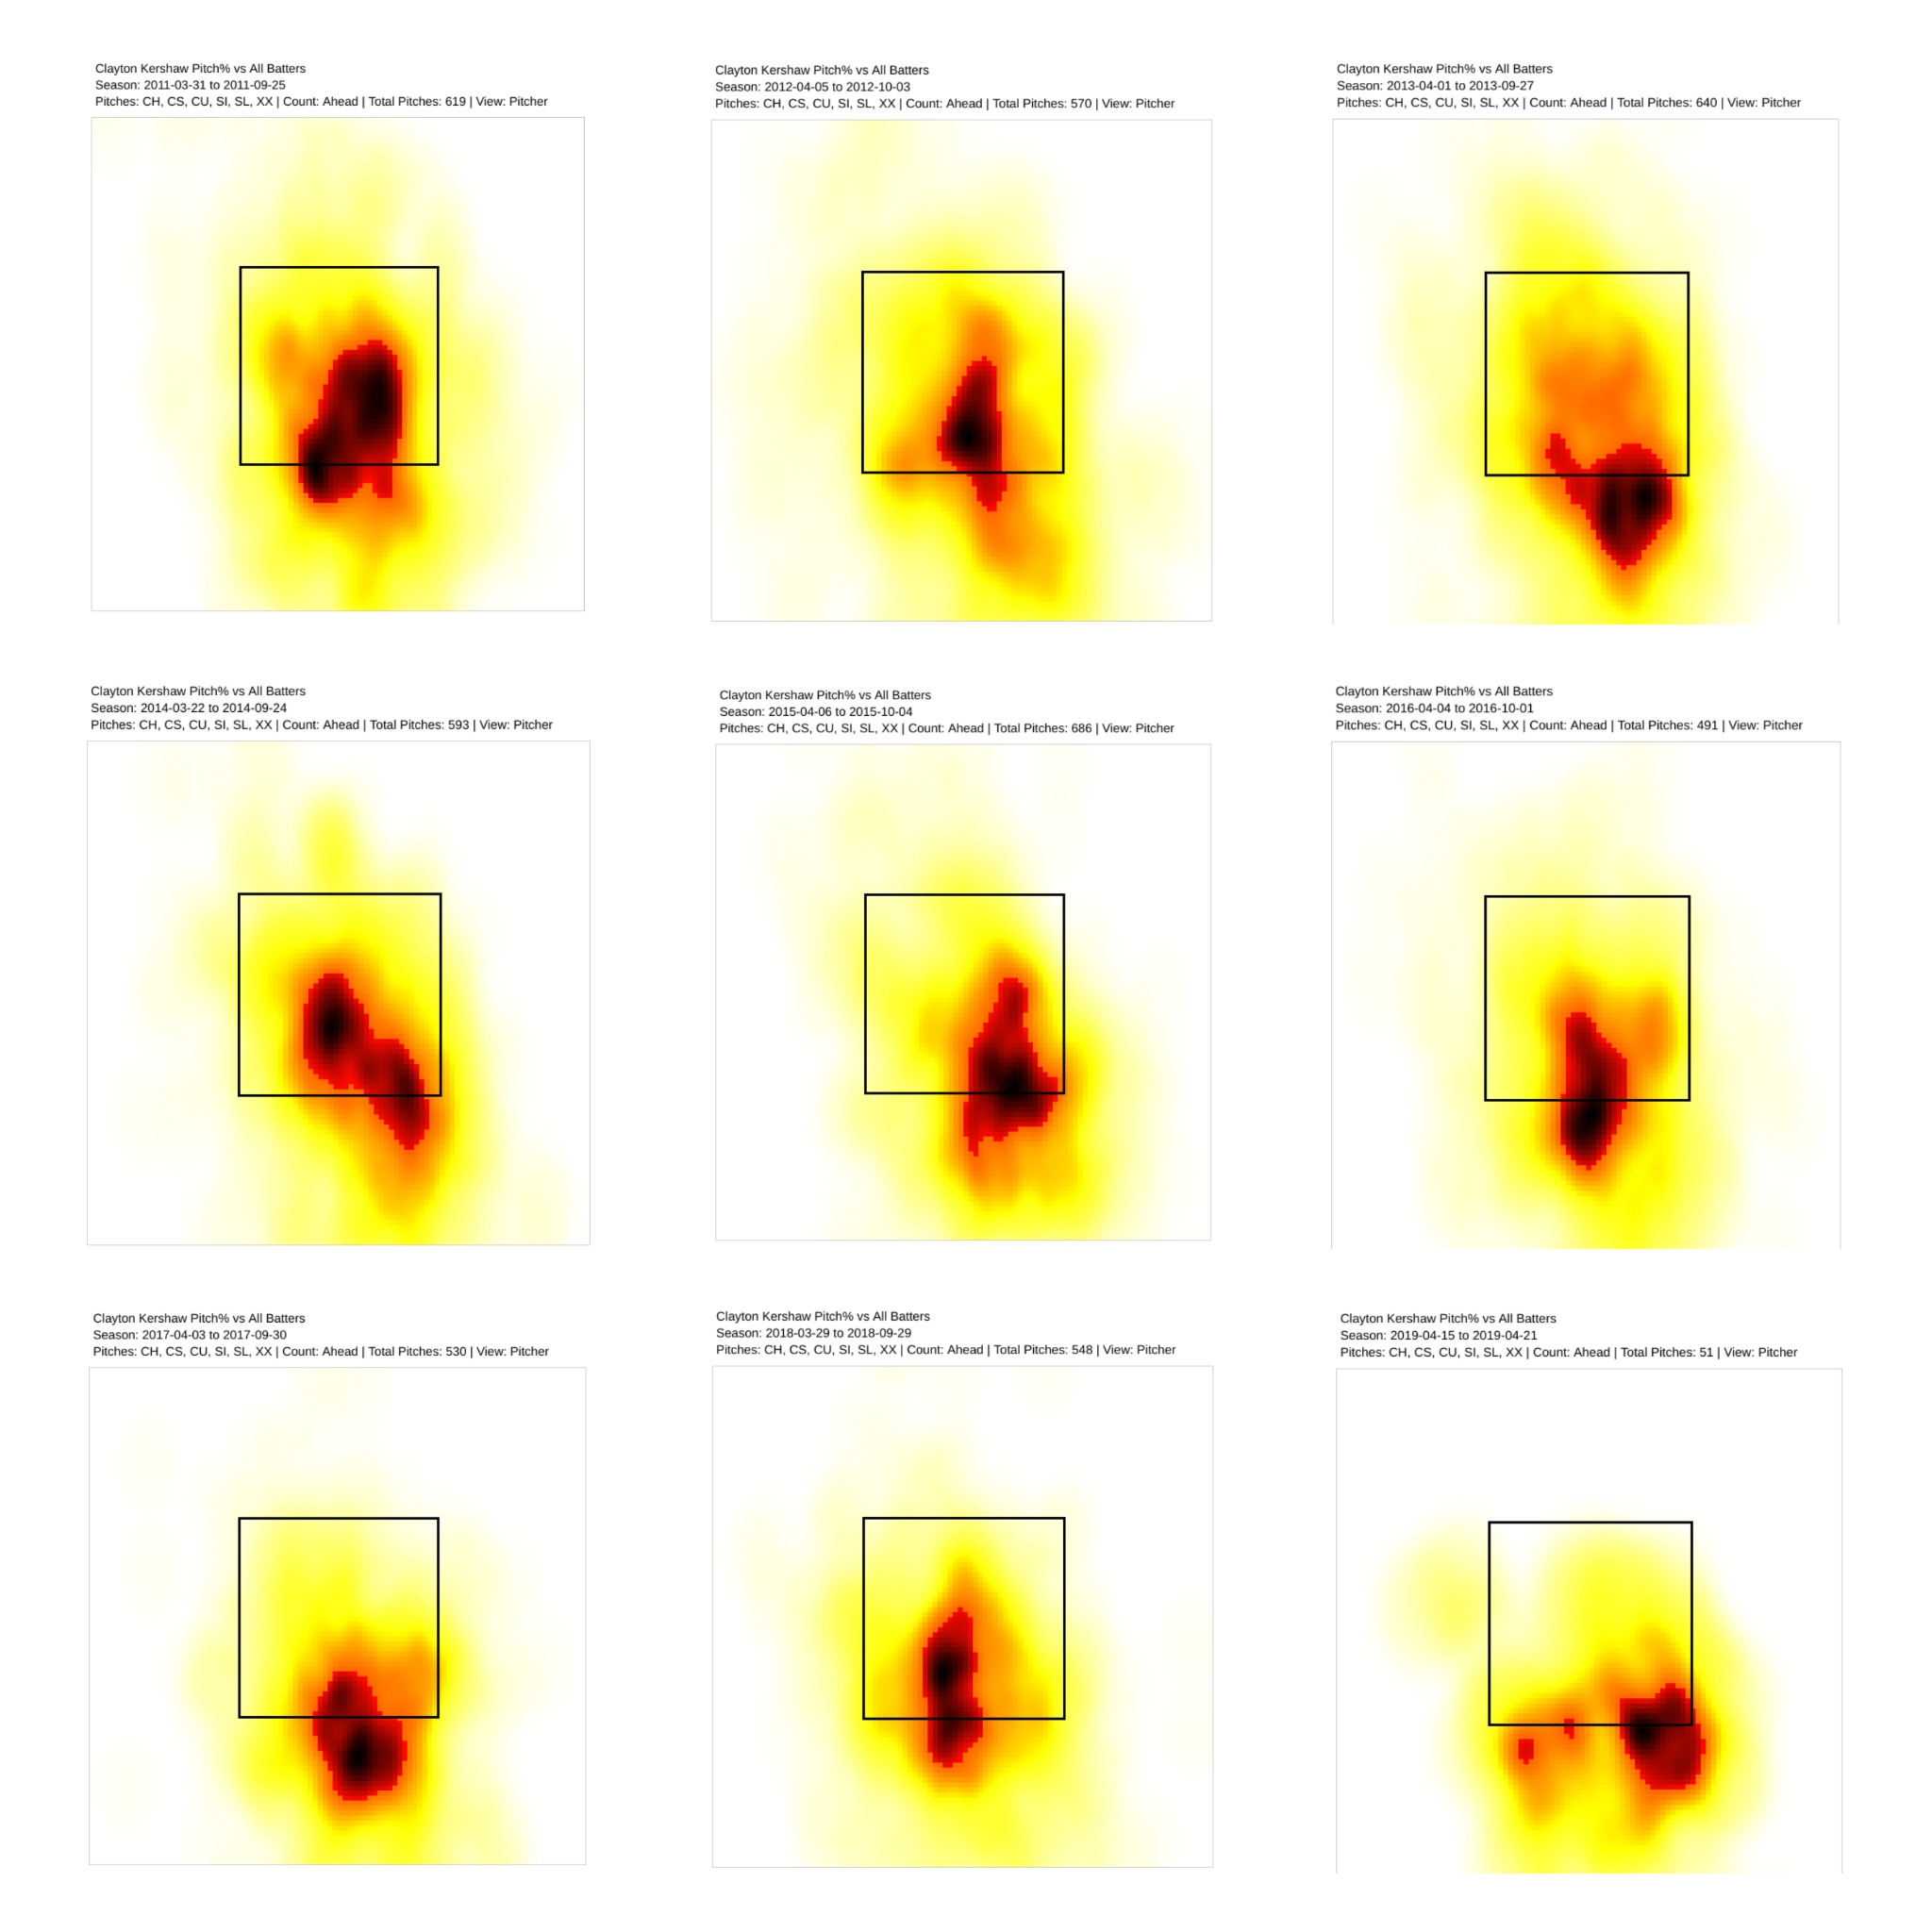
Notice that the god-like version of Kershaw from earlier this decade (seen in the first two rows) could throw his slider and curve right down the middle and still have little problem getting out. Even when he experimented below the zone in 2013, he was still throwing a good chunk of his sliders and curves over the plate. In 2017, he still pitched great in an abbreviated season, and started pitching out of the zone more. Last year, he was back up in the zone more and saw his strikeout rate fall to 24%, with a K+ rate of just 106, the worst mark of his career by a considerable amount. So far this season, Kershaw has gone at the very bottom of the strike zone or below, and he’s been very effective. The graph below shows how often Kershaw has been in the strike zone by pitch-type since 2011.
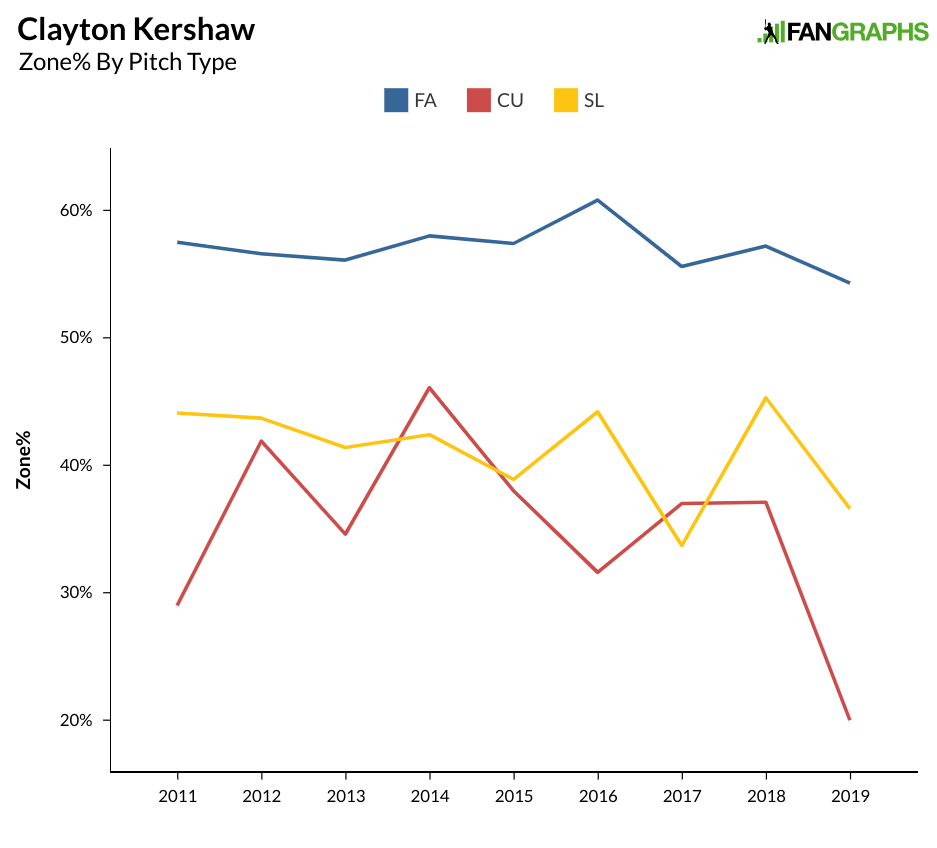
His fastball zone percentage is down a little bit, but the slider and curve have gone outside of the zone much more often than in previous seasons. Kershaw has given up three extra base hits so far this season. The graph below from Baseball Savant shows the pitch types and locations of those three offerings.
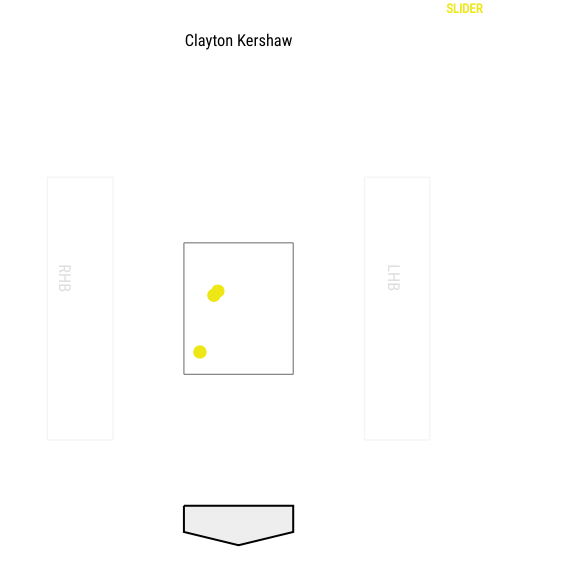
All three extra base hits have come on sliders in the zone. The first extra base hit came on this slider to Yasiel Puig.
This wasn’t a terrible pitch, but it was just above the bottom of the strike zone. Compare it to this slider thrown to Eugenio Suarez which was inches lower.
That couple of inches wouldn’t have made a difference for Kershaw a few years ago, but it might now. The chart below shows all the swings on Kershaw sliders so far this season and the result.
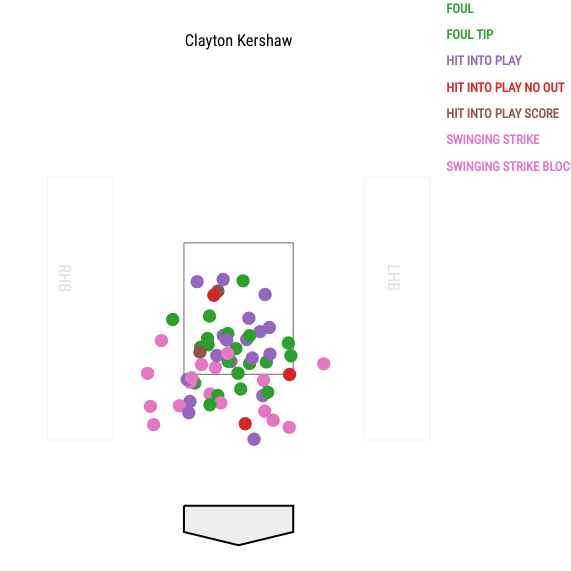
All those pink dots below the zone are the whiffs Kershaw has generated with very few of the same in the strike zone. When the pitch is in the zone, it gets put into play or fouled off. Just for completeness’ sake before getting back to slider, Kershaw’s curve is still making batters look silly. Here’s Eugenio Suarez.
Now, back to the slider. Kershaw’s slider has changed over the years. Back in 2013, he threw a slower slider, like this one to Andrew McCutchen.
He began throwing the pitch harder with the same vertical break and it dominated in the years after. Over the last couple seasons, the pitch lost both horizontal and vertical break. It was still a good pitch, like this one to A.J. Pollock last year.
While Kershaw maintained the higher velocity of the slider, he was losing a little horizontally and several inches vertically. This year, he still doesn’t have the same horizontal break as when the pitch dominated, but he is throwing the ball slower and the vertical break is back to what it used to be when the pitch was great. Watch here against Jose Peraza.
Kershaw is using the pitch lower with more vertical break and the highest spin rate of Kershaw’s career in the Statcast era. Kershaw is helping himself by throwing a first strike to 75% of batters thus far, which allows him to go out of the zone with his slider and curve. The current version of Kershaw isn’t what he was, but if he can get ahead of batters and continue to get them to chase with his slider, he should continue to be successful. Throwing the slider and fastball lower might also continue Kershaw’s high ground ball rate, which should help keep the ball in the park on most nights. Kershaw still has the stuff and command to get batters out at a very high rate. He won’t get away with the same locations he might have six years ago, but he can still use the same pitches to get outs with the best of them.
Craig Edwards can be found on twitter @craigjedwards.

Craig, really nice article. Good gif usage and I liked the heat maps as well, that was a nice layout. Nice job digging into the tendencies