This is not how I planned to begin FanGraphs’ 15th year.
I wanted to take a moment to personally inform all of our readers about what’s been going on at FanGraphs these past few weeks, and to share our plans going forward.
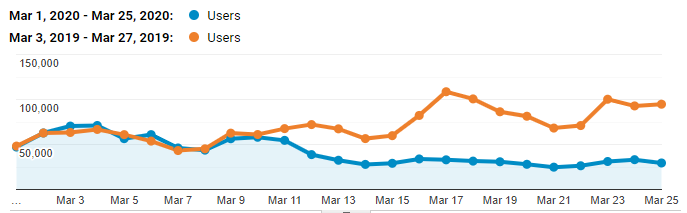
Starting March 12, after the announcement that Opening Day would be postponed, we have seen a steep decline in our site traffic that has lead to a correspondingly dramatic decline in revenue. Every piece you read and tool you use at FanGraphs is free to access, but they all take money to create. We are a small business. We rely on the revenue generated by site traffic.
As a result of these declines, I’ve had to make fairly aggressive budget cuts to try to keep FanGraphs viable as a company until the COVID-19 pandemic is resolved and baseball returns. This has involved all of our full-time staff members taking pay cuts, laying off the majority of our contributors, and closing The Hardball Times for the foreseeable future. Now we are asking for your help.
FanGraphs employs 10 full-time staff members who, along with our contributors, produce 200-300 articles each month in addition to our ever-growing inventory of stats, graphs, and tools. Our mission is still to bring you the very best baseball statistics and analysis.
We realize this isn’t necessarily the best time to ask for your help. You have concerns of your own. All of us are anxious in the face of economic uncertainty. We’re all worried about our health, and the health of our loved ones and friends. We’re all worried about what comes next. Quite frankly, our front-line medical workers and emergency personnel, and those who are sick or have lost loved ones, need your assistance most. But if you can spare it, we are asking for your support.
If you read our work, ask our writers questions in chats, listen to our podcasts, browse RosterResource, peruse The Board for prospect rankings, or use our stat pages, please consider a FanGraphs membership. If you work in a baseball front office, and your team all uses one membership login, consider signing up for a few more. Consider an ad-free membership! In addition to helping to ensure there is a FanGraphs when baseball returns, you’ll enjoy the site without banner ads, facilitating faster loading times for just $50 a year.
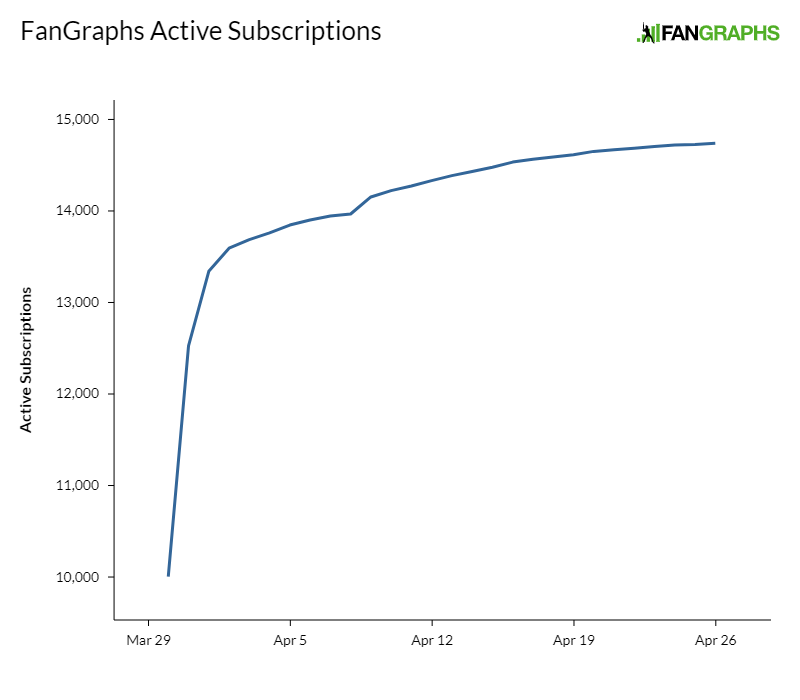
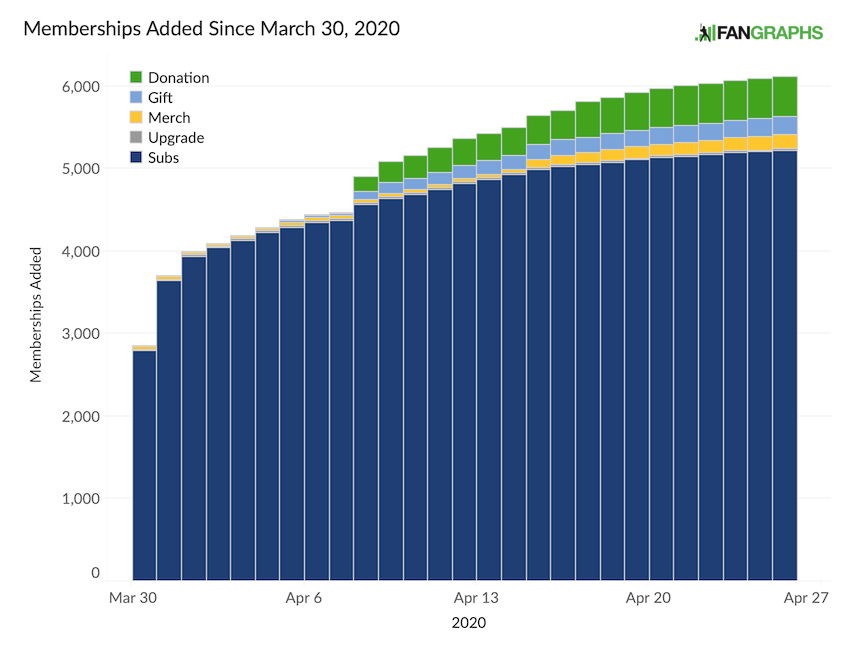
To all of our existing Members, thank you so much for supporting the site. Being a member is the best way to support FanGraphs.
To all of our readers, we are going to continue asking for your support. We are going to ask pretty frequently. We know there’s no baseball right now, but we’re still writing and building and trying our best to help provide a bit of respite from the pandemic. And when baseball comes back, we want to be here for you.
Once again, thank you for reading and for your support.
Stay safe, and be well.