Daily Graphing – Curt Schilling
After having the worst season of his career in 2005, it looked like a healthy Curt Schilling took the mound in the Red Sox season opener, going 7 strong inning and giving up only 2 runs. This off season, there was much talk about whether he would return to his 2004 form and while it’s still very early in the season, this first start was a much needed positive sign for Red Sox fans. Let’s take a look at why he was successful in his first start and if it’s something he’ll be able to duplicate.
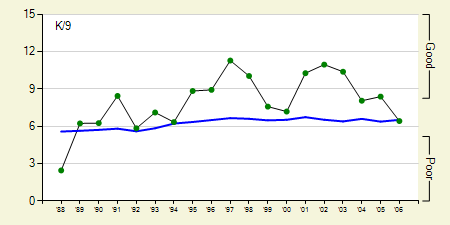
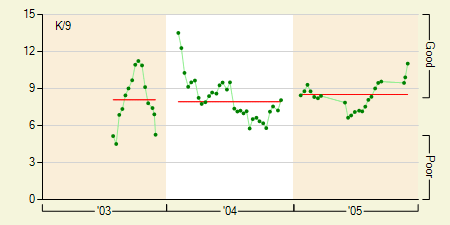
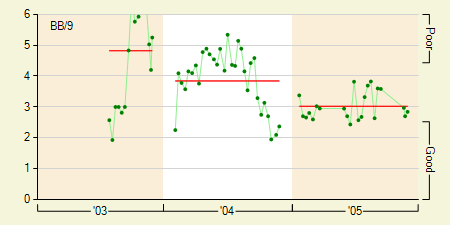
Despite his 5.69 ERA in 2005, he continued to strike batters out without too much of a problem. Batters chased his pitches outside the strike zone 29% of the time which was 3rd best among starting pitchers. Additionally, batters fouled off pitches they made contact with 51% of the time which also ranked him in the top 10. Basically, he didn’t lose his “stuff” even though he had a poor season.
In his first start of the 2006 season, everything fell pretty much inline with his 2005 stats except for two things. First of all, batters had even more trouble putting the ball in play as they fouled off his pitches an extremely high 59% of the time compared to the 51% last season. Second of all, he located pitches differently. Take a look at the pitch location charts (data provided by Baseball Info Solutions) for his quality and non-quality starts from August and September of 2005.
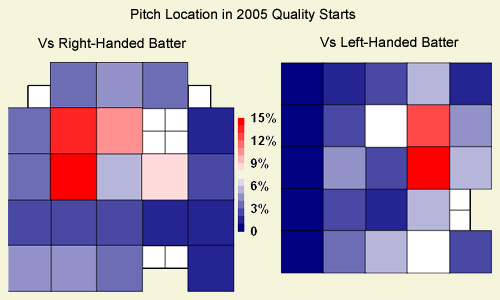
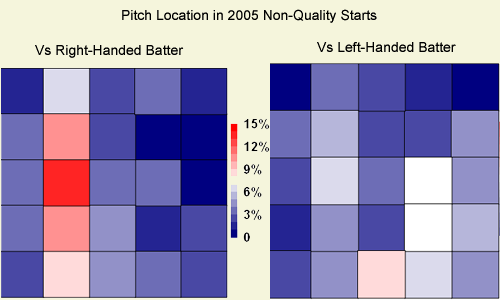
Schilling mainly pitched to right-handed batters outside, but notice how he also threw right-handed batters inside much more often in his quality starts and almost never in his non-quality starts. Furthermore, in his quality starts, he did a good job locating his pitches outside against left-handed batters while in his non-quality starts, he was all over the place. Now take a look at his first start of the 2006 season:
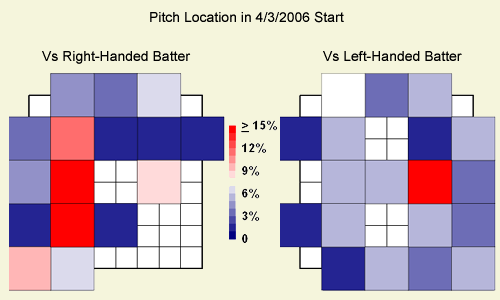
Looks exactly like a Schilling quality start from 2005, doesn’t it? Schilling’s peripherals were excellent last year and remained strong in his first start this year. As long as he continues to pitch inside to right-handed batters and locate his pitches against left-handed batters, I don’t see any reason why he can’t still be a very dominant pitcher.