Daily Graphing – Rich Harden
Between a strained oblique muscle and a season ending strained lat muscle, Rich Harden was excellent in 2005 going 10-5 with a 2.53 ERA in 128 innings. In the off-season he elected to have shoulder surgery on his non throwing arm in order to alleviate many of the minor injuries which were believed to be caused by overcompensation due to his injured left shoulder. So far, the shoulder surgery has been a success since this spring, Harden has pitched 14 innings with a 1.29 ERA while striking out a whopping 19 batters! Let’s take a closer look and see if he’s ready to be a perennial Cy Young contender.
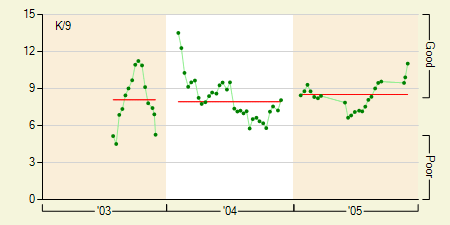
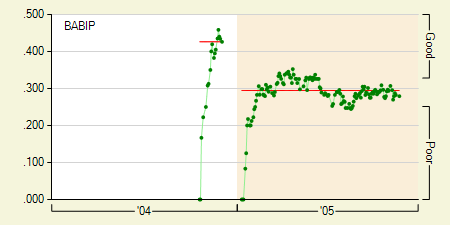
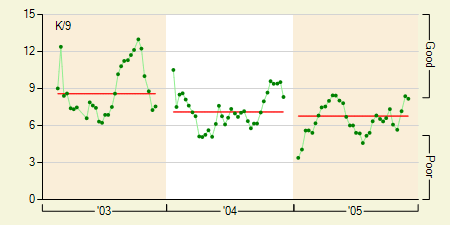
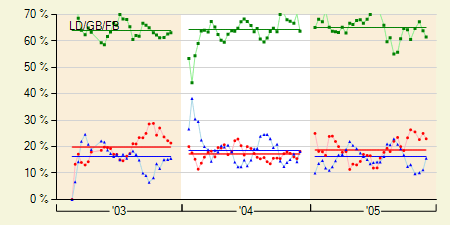
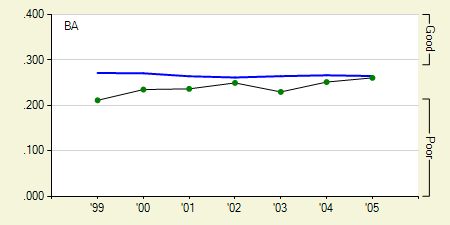
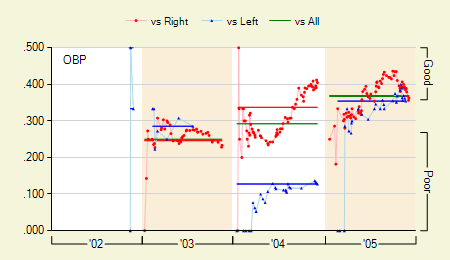
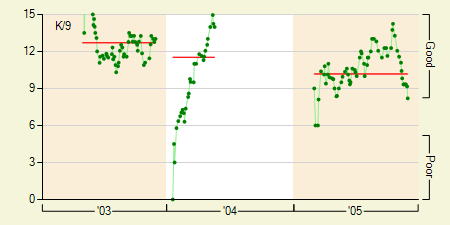
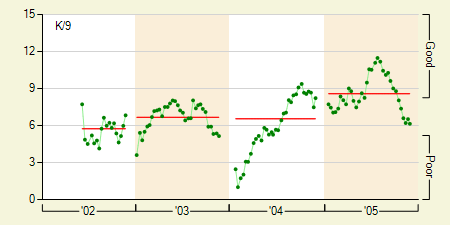
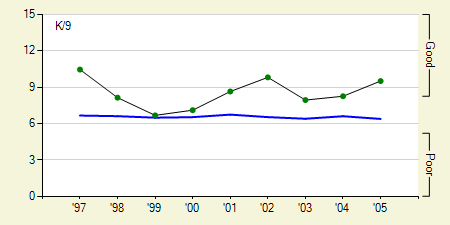
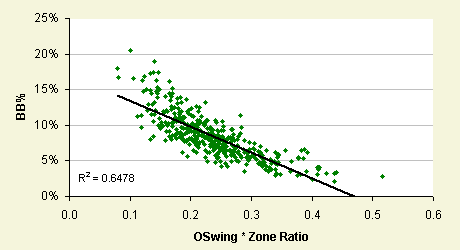
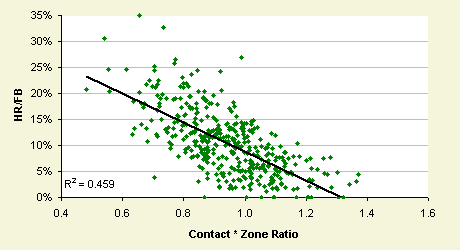
Looking at his strikeouts per 9 innings (K/9), you’ll see that he just falls within the top 20% of all pitchers and actually had the 12th highest K/9 of any starting pitcher for the 2005 season. He has an easy delivery, resulting in a deceptively speedy fastball which topped out at 102 mph last season. His fastball is accompanied by a splitter and slider which batters will chase out of the strike zone a combined 40% of the time. Throw in the fact that batters only make contact with his pitches 75% of the time and when they actually do make contact only put the ball in play 50% of the time and you’ve got yourself one of the most un-hittable pitchers in baseball.
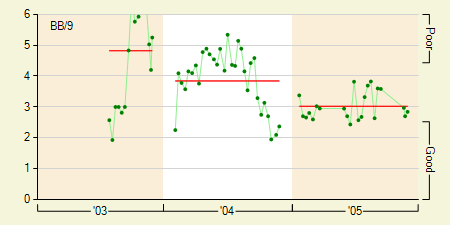
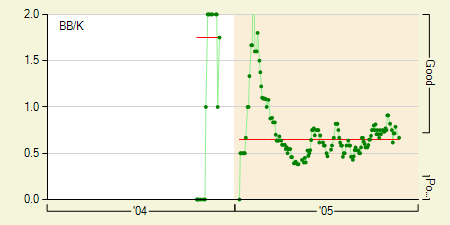
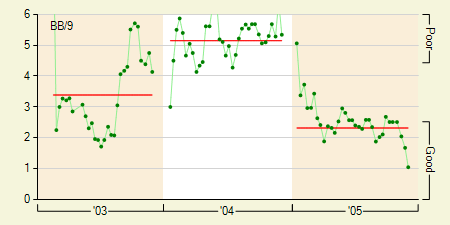
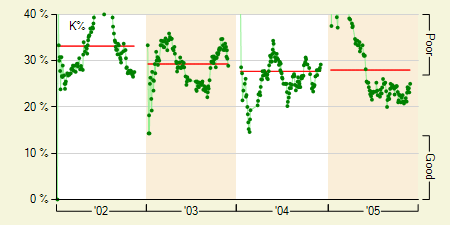
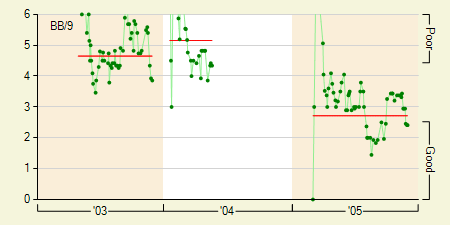
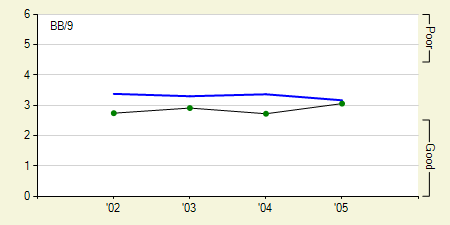
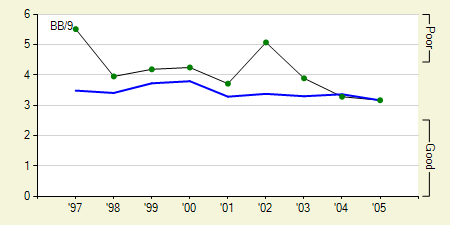
When Harden first entered the league he struggled with his control, but he’s managed to get his walks per 9 innings (BB/9) down to acceptable levels the past two years. There’s still a bit of room for improvement here, but if can continue to strike out batters the way he’s been doing it this spring (K/9 over 12), he’ll do just fine with his current BB/9.

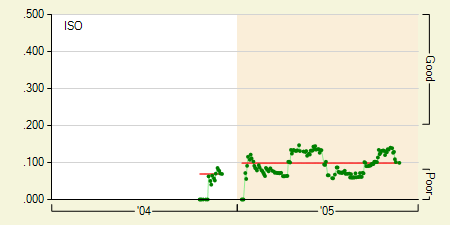
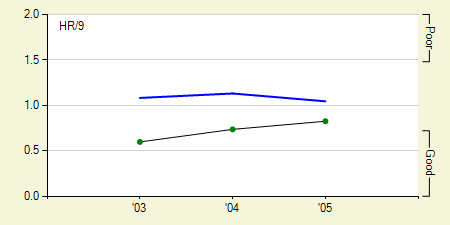
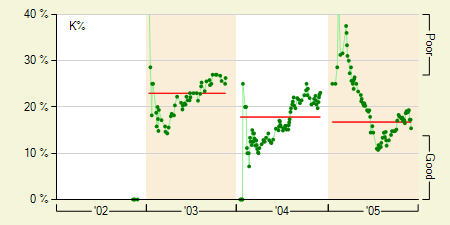
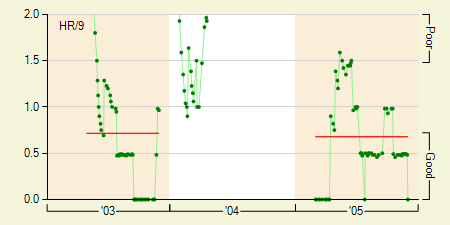
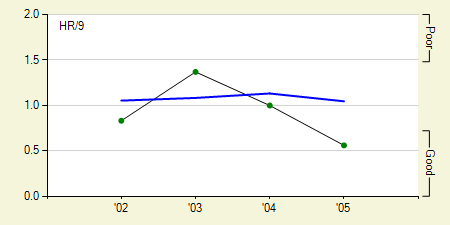
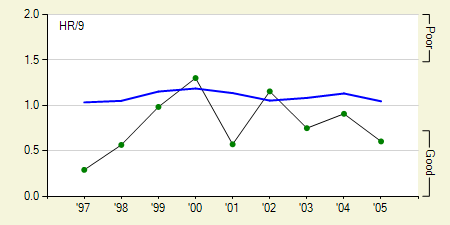
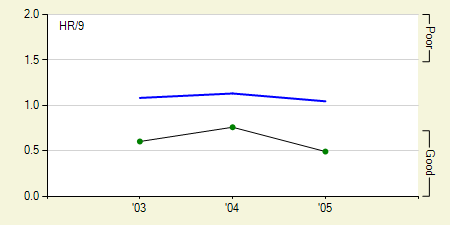
To add to the good news, he’s also a groundball pitcher which is a little rare to find in a pitcher that makes batters struggle to make clean contact with the ball. Obviously this (and playing in McAfee Coliseum) really helps keep his home runs per 9 innings (HR/9) well below the league average.
There’s really nothing not to like about Harden. I may as well be doing a Daily Graphing on Johan Santana (his would be even more glowing). The only thing that could possibly hold him back at this point is injury and hopefully the off-season surgery has helped minimize the chances that his 2005 injuries will re-occur. If all goes well, I’d be surprised not to see him in contention for the A.L. Cy Young award.