Research – Dissecting Plate Discipline: Part 1
If you’ve been reading the recent Daily Graphing columns, you’ll notice that I’ve been talking about some not so common stats such as, the percent a player swings at pitches outside the strike zone and actual contact rate. These oddball stats are derived from Baseball Info Solution’s “pitch data” which contains the location and result of each and every pitch, among other things. I’ve decided it’s probably a good idea to go over a bunch of these stats and examine why I think they’re meaningful.
When a pitcher throws the ball, it can land either in or out of the strike zone. Not all batters receive the same amount of pitches in and out of the strike zone and this does make a difference. Batters will see anywhere from 45% to as high as 60% of pitches inside the strike zone. I’ve found it most useful to express this as a ratio. Let’s call this Zone Ratio.
Zone Ratio (ZRatio) – the ratio of pitches inside the strike zone to pitches outside the strike zone
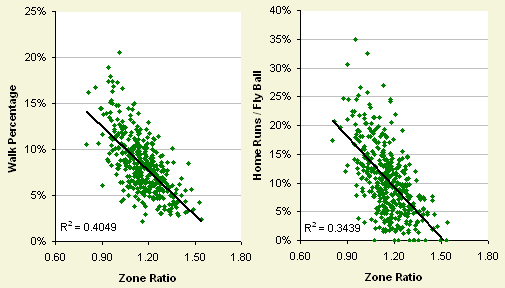
ZRatio correlates quite well with two stats that are frequently used: walks and home runs. It makes a lot of sense that batters who see more pitches outside the strike zone would walk more. Finding it correlated well with home runs was slightly surprising, but also made sense because pitchers would want to be more cautious with batters that can generate more power.
Top 5 ZRatio			Bottom 5 ZRatio
Aaron Miles	1.54		Ryan Klesko	0.89
W. Bloomquist	1.53		Carlos Pena	0.88
Tony Womack	1.49		Chipper Jones	0.86
Tike Redman	1.48		Russell Branyan	0.81
David Eckstein	1.46		V. Guerrero	0.80
If you look at the top and bottom 5 batters in ZRatio, it’s probably no surprise to see Vladimir Guerrero receives the least amount of balls in the strike zone. On the high end, you don’t just have guys like Willie Bloomquist (0 HRs) and Tony Womack (0 HRs), but also David Eckstein (8 HRs). I wonder if David Eckstein will remain in the top 5 in 2006. Quickly shifting back to players that have a low ZRatio you’ll notice Russell Branyan who strikes out more than pretty much anyone in baseball. Unlike Vladimir Guerrero, it’s more likely pitchers are exploiting a weakness instead of respecting his power.
Moving along, after the pitch is thrown, there are two things a batter can do: take the pitch or swing at it. I’ve found that it doesn’t seem to matter how often a batter will swing at pitches inside the strike zone, but how often they’ll swing at pitches outside the strike zone. I’m going to call this stat Outside Swing Percentage.
Outside Swing Percentage (OSwing) – The percentage of pitches outside the strike zone a batter swings at.
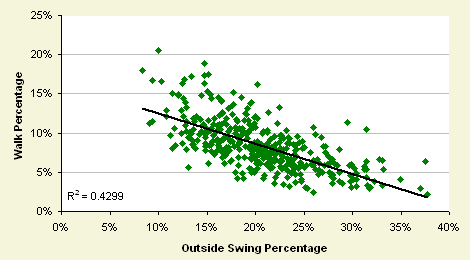
Probably to no one’s surprise, OSwing correlates quite well with walks. Batters will swing at pitches outside the strike zone as low as 8% of the time to as high as 37% of the time. Looking at the top and bottom 5 lists, you’ll see that batters that you typically consider having great discipline such as Chipper Jones and Jason Giambi round out the bottom of the list. At the top of the list you have batters that really like to swing the bat such as Ivan Rodriguez and Jeff Francouer.
Top 5 OSwing			Bottom 5 OSwing
Ivan Rodriguez	37.69%		Jason Giambi	10.03
Bradley Eldred	37.50%		Dave Roberts	9.39
Angel Berroa	37.01%		Chipper Jones	9.33
Jeff Francoeur	34.91%		Eric Young	9.09
Johnny Estrada	33.22%		Brian Giles	8.33%
Finally, if you do decide to swing the bat, one of two things can happen: you either hit the ball or miss the ball. Batters made contact with the ball anywhere between 54% and 94% of the time. Let’s call this stat simply Contact Percentage.
Contact Percentage (Contact) – The percentage of times a batter hits the ball when he swings the bat.
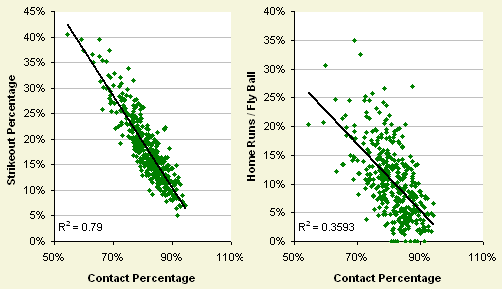
There are two things that Contact correlates well with: strikeouts and home runs. The correlation with Strikeouts isn’t a shock. If you can’t lay wood on the baseball, you’re going to be striking out a lot. The correlation with home runs, just like with ZRatio was a little surprising, but once again this also made sense. Typically players who are swinging for the fences are going to swing and miss more often.
Top 5 Contact			Bottom 5 Contact
David Eckstein	94.26%		Craig Wilson	63.23%
Luis Castillo	94.01%		Carlos Pena	63.02%
Oscar Robles	93.51%		Wily Mo Pena	59.83%
Chris Gomez	93.43%		Russell Branyan	59.21%
Kenny Lofton	92.66%		Bradley Eldred	54.57%
Once again, if we look at the top and bottom 5 players in Contact, you’ll see players like David Eckstein and Kenny Lofton at the top of the list. Just outside the top 5 are players you’d expect to see because they’re considered great contact hitters such as Juan Pierre and Placido Polanco. Remember how Russell Branyan had a very low ZRatio? Being one of the worst contact hitters in baseball, this pretty much confirms that pitchers are indeed exploiting his deficiencies.
So for each of these three stats, I talked about how they correlate well with other more mainstream stats. Based on that, we should be able to come up with the expected number of strikeouts, walks, and home runs for each player based on the components of their actual plate discipline. Later this week in Part 2, I’ll be exploring the discrepancies between what a batter is expected to do based on his plate discipline and what he actually does.