Daily Graphing – Brandon Webb
Remember back in 2003 when Dontrelle Willis won the National League Rookie of the Year award? If it weren’t for a few extra wins, perhaps Brandon Webb would have won the award instead, since his 2.84 ERA, 180 innings, 172 strikeouts and 1.15 WHIP were all better than Willis. Since then, Webb has been quite consistent throwing over 200 innings in his past two seasons with an ERA just under 3.60. He only has 21 wins to show for his effort, but he’s only received an average of 3 runs per start from his offense, so it hardly seems fair to put the blame on Webb’s shoulders.
So far this spring, Webb has been spectacular, going 3-0 while allowing only 1 hit and no runs in 9 innings of work. It’s not exactly a sample size you can hang your hat on (and it’s spring training), but it is a little impressive. With that in mind, let’s take a closer look and see if he’s capable of becoming one of the elite pitchers in the National League.
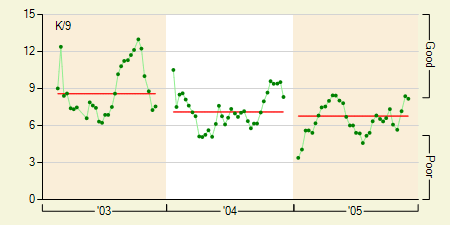
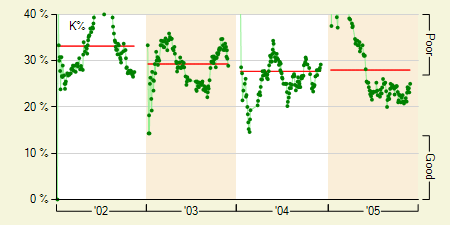
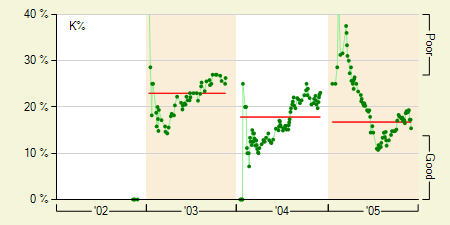
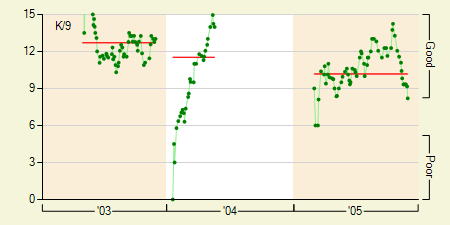
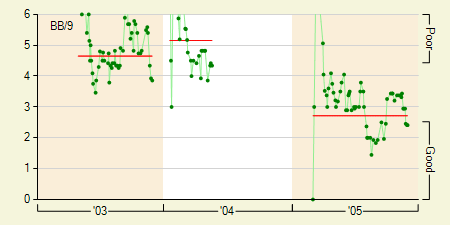
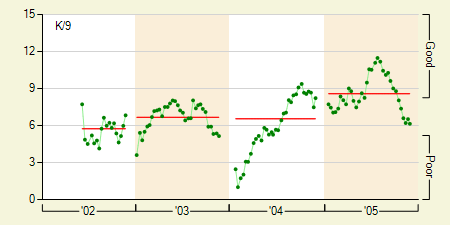
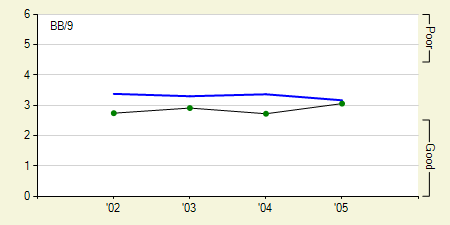
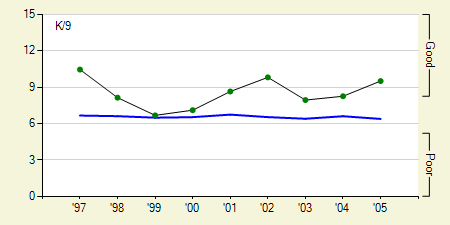
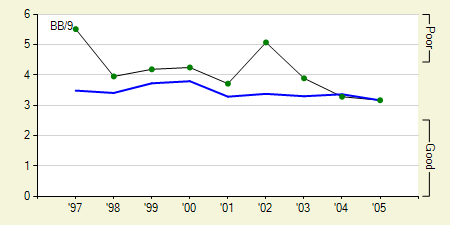
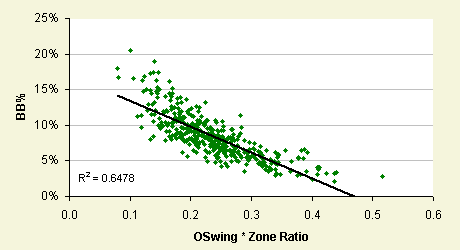
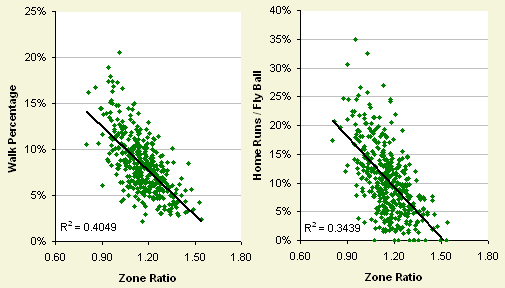
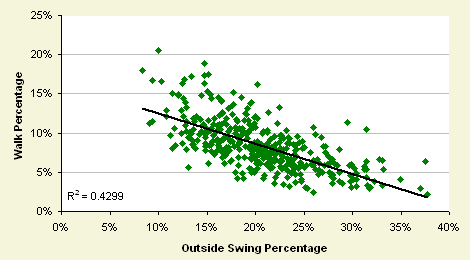
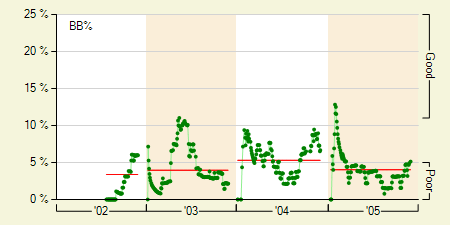
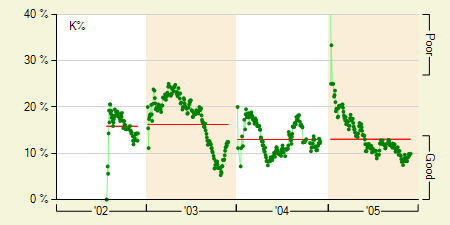
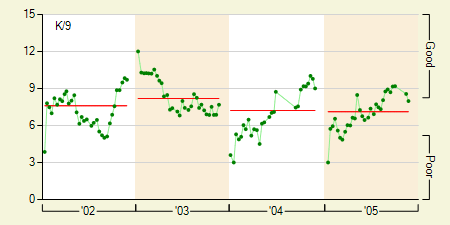
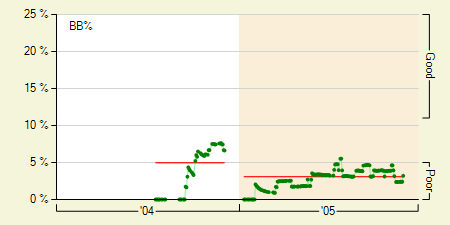
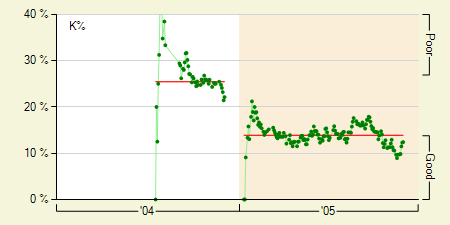
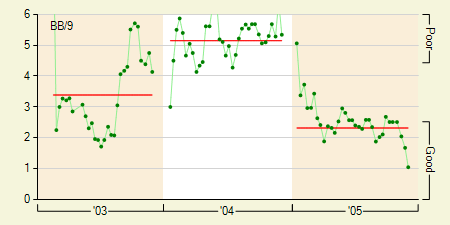
His strikeouts per 9 innings (K/9) decreased for the second year in a row, falling to an adequate 6.7. That’s nearly a two point drop since his rookie season. In 2005, batters swung at his pitches outside the strike zone 21% of the time, which is slightly above average. Fortunately, his walks per 9 innings (BB/9) plummeted nearly three points to a good 2.3 which easily offset any decrease in strikeouts.
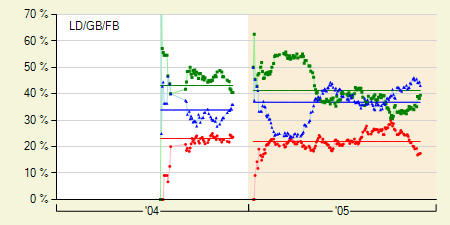
While neither his strikeouts nor walks are off the chart, he induces far and away the most ground balls of any starting pitcher in baseball. He’s led the league in groundball to fly ball ratio the past two seasons and his rookie year he was second only to Derek Lowe. The most successfully pitcher that’s even close to being in the same league as him in terms of ground balls is Roy Halladay who also has a K/9 in the high 6’s. Webb however, has lacked Halladay’s pinpoint control.
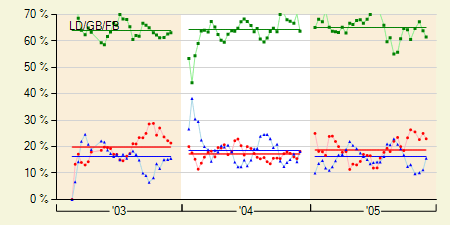
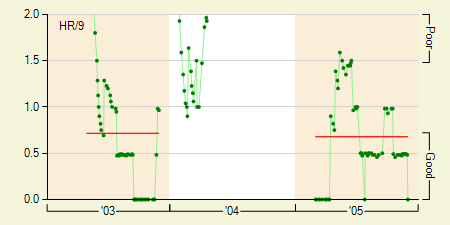
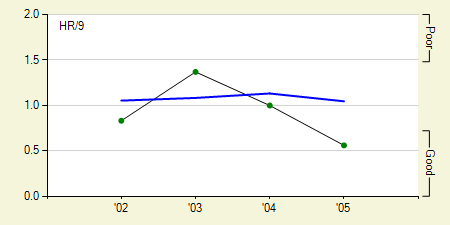
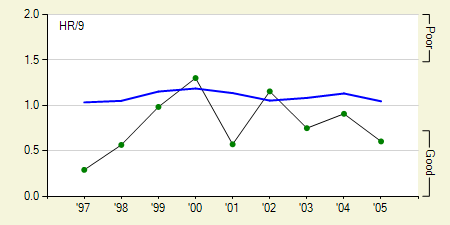
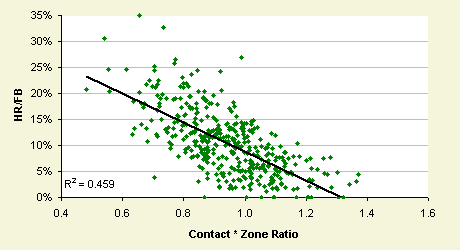
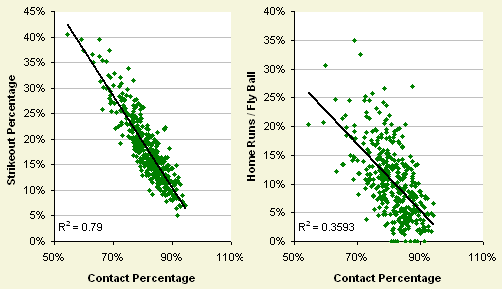
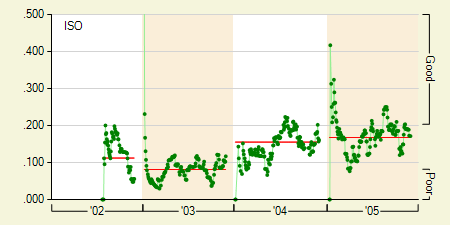
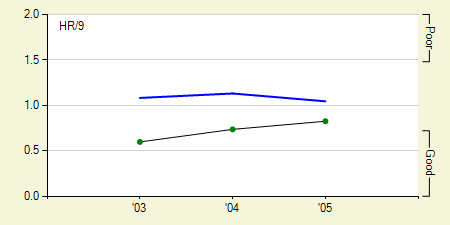
It’s also worth mentioning that while Webb’s home runs per 9 innings (HR/9) have always been pretty good due to his extreme groundball tendencies, he has a very high home runs-per-fly ball (HR/FB) of 18.9%. While it’s not unusual for groundball pitchers to have a higher HR/FB, I’d consider 18.9% freakishly high, so expect there to be some improvement in the home runs department.
It’s rare to find an extreme groundball pitcher that can also strike batters out and Webb definitely falls into that category. Sure his strikeouts may have dipped a bit, but his control is much improved and he’s apparently added a cut fastball which is supposed to make him a bit less predictable with his sinker. If that helps him strike out a few more batters, he should be primed for an excellent year.