There were nearly 700,000 pitches thrown during the 2005 season and Baseball Info Solutions tracked pretty much every single one of them. Whether it be location, speed, pitch type, or the result of the pitch, there's data on all of them. The real question is, what the heck is anyone to do with all this data? There's probably thousands of ways you could try and tackle this “pitch data”, but I was particularly interested in trying to see if I could visually display a batter's coverage of the strike zone.
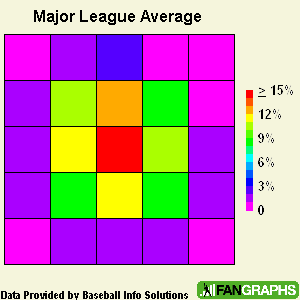
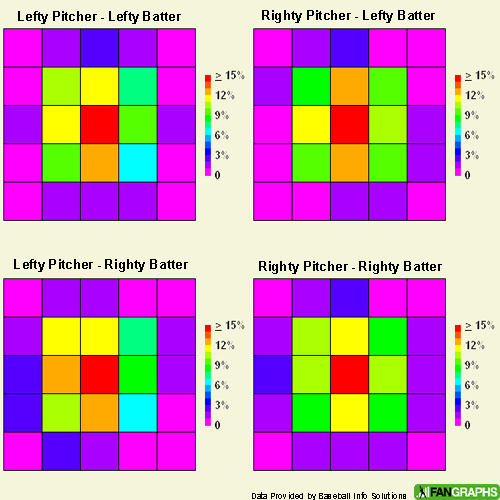
What I decided to do was put a grid over the strike zone and see the percentage of pitches thrown to each section that became hits. I'm calling these charts PitchZone charts. For starters, let's take a look at the major league average for left-handed and right-handed batters. The box in the very center is the strike zone and the color code represents the percent of balls thrown to each area that become hits.
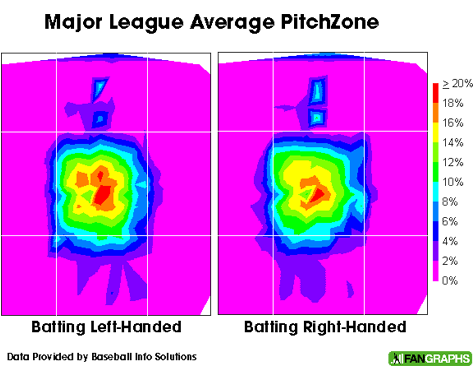
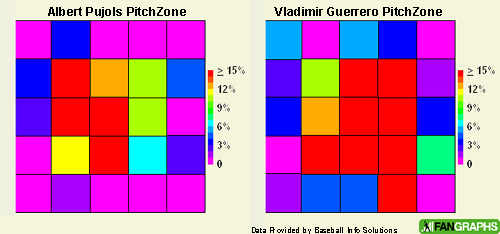
The results are not really surprising at all. As pitches get closer to the center of the strike zone, they become more hittable. I'm sure you already knew this (or at least suspected this), but now you can see it. The next step was to take an individual batter's pitch data and make it into a PitchZone chart. Let's see how good Albert Pujols is at covering the plate. Please note the scale change; instead of 20% being red, 50% is now red.
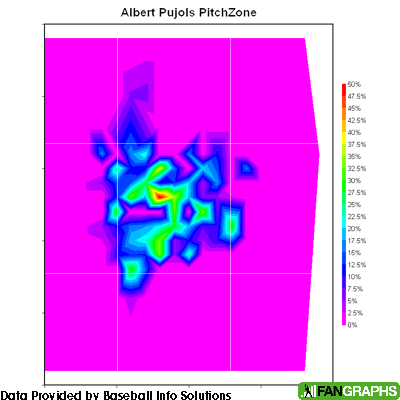
Pujols covers the strike zone extremely well. The only area that it looks like he's not able to cover is down and inside (the pink area in the bottom right corner of the strike zone). Throw the ball right over the center of the plate and there's a near 50% chance Pujols is going to get a hit. For comparison sake, let's see what a not so great batter looks like. Here's Corey Patterson (my current whipping boy):
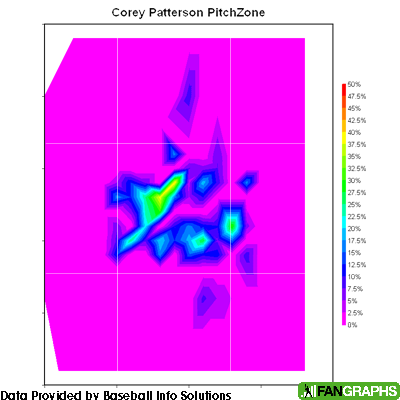
Doesn't look nearly as good, does it? Patterson appears to have a lot of gaps in his swing. Additionally, you can compare each player's PitchZone to the league average to get charts that show you which areas a batter excels. Here's Pujols against the major league average for right-handed batters. Please note the scale change again as this is now percent over or under league average.
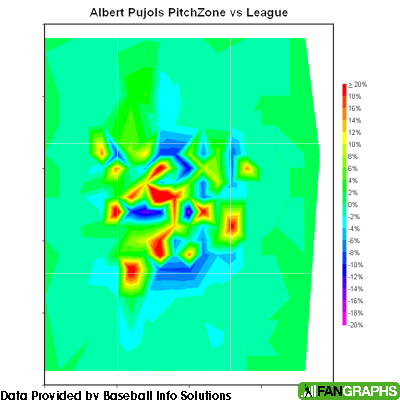
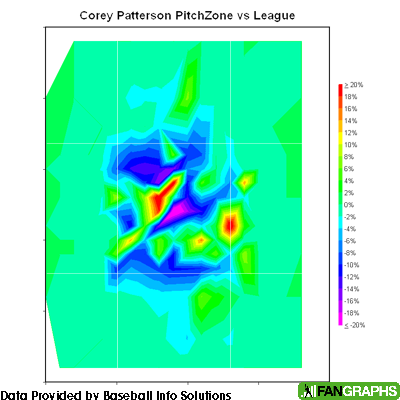
To no one's surprise, Pujols is league average or better in just about every area. Patterson on the other hand (compared to other left-handed batters) is worse than league average in a lot of spots and only better in a few select areas. It looks like he might be ok at handling pitches on the outer edge of the strike zone.
How many times have you heard an anecdotal account of a batter not being able to handle an inside pitch, or a batter chasing pitches down and away? Hopefully charts like these (and future versions) will give a more concrete understanding of why batters perform like they do. What your eyes tell you and what's actually true may not always be the same. Obviously there's still a lot of work to be done here and in the coming months I'll be writing a number of articles on pitch data for batters and pitchers alike.