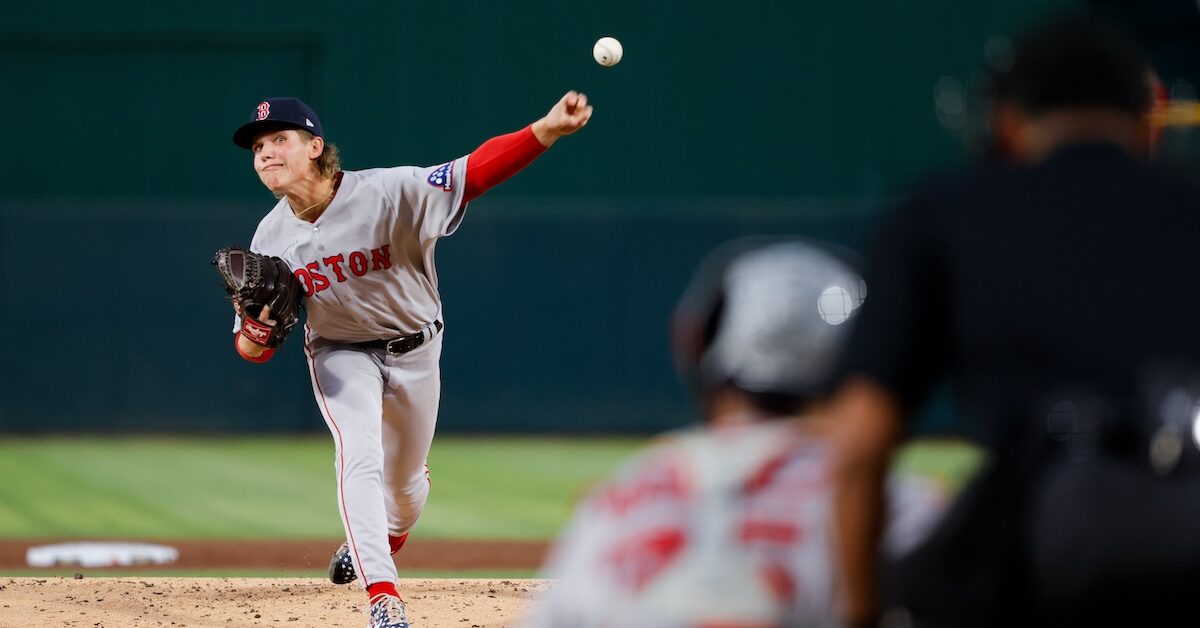
First impressions can prove to be fleeting in baseball, but it’s still better to make a good one than a poor one. And as first impressions go, Boston Red Sox rookie Connelly Early’s was absolutely dynamite. Throwing five innings in his debut, Early whiffed 11 A’s batters, with a single walk as a minor demerit, and exited the game with a 5-0 lead that was never threatened.
So how did he do it? Sometimes rookie pitchers simplify their repertoire somewhat while they’re getting adjusted to the majors, but Early threw five different pitches at least 10 times, and got at least three swings and misses on each of them, totaling 19 for the game. His most hittable pitch on Tuesday, his changeup, still had a respectable 70% contact rate, about league average for changeups (70.5%). And with the exception of his sinker, which he only offered up against lefties, he didn’t aggressively limit his toolset based on the platoon advantage, either. (For more on Early’s stuff, I can’t do better or find a more fitting piece for you to read than David Laurila’s May profile of the southpaw.) Read the rest of this entry »
It’s hard to believe, but in two months, the celebratory World Series Champagne will have dried, the beer will be gone, and free agents will hit the open markets. After the season, players and teams have only five days to make their final option decisions, a choice that can have an enormous impact on future earnings or offseason team plans. I’m not here to predict all of those options in a 40,000-word article, as you, loyal FanGrapheteer, might nod off in boredom while Meg and Matt plot my no-doubt painful demise. But we can do a subset of them, the opt-outs and player options, as many of these are the biggest decisions that will need to be made in November. Plus, it’s an excuse to run out some early projections, which is always fun.
Unless I missed one, there are 15 opt-out clauses or player-only options.
Alex Bregman, 3B, Boston Red Sox
It took until mid-February for Alex Bregman to find a new team last year, and his arrival in Boston set off an unexpected chain of events that ended with Rafael Devers getting traded to San Francisco. Bregman has a particularly interesting choice to make in that he has only two years remaining on his deal, but a pretty spicy $80 million coming to him for those two seasons if he stays. Naturally, Bregman wants a little more security that what his Red Sox deal calls for, but that might not be attainable to him at his current rate of $40 million per year. He turns 32 in March, so he won’t be able to command a lucrative long-term deal like the one that Kyle Tucker, who is still in his 20s, is expected to sign this winter. Read the rest of this entry »
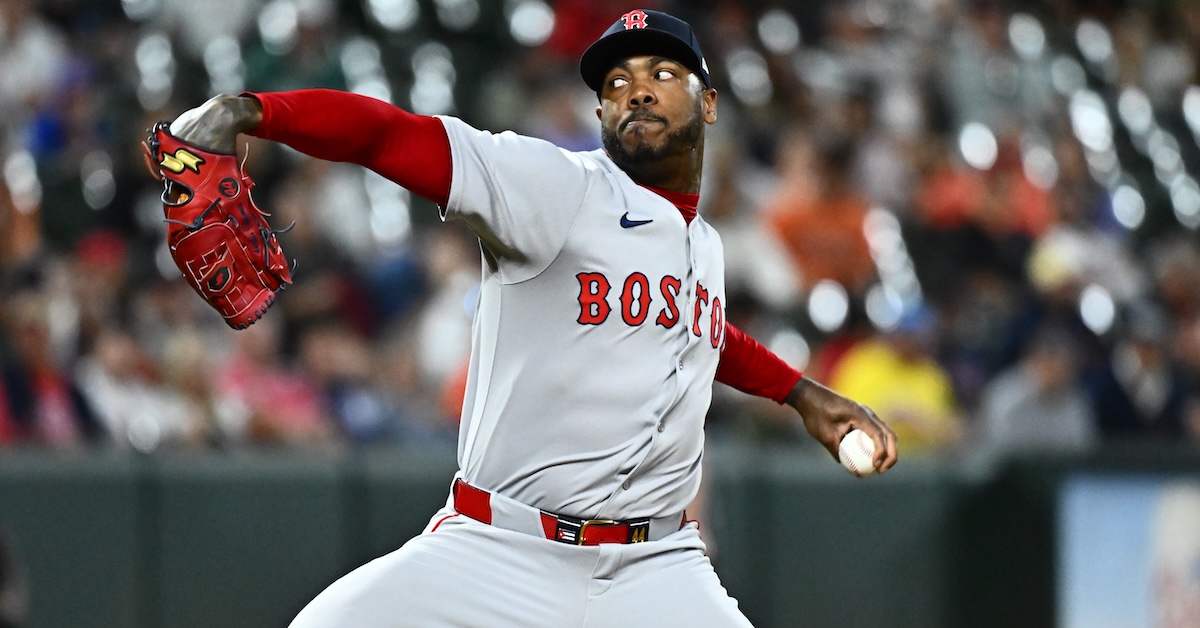
The Red Sox got to work on their 2026 bullpen over the holiday weekend, signing closer Aroldis Chapman to a contract extension that keeps him in Boston for at least one more season. Chapman’s one-year, $13.3 million deal comes in the form of a $12 million salary for next season, a $1 million signing bonus, and a $300,000 buyout if a $13 million mutual option for 2027 is not exercised. That option becomes guaranteed if he pitches 40 innings in 2026 and passes a physical exam after the season.
After appearing to be in decline for at least a few years and falling out of the conversation of baseball’s top closers — and at times losing the closer’s role altogether — Chapman is dominating in his first season with the Red Sox. Entering play Tuesday, he has a 1.00 ERA and a 1.78 FIP over 54 innings with 77 strikeouts and 14 walks. No, you didn’t misread that last part: Chapman has issued only 14 free passes this season across 54 innings, which works out to a rate of 7.1% and 2.33 BB/9 — by far the lowest marks of his career. Even at his absolute best, Chapman would walk three or four batters per nine innings, a reasonable trade-off for the rest of his skillset. However, as he aged, that control degraded, and from 2021 through 2024, he walked 15% of the batters he faced. So, for him to suddenly put up the best control season of his career, at age 37, is an impressive feat.
ESPN’s Buster Olney talked a bit about how Chapman’s approach changed in the spring, but the basic explanation for what we’re seeing is he has stopped throwing his fastball down the middle. Instead, on the advice of Boston catcher Connor Wong and with the assistance of PitchCom, Chapman is now actually trying to spot his heater. While this is the type of anecdote that sometimes sounds like folklore, the data do suggest that Chapman is suddenly locating his fastball with dramatically more competence than in the past. According to Stuff+, Chapman’s Location+ of 179 for his fastball is the fifth-best number ever tallied (min. 40 innings), compared to the 94 he ran over his past four seasons. His sinker, once a sideshow in his repertoire, has become its focal point in the way the slider once was. This isn’t a sinker thrown to induce a groundball but to be an out pitch, a 100-mph sinker high and outside against righties, high and hard on the hands of lefties. Only one player in Statcast history has ever finished with a better whiff rate on his sinker than Chapman’s 38.9% this season: Josh Hader in 2019 (40.7%) and 2021 (40.5%). Read the rest of this entry »
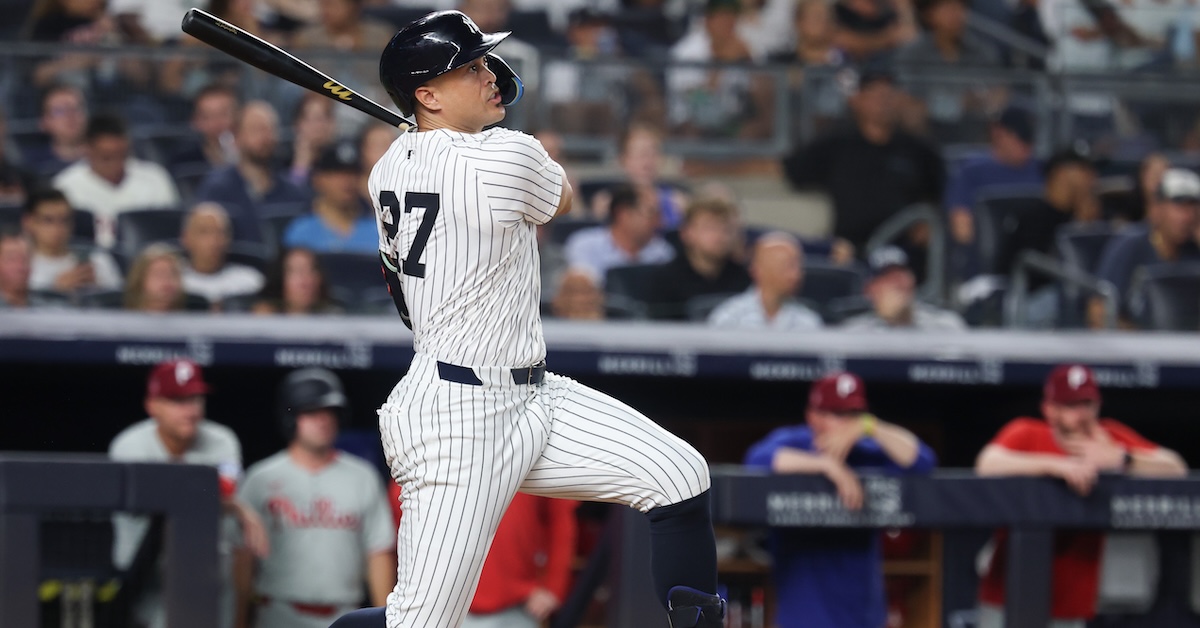
To put it delicately, Giancarlo Stanton’s stint with the New York Yankees hasn’t exactly gone according to plan. To put it less so, Stanton has amassed fewer WAR in eight years in New York than Aaron Judge did in 2024 alone. When the Yankees acquired Stanton in late 2017, the expectation was that he’d be the foundation of the team’s lineup for the next decade as he finished assembling his Hall of Fame case. However, since a solid if mildly underwhelming debut season in the Bronx, Stanton has suffered through a parade of injuries that has left him with only a single 120-game season, and his deity-level exit velocities have rapidly become his main offensive skill. Five hundred home runs, which once would have seemed like a disappointing final milestone for Stanton, increasingly looked liked the happy result.
Stanton’s health has remained a problem, as he missed a large chunk of this season with a severe case of tennis elbow in both elbows. But the results he’s gotten when he has been available have been of classic Marlins vintage: a .313/.388/.663 line with 17 home runs and 1.9 WAR in 51 games, with the WAR total his best tally since 2021. With Judge first out with a flexor strain and then missing his usual power since his return, having Stanton bust out to this degree has kept the Yankees’ current spate of problems from becoming even greater.
So, how has he done it? Rather than revolutionize his game, Stanton is playing like the most Stantonified version of himself. His average exit velocity and hard-hit percentage are at their highest levels ever, and his out-of-zone swing percentage is the lowest it has been in years. The attack angle on his swing has ticked up a couple of degrees, enough to give him an ideal attack angle 65% of the time, up from 60% in 2024 and 57% in 2023. We don’t have bat tracking data further back, but we do know that Stanton has a career-high rate of flyballs and a career-low rate of grounders. Read the rest of this entry »
Dan Szymborski: And thus the chat began. Suspiciously, it began on time as well.
12:01
Philly Fan: How much of a hit did Phillies’ WS prospects take with Wheeler’s injury?
12:01
Dan Szymborski: I didn’t do an article on the topic, but I did run the numbers and at the time, they dropped from 11.7 to 9.8 in ZiPS purely for the Wheeler injury
12:01
Ben: If/when expansion happens, which cities are you hoping get team? Which ones would you bet on getting a team?
12:02
Dan Szymborski: I hope Nashville gets one. That’s purely for selfish reasons – gives me yet another park five hours or less away!
12:03
Dan Szymborski: And I like excuses to visit Nashville. The state of hot chicken in SW Ohio, at least in the Dayton area, is truly sad.
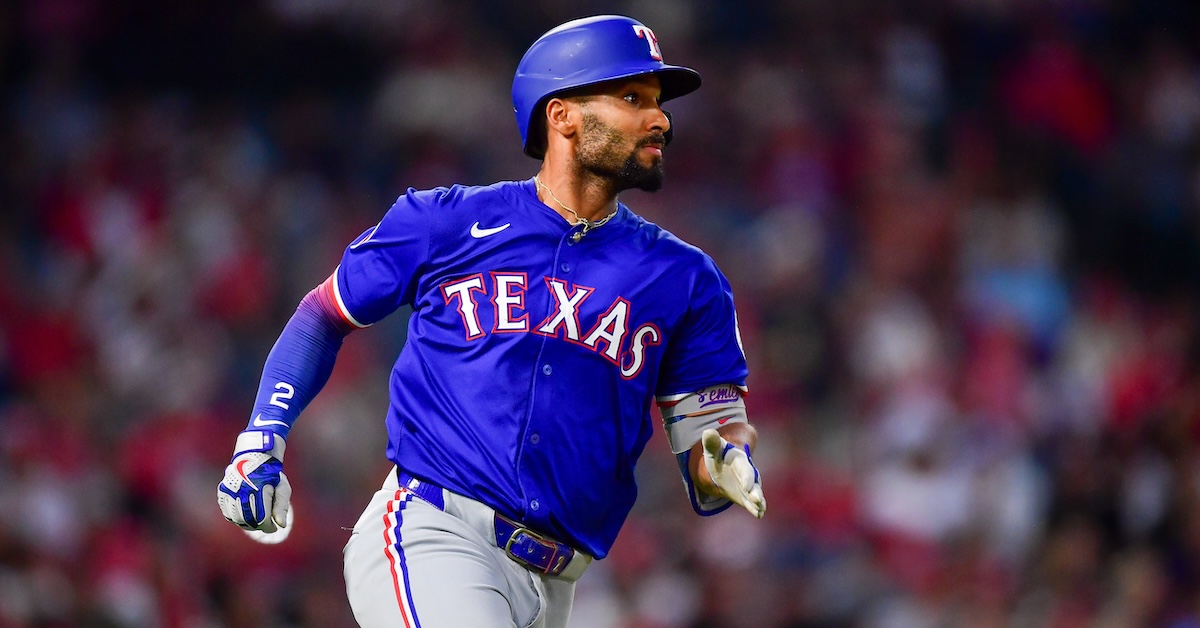
The Texas Rangers placed second baseman Marcus Semien on the injured list with a broken left foot over the weekend, retroactive to Thursday’s games. The result of a foul ball hitting the top of his foot, Semien was initially diagnosed with a contusion, but after getting multiple additional opinions, that diagnosis was revised to a fracture of the third metatarsal and a Lisfranc sprain. Semien, who turns 35 next month and whose last injury that merited an IL stint was a wrist contusion back in 2017, is having one of his weaker offensive seasons, with a .230/.305/.364 triple slash line, but thanks to his still-solid glove, he’s still amassed 2.1 WAR. The injury likely ends Semien’s regular season, and given where Texas is in the standings, probably his 2025.
I can’t think of many good times to break your foot. Just speaking for myself, I might consider a broken foot preferable to, say, going to a wedding I really don’t want to attend. But Semien is a professional athlete, not an introverted middle-aged baseball analyst who writes from home surrounded by computers and cats, and his team is on the brink. Texas is coming off a sweep of the Cleveland Guardians, but those three wins only got the team back to the .500 mark, with a 9-13 record for August. Read the rest of this entry »
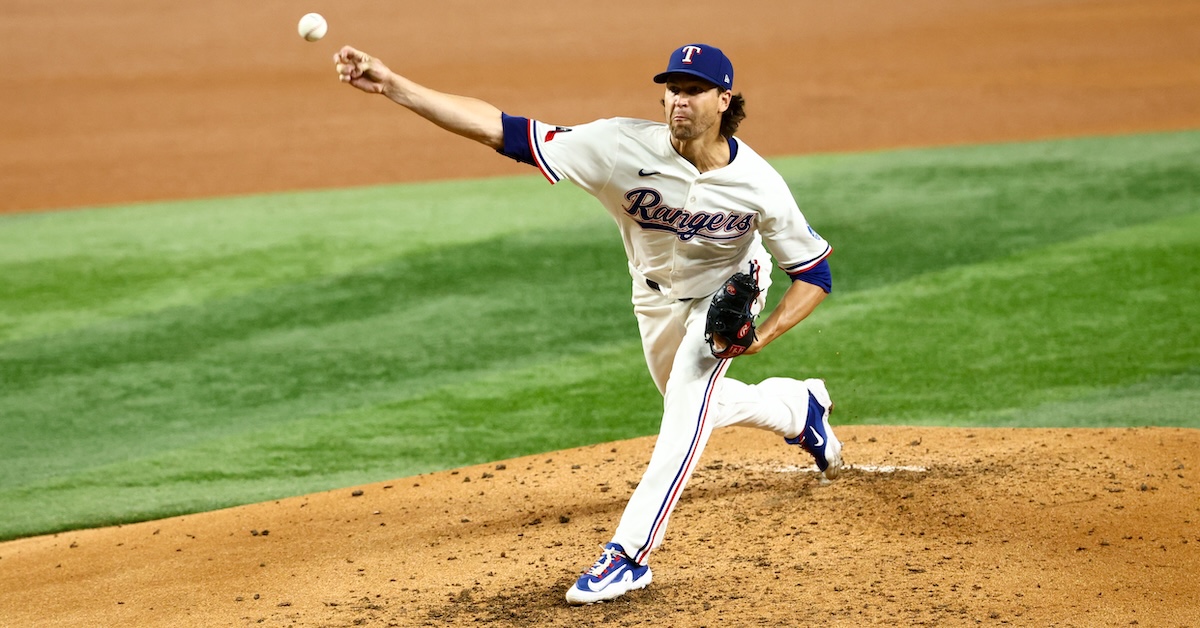
Earlier this week, my colleague Jay Jaffe touched a bit on Jacob deGrom and his Hall of Fame case. Since the world can always use more sentences describing how awesome deGrom is, and because I’m fascinated by how his Hall of Fame case will look to voters sometime in the mid-2030s, I decided to dig a little more into his future candidacy and reasonable expectations for what the end of his career can add to his record. I also wanted to explore what deGrom’s case means for 2010s/2020s Hall of Fame starting pitcher representation more broadly.
This has been a concern of mine for a while, and I talked a bit about it last year in the context of Chris Sale’s marvelous comeback season. This piece has stuck with me as it was one of those rare articles in which the act of writing it changed my opinion somewhat. At the start, my thought process was “with a less than 50% chance of finishing with 200 wins, Sale probably won’t be in the Hall of Fame, and may be too borderline for even me.” But then I projected the rest of the league, and for the first time ever in ZiPS, not a single pitcher who hadn’t already passed 200 wins was projected to have a 50% chance of reaching that milestone. So, perhaps Sale should get to Cooperstown even if he falls short of that threshold, because if the writers don’t vote for him on the grounds that he didn’t get to 200 wins, how could we justifiably elect any future starting pitcher?
Active Pitchers with 100 Career Wins As of June 2024
When I wrote last year’s piece, there were only 11 pitchers between 100 and 200 wins, a shockingly tiny number. And of those 11, only one is in a better position to win 200 games now than he was then: Sonny Gray, who has added 12 wins and is having a fairly typical season by his standards. As far as the other 10 are concerned… Gerrit Cole is out until well into 2026 due to elbow surgery, and Sale has missed a bunch of time this year from injuries. Lance Lynn and Kyle Gibson have both since retired, Johnny Cueto has all but officially done the same, and Carlos Carrasco and Dallas Keuchel are in the minors and, for the purposes of this exercise, might as well be retired. Wade Miley has one win this season and is currently out with forearm pain in his comeback from Tommy John surgery. Yu Darvish, who didn’t make his season debut until July, has moved only two wins closer to 200 in his age-38 season. As a Baltimore native, I’m not psychologically prepared to talk about Charlie Morton’s progress.
The good news is eight new pitchers have joined the 100-win club this season, but none of them look to be on a path to 200 wins right now.
Of these eight, only Nola projects with a 50% chance to get to even 150 wins. While it’s theoretically possible for most of the eight to get to 200 wins, it would require an unusually robust late-career surge. During the Wild Card era, only 10 pitchers have amassed 90 wins after their age-34 season, and almost all of them were in the early part of the era; pitcher workloads have continued to drop, and starting pitchers get fewer decisions than ever.
Rewind ZiPS a decade, and it gave 17 active pitchers a 50% chance to win 200 games. Nine eventually did hit that milestone, and Cueto, the only member of the other eight who is still technically active, isn’t going to do it.
So, let’s run the ZiPS projections for the remainder of deGrom’s contract with the Rangers, beginning in 2026 and running through 2028 — assuming Texas picks up his club option for that season. ZiPS was really worried about his health entering the season, for very obvious reasons, and while he just missed his most recent scheduled start due to shoulder fatigue, the injury is not believed to be a long-term issue. His projected workloads in future seasons have increased now that he’s stayed mostly healthy in 2025.
ZiPS Projection – Jacob deGrom
Year
W
L
ERA
G
GS
IP
H
ER
HR
BB
SO
ERA+
WAR
2026
8
5
3.50
26
26
138.7
117
54
19
31
149
116
2.7
2027
7
6
3.81
25
25
132.3
120
56
20
32
135
107
2.0
2028
6
6
4.20
23
23
122.0
117
57
20
32
119
97
1.4
Give deGrom the 21 projected wins for 2026-28 and a couple September wins this year, and that gets him to 123 for his career. In his piece, Jay brought up Sandy Koufax while discussing deGrom, and I think it’s an apt comparison.
Sandy Koufax vs. Jacob deGrom
Pitcher
W
L
IP
K
ERA
ERA+
WAR
Sandy Koufax (1961-1966)
129
47
1632.7
1713
2.19
156
46.3
Sandy Koufax (Career)
165
87
2324.3
2396
2.69
131
54.5
Jacob deGrom (Proj. Career)
117
80
1928.3
2253
2.82
141
52.8
Koufax’s peak was more concentrated and more impactful in individual seasons than deGrom’s, but as I said about Johan Santana when he was on the Hall of Fame ballot, if your best years are being mentioned in conversation with those of Koufax, you must have been a dynamite pitcher. To me, from a pure dominance perspective, Peak deGrom isn’t that far behind Peak Koufax; certainly, the gap isn’t wide enough to keep deGrom out of Cooperstown considering pretty much everyone views Koufax as a no-doubt, inner-circle Hall of Famer.
Of course, it’s an inauspicious sign for deGrom that I’m using Santana as the other not-quite-Koufax comp, given that Santana went one-and-done on the ballot. But I’m hopeful that time is on deGrom’s side here. Santana was knocked off the ballot in the 2018 election, and the demographics of BBWAA members who stick around long enough to earn a Hall of Fame vote have changed a lot over the last decade. In fact, the BBWAA didn’t open up membership to internet-based writers — a group that tends to be more versed in analytics — until after the 2007 season, and many of these stathead members couldn’t vote when Santana was eligible. That will be different by the time deGrom hits the ballot in roughly eight or so years.
By then, it’ll be nearly 20 years of writers seeing starter workloads change, and maybe voters will have figured out how to account for the fact that the role of a starting pitcher is very different in the 2020s than it was in the 1990s, let alone in the days of Old Hoss Radbourn. The trio of former Cy Young winners in their 40s — Justin Verlander, Max Scherzer, and Zack Greinke — will likely be in Cooperstown by the time deGrom hits the ballot. Clayton Kershaw is only three months older than deGrom, but considering the Dodgers icon debuted six years earlier, it feels all but guaranteed that he will be the first of the two to retire, meaning he will also enter the Hall before deGrom becomes eligible. If that happens, Kershaw will be the last of his kind to be voted in by the writers, setting the stage for a new standard for starters to make it to Cooperstown. That is, unless Kershaw is to be the last-to-debut Hall of Fame starting pitcher.
I can’t imagine that will be the case, but it is true that over the next decade, the BBWAA has some interesting philosophical questions to answer about the nature of starting pitcher greatness. I’m not sure what those answers will be, but I do know that deGrom will be instrumental in determining them.
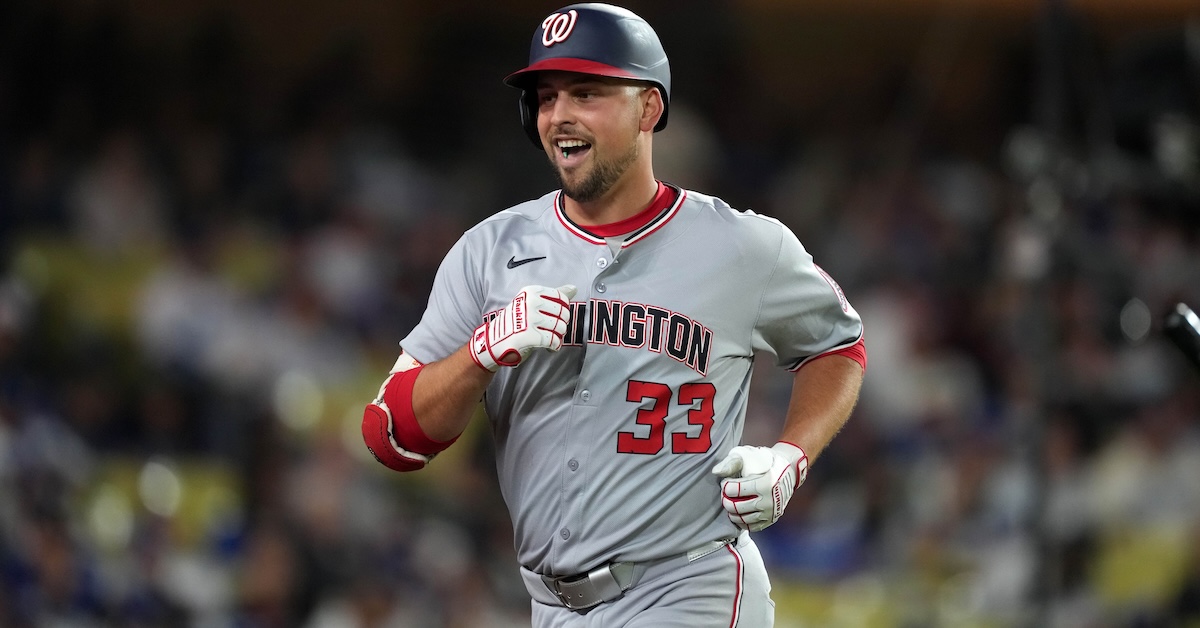
The Boston Red Sox addressed their hole at first base over the weekend, coming to terms with free agent Nathaniel Lowe, formerly of the Washington Nationals. Lowe has struggled in 2025, hitting .216/.292/.373 for an 86 wRC+ and -0.8 WAR, his worst showing as a professional.
I don’t think that anyone — not even a member of Lowe’s family — would object too strongly to the declaration that Lowe has had an abysmal season. Lowe has never actually been a star, but with a .274/.359/.432 four-year run from 2021 to 2024, averaging 2.7 WAR per season, he had at least established himself in that Serviceable B+ First Baseman category. The end of Lowe’s time in Texas came quickly, and after a Silver Slugger in 2022, a Gold Glove and a World Series ring in 2023, and another solid offensive campaign in 2024, he found himself tradable for pitching help (lefty Robert Garcia) after the team acquired Jake Burger for reasons that still confound me. The Nats were making noise about being competitive in 2025, and there was a reasonable expectation that Lowe would improve the position without requiring a major long-term commitment. Read the rest of this entry »
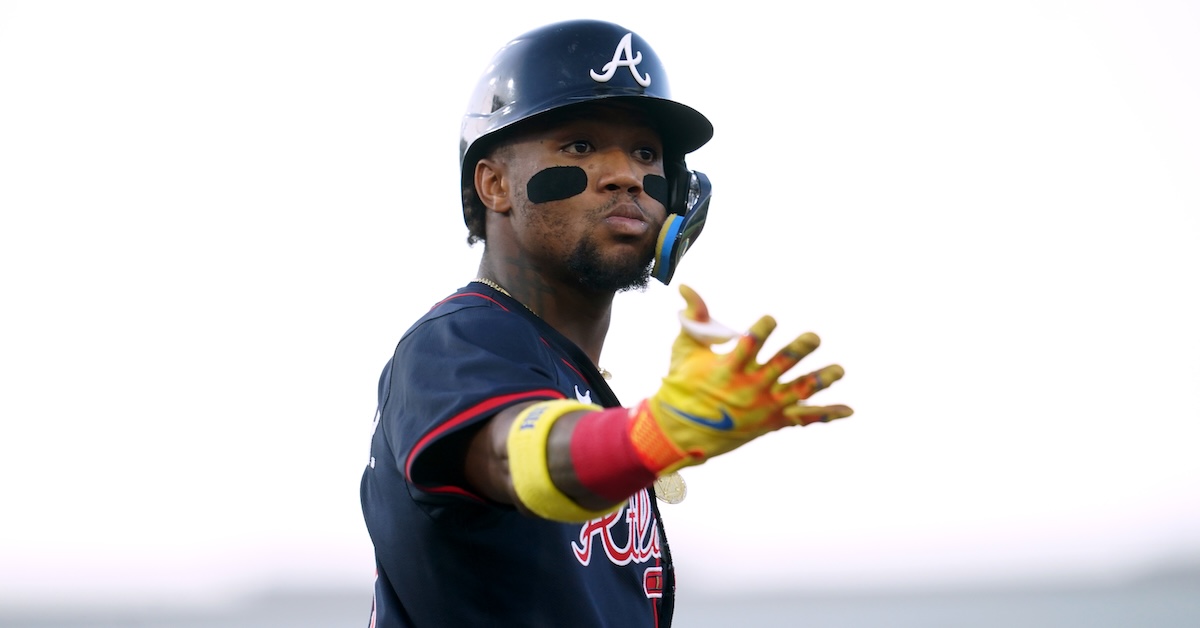
For the Atlanta Braves, the 2025 season is a disasterpiece. Last season had its share of disappointments, but the long stretches of middling play still left the Braves in a playoff spot by the tiniest of margins. After 2024, it was reasonable to stay the course; no need to smash the red panic button like an unsupervised child in an elevator. This time around, however, the Braves are likely to finish the season with somewhere around 90 losses, making simply battening down the hatches and waiting for sunnier weather a lot riskier of a strategy. I cranked up ZiPS to see how much tinkering the computer thinks Atlanta needs to do in order to compete in 2026.
The Good
On the plus side, the Braves aren’t trying to build a winning team out of nothing. Much of the offensive core remains intact and is actually functioning quite well. Ronald Acuña Jr. has made a successful return from a second torn ACL and has been playing at a 7-WAR pace. Of course, he’s out at the moment with another Achilles injury, but this appears to be a minor issue, relatively speaking, and given his history and Atlanta’s position in the standings, there’s no real reason not to be conservative with his recovery. ZiPS is understandably down on his injury risk, but he still gets his usual dynamite projection for 2026, even if it’s a little diminished from a playing time perspective:
STiVo: There are some prospects demolishing the minors (e.g., Wetherholt, Jones, Griffin). How high do you think ZiPS will be on those kinds of guys going into 2026?
12:01
Dan Szymborski: CHEATING!
12:01
Dan Szymborski: trying to get some early projections! tsk tsk
12:01
Dan Szymborski: sorry
12:01
Dan Szymborski: Wetherhold ought to have a big number