Creating a Projection for Munetaka Murakami

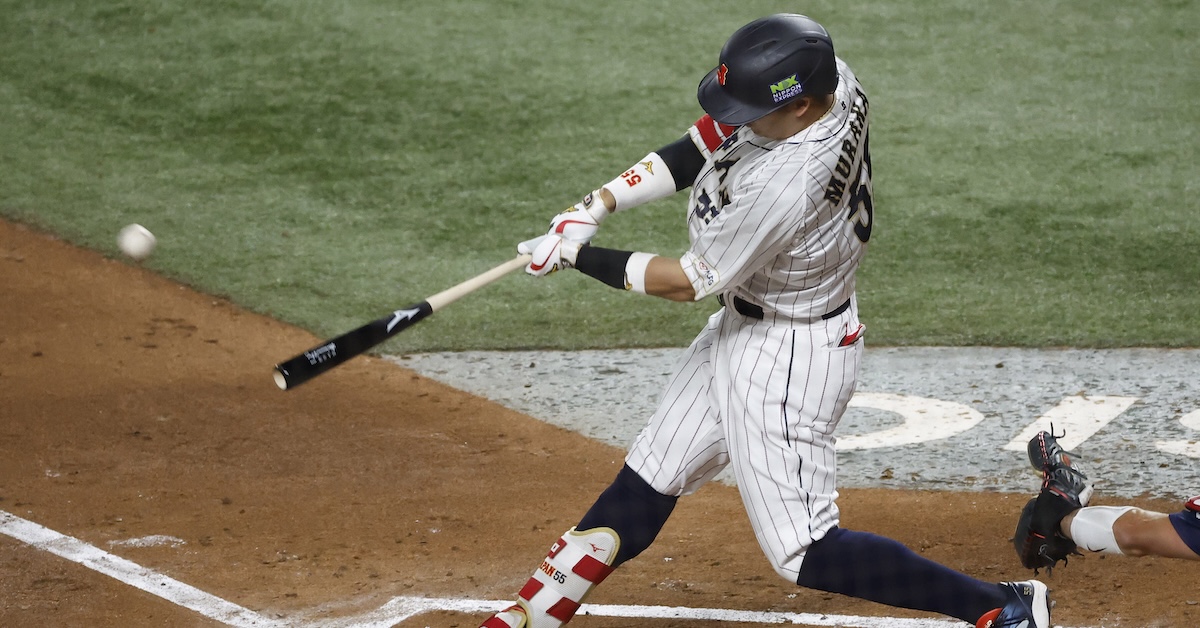
What sort of production can we expect from Munetaka Murakami in 2026? This article walks through my steps in creating an MLB projection for the Yakult Swallows superstar.
With one day to go before his negotiation window closed, Murakami and the Chicago White Sox agreed on a two-year, $34 million deal; you can read Michael Baumann’s thoughts on the signing here. Both the dollar amount and the length fall well short of expectations: Ben Clemens projected him to land a seven-year, $154 million contract, while our median crowdsourced contract estimate was for six years and $132 million. Prior to Murakami’s posting, Eric Longenhagen highlighted his 80-grade raw power, as well as his major contact issues, in an October international players update. Both Eric and Ben saw first base as Murakami’s likely defensive home, something the White Sox have already confirmed for the coming season. ZiPS projects him for a .237/.363/.454 triple-slash line and a 126 wRC+. My own projection system, OOPSY, does not yet project NPB players, but that’s something I’m aiming to change with this article. So what might OOPSY expect from Murakami?
The first step in creating a Murakami projection was to review the literature. Previous research from team scouts, analysts, and the creators of other projection system tends to rate NPB as close to Triple-A in terms of its quality of competition. This serves as a good reference point for developing my own quality of competition estimate. Read the rest of this entry »


