With five hits in a three-game span against the Diamondbacks and Mets, Paul Goldschmidt finally got off the interstate — to use former All-Star-turned-broadcaster Ken Singleton’s memorable term for hitters with a batting average below .200 — but as the end of April approaches, the 36-year-old first baseman has nonetheless produced at a sub-replacement level thus far. It’s early, but he’s got some company in that department among former All-Stars, as well as some high-profile free agents both past and future.
Goldschmidt won the National League MVP award in 2022, hitting a robust .317/.404/.578 with 35 homers; he led the league in both slugging percentage and wRC+ (176) while totaling 6.9 WAR. His value slipped to about half of that last season (3.4 WAR) as he batted .268/.363/.447 (122 wRC+) with 25 homers — respectable by most standards, but the lowest slugging percentage of his 13-year career to that point. Right now, both he and the Cardinals would gladly settle for that batting line, as he’s hitting just .208/.304/.287 with two homers, a 74 wRC+, and -0.3 WAR.
Goldschmidt is hardly the Cardinals’ only hitter who is struggling. Last week, the team optionedJordan Walker, who was carrying a .155/.239/.259 (44 wRC+) line, back to Triple-A Memphis, but that hasn’t exactly cleared up the problem. Nolan Gorman (77 wRC+) and Lars Nootbaar (81 wRC+) have been terrible as well, and their center fielders, Michael Siani and the since-demoted Victor Scott II, have combined to “hit” .095/.170/.131 (-7 wRC+) en route to a net -1.0 WAR. Small wonder the team is second-to-last in the NL in scoring at 3.57 runs per game. But this dive isn’t so much about the Cardinals as it is about Goldschmidt, whose offensive profile looks as though it has aged 10 years in the past two. After going 3-for-4 with a home run off the Dodgers’ Tyler Glasnow on Opening Day, he went 92 plate appearances (of which just 12 were hits) before collecting his second extra-base hit. He’s up to four now, having doubled both on Wednesday and Saturday. Read the rest of this entry »
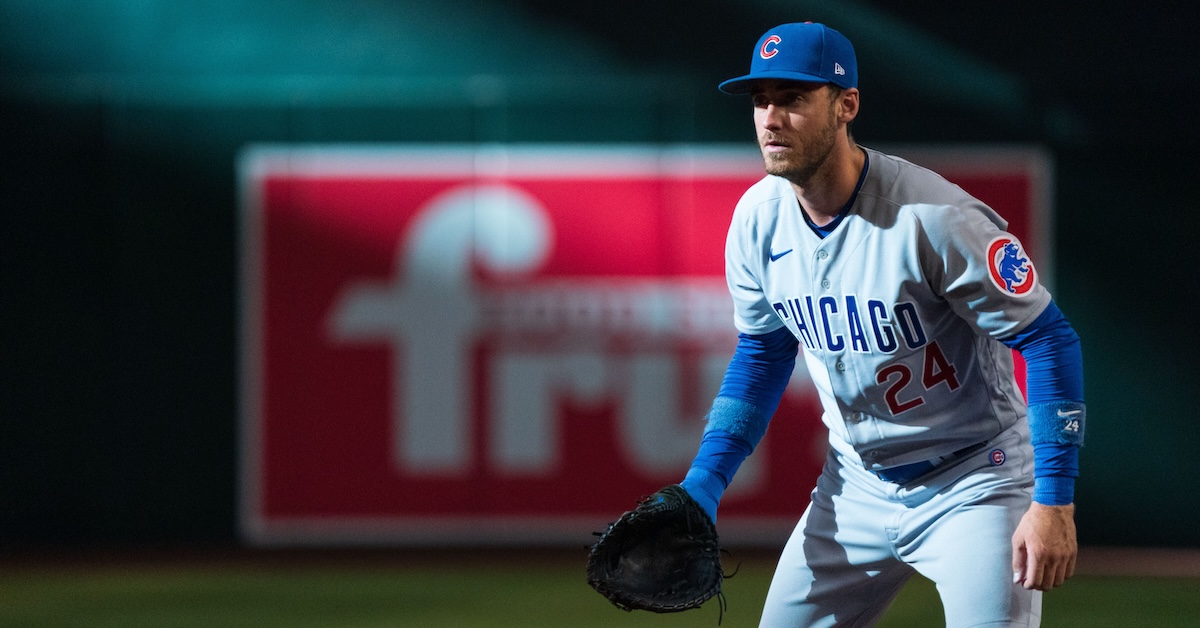
Ribs have been in the headlines this week, but sadly, not as part of a review of exciting new ballpark barbecue offerings. On Monday, Triston Casas was diagnosed with a fractured rib on his left side, an injury that will result in a prolonged absence and comes at a time when the Red Sox infield has already been depleted. On Wednesday, the Cubs’ Cody Bellinger was diagnosed with fractured ribs on his right side, interrupting his rebound from a slow start.
The 24-year-old Casas left Saturday’s game against the Pirates after injuring himself while fouling off a Mitch Keller pitch. He was initially diagnosed with a strain in his left rib cage and was placed on the injured list on Sunday. An MRI taken on Monday revealed a fracture as well, and the presumption is that his absence will be a long one given that the damage involves muscle and cartilage as well as bone. “Timetable, there’s none. It has to heal on its own. We’ve just got to be patient,” said manager Alex Cora. That sounds like a trip to the 60-day IL could be in order. Read the rest of this entry »
Monday afternoon’s game between the A’s and Yankees ended in impressive fashion for Oakland, with closer Mason Miller buzz-sawing through the top of New York’s lineup to close out a 2-0 victory. The 25-year-old righty struck out Anthony Volpe, Juan Soto, and Aaron Judge consecutively on 14 pitches, mixing eight four-seam fastballs — all with velocities above 100 mph — with four nasty sliders. He absolutely overpowered Judge:
Those fastballs Judge flailed at were clocked at 100.7 mph, 102.2 mph, and 102.5 mph, the last of which wasn’t quite as fast as the 103.3-mph heater Miller used to strike out Soto. Whoosh! Read the rest of this entry »
Thanks to an eight-run fifth inning that included Andy Pages‘ first major league home run, the Dodgers beat the Mets 10-0 on Sunday to avoid being swept at home. Even so, they’re off to a sluggish start this season after committing nearly $1 billion in free agent contracts this past winter and pushing their payroll to a club record $314 million. Maybe they’re not the juggernaut that figure suggests, though even given their star-laden roster, they came into this season as a work in progress.
The Dodgers entered Sunday having lost seven of their past nine games. They dropped the finale of a six-game midwest road trip to the Twins, then two of three to the Padres at Chavez Ravine, followed by two of three to the Nationals and two in a row to the Mets. The skid undid a 10-4 start, and they were in danger of — gasp — sinking to .500 had they lost on Sunday. They weren’t exactly getting steamrolled by powerhouses, either. The aforementioned teams had a weighted projected winning percentage of .472 at the outset of the season, and finished Sunday having produced a .453 winning percentage outside of this nine-game stretch against Los Angeles.
For the Dodgers, run prevention has been the biggest issue. Even with Sunday’s shutout — their first of the season, with eight dominant innings from Tyler Glasnow and one from Nick Ramirez — they’re allowing 4.54 runs per game, 11th in the National League. While they haven’t allowed runs at that clip over a full season since 2005, they allowed exactly the same number of runs over their first 24 games last year while going 13-11, then picking up the pace and winning 100 games. Déjà vu all over again? Read the rest of this entry »
No manager defined the era of baseball marked by artificial turf and distant outfield fences as Whitey Herzog did. As the manager of the Royals (1975–79) and Cardinals (1980, ’81–90) — and for a short but impactful period, the latter club’s general manager as well — he assembled and led teams built around pitching, speed, and defense to six division titles, three pennants, and a world championship using an aggressive and exciting brand of baseball: Whiteyball. Gruff but not irascible, Herzog found ways to get the most out of players whose limitations had often prevented them from establishing themselves elsewhere.
“The three things you need to be a good manager,” he toldSports Illustrated’s Ron Fimrite in 1981, “are players, a sense of humor and, most important, a good bullpen. If I’ve got those three things, I assure you I’ll get along with the press and I guarantee you I’ll make the Hall of Fame.”
Herzog was finally elected to the Hall in 2010, an honor long overdue given that he was 20 years removed from the dugout and had never been on a ballot. He passed away on Monday in St. Louis at the age of 92. Read the rest of this entry »
Coming up through the Dodgers system, Michael Busch gained a reputation as “a bat-only prospect,” a player whose offensive skills far outpaced his defensive ones. So when the Dodgers landed Shohei Ohtani in December, it closed the door on the team finding room for Busch as a DH, and they were already set at first base — Busch’s main position in college — with Freddie Freeman in the fold. Busch needed a trade to clear his path, and in January he got one, a four-player deal with the Cubs. So far, the 26-year-old rookie is off to a flying start, ranking high on the leaderboards after reeling off a streak of five consecutive games with a home run.
Busch’s streak, which ended on Tuesday night in Arizona, took place during the Cubs’ nine-game western road trip, beginning with a game-tying two-run homer off the Padres’ Dylan Cease at Petco Park on April 10. Two days later in Seattle, he went deep off the Mariners’ Ryne Stanek. The Cubs lost both of those games, but he helped them win three straight, starting with a solo shot off Tyson Miller in the seventh inning of a 4-1 win Saturday night, then a two-run homer off Luis Castillo in the fourth inning of a 3-2 win on Sunday. Moving on to Arizona, he didn’t waste any time, connecting off Merrill Kelly in his first plate appearance of Monday’s game, an 11-inning, 3-2 win. Read the rest of this entry »
Jay Jaffe: Good afternoon, folks, and welcome to my Tuesday chat. Apologies for the technical glitch in terms of the pre-chat queue but we should be up and running.
2:01
Jay Jaffe: Pouring one out for Whitey Herzog, the Hall of Fame manager best known for piloting the Cardinals to the 1982 championship and two other pennants.
2:03
Jay Jaffe: And pouring another one out for Carl Erskine, a true mensch who not only helped the Dodgers to five pennants and their 1955 championship — and threw two no-hitters as well — but became “a fierce champion of human rights, racial equality and, when his late son Jimmy was born with Down syndrome, became immersed in fighting for people with special needs.”
WinTwins0410: Jay, I hate to “remember some guys” too much to start a chat, but it seems like we’ve lost a lot of interesting baseball guys lately — Ken Holtzman, Whitey Herzog, Carl Erskine, Fritz Peterson, Jerry Grote and even Pat Zachry. Curious if you plan to do a full-on article about Whitey. I am hoping you will!
2:04
Jay Jaffe: Forgot about Holtzman, who was a big part of the A’s three straight championships and holds the record for most wins by a Jewish pitcher (174).
2:05
Jay Jaffe: I’m thinking about whether I can pull off a Herzog tribute in a timely fashion.
The Astros have dominated the American League West in recent years, winning three straight division titles and six out of the past seven, and getting at least as far as the American League Championship in each of those years. Their quest to extend that run is off to a rocky start, however. Despite taking two out of three from the Rangers this weekend in Houston, they own the league’s second-worst record thus far at 6-11, ahead of only the White Sox (2-13).
Even with the series win over the Rangers — whom they’ve now beaten in four out of seven games while going 2-8 against their other opponents — the Astros are off to their worst start since 2016, when they went 5-12. Notably, that season was the last one in which they missed the playoffs. Their 4-11 record through Friday was their worst through 15 games since 2013, the year they lost a franchise-record 111 games. That said, this is their fifth straight season below .500 at this juncture:
On the heels of a 101-loss season and a trade of Dylan Cease, it was quite apparent that the White Sox would be bad this year. So far, however, they’ve been even worse than that, losing 10 of their first 12 games to become the first AL team whose Playoff Odds have reached zero. Adding to that insult, they’ve already lost Eloy Jiménez, Luis Robert Jr., and Yoán Moncada — the three players who projected to be their most valuable — to injuries, sadly an all-too-common occurrence when it comes to each of them. It’s going to be a long season on the South Side.
The most severe of the injuries is that of Moncada, and woof, it not only looked bad but it may mark the end of his run with the White Sox, one that has certainly contained its share of highs and lows. While running out a grounder in the second inning of Tuesday’s game against the Guardians, he suddenly started limping about halfway down the line, then stumbled and crumpled to the ground before reaching first base, writhing in agony before being tended to by head athletic trainer James Kruk. “When I was running down the line, it felt like something broke. Honestly, that was the worst pain I’ve felt in my career,” Moncada told reporters via an interpreter on Wednesday.
Moncada was diagnosed with a strained left adductor, one of the muscles of the inner thigh, and yes, this will be a recurring theme. You don’t have to believe in jinxes to cringe at the fact that in the pregame media session before Moncada’s injury, manager Pedro Grifol told reporters that the 28-year-old third baseman had been dealing with a nagging hip/adductor injury for three or four days, adding, “He’s doing a really good job maintaining it.” Thus a minor injury has become a major one; the team announced that Moncada’s estimated recovery time is three to six months. In a best-case scenario, that would place his return around the start of the second half, while in a worst-case one, he might not make it back onto the field again this season.
Moncada is already coming off a pair of injury-wracked seasons that took a significant toll on his performance. After hitting for a 120 wRC+ with 3.7 WAR in 144 games in 2021, he slipped to a 76 wRC+ and 0.8 WAR in 104 games in ’22, missing five weeks due to an oblique strain and then 10 days for strains in each hamstring. He rebounded slightly in 2023, hitting .260/.305/.425 (98 wRC+) with 1.1 WAR, but still played just 92 games, missing over 10 weeks due to a pair of IL stints for lower back inflammation. He was off to a good start this season, hitting .282/.364/.410 (127 wRC+) while showing improved plate discipline through his first 44 plate appearances.
He is now in the final guaranteed season of the five-year, $70 million extension he signed in March 2020, making $24 million this year with a $25 million club option and $5 million buyout for 2025. Given the trends of his performance and Chicago’s payroll — which declined from $193 million in 2022 to $177 million to ’23 to $148 million this season as both the old and new regimes have stripped the roster for parts — it’s unlikely the team would have picked up his option. More likely, general manager Chris Getz would have looked to trade him this summer in an effort to fortify a farm system that got a shot in the arm last year, rising from 27th in projected future value in the spring to 12th later in the season.
Grifol said the team will rotate among a trio of players to fill in for Moncada, with 29-year-old lefty Nicky Lopez, 26-year-old lefty Braden Shewmake, and 24-year-old righty Lenyn Sosa all in the mix. None of them has hit a lick at the major league level, with Lopez — who has started eight games at second base and one at shortstop so far this year — the best of the bunch with a career 72 wRC+ across more than 1,900 PA; Sosa owns a 43 wRC+ through 224 PA, while Shewmake has a 50 wRC+, but only 25 PA so far. Each of them is a huge step down from Moncada, to say the least.
Robert isn’t expected to be out as long as Moncada, but his absence is depriving the White Sox of their lone All-Star from last year and their most dynamic player. The 26-year-old center fielder left Chicago’s April 5 game after injuring himself running out a double, and was diagnosed with a Grade-2 flexor strain in his right hip, the same one in which he suffered a Grade-3 strain in 2021. He missed about three and a half months that time, but this time around he’s only anticipated to be out six to eight weeks, with “only” doing a lot of work here.
The shame of it is that Roberts is coming off the closest thing he’s had to a full season in a while. His 145 games played last year was the highest total of his four major league seasons, topping his 98 games from 2022, when he made trips to the IL for COVID-19, blurred vision, and a wrist sprain; the only other time he played at least 100 games in a season was 2019, when he tallied 122 while rocketing through three levels of the minors. Even as the team collapsed around him last season, he put together an outstanding campaign, hitting 38 homers and stealing 20 bases while hitting .264/.315/.542 (128 wRC+) with 4.9 WAR. His slugging percentage and home runs both placed third in the American League, his wRC+ and WAR, eighth.
Robert was hitting just .214/.241/.500 at the time of his injury, with a two-homer, three-hit, four-RBI game against the Tigers on March 30 accounting for the bulk of his contributions. Thus far in Robert’s absence, Grifol has shifted his right field platoon over to center. That pairing — 26-year-old lefty Dominic Fletcher and 35-year-old righty Kevin Pillar — along with various other players in smaller roles placed the White Sox 28th in the right field version of our preseason positional power rankings. Meanwhile, Robert drove their no. 5 ranking among center fielders, but with his playing time reduced, he and his replacements have dropped to 12th in our Depth Charts. Somebody ought to put up a warning sign: “Beware of Falling Projections.”
As for Jiménez, he didn’t even make it to April, or to a spot in the outfield, before getting hurt. In the season’s third game, on March 31, the 27-year-old slugger strained an adductor in his left leg while running out an infield grounder and left the game. This marks his fourth straight season with a trip to the IL; in 2021 he missed four months due to a torn pectoral tendon, in ’22 he lost two and a half months to a torn tendon in his right knee, and in ’23 he was shelved 10 days for a left hamstring strain, and then three weeks for an appendectomy. Jiménez still managed to play 120 games last year, his highest total since his 2019 rookie season, but through his first five years, he played in only about 62% of Chicago’s games.
In the wake of last year’s early-season injuries, the White Sox used Jiménez in right field in just 14 games and DHed him 105 times. Keeping him off the grass is probably preferable given not only his fragile state but his defensive metrics (-22 RAA, -18 DRS, -9.8 UZR in 2066.2 career innings). That said, a DH-only role places a lot more pressure on him to hit in order to be valuable, and last year’s .272/.317/.441 (104 wRC+) translated to just 0.5 WAR, which doesn’t cut it. The good news is that Jiménez is on the mend, and could possibly return this weekend. In his absence, Gavin Sheets has gotten hot, batting .333/.455/.704 through 33 PA but [checks notes] none of our projections suggest he can maintain that.
In our preseason projections, Robert (4.0 WAR), Moncada (2.4), and Jiménez (1.9) occupied the team’s top three spots, with Andrew Vaughn (1.6) and Andrew Benintendi (1.5) the only other position players above 1.0. In other words, without this trio the Sox don’t have a single player who projects to be average or better in the lineup. These outages and this miserable start — which includes the lowest-scoring offense in the majors, at 2.42 runs per game — have dropped their already-abysmal win projection from 66.3 as of Opening Day to 60.8. With the possible exception of the days that Garrett Crochet starts — he’s got a 2.00 ERA and 2.50 FIP through three turns — this is going to be an unwatchable team at least until Robert gets back.
We’re two weeks into the 2024 season — Seoul Series excepted — so it’s difficult to take any hot start too seriously. Still, it’s a surprise that the Pirates entered Thursday with the National League’s highest winning percentage (.750, on the back of a 9-3 record), despite losing to the Tigers 5-3 on Tuesday afternoon in Pittsburgh. Since this isn’t the kind of condition that has tended to prevail after April in recent years, we’ll zoom in for a closer look.
The Pirates entered 2024 having finished below .500 in five straight seasons and seven out of the past eight, with an 82-79 record in 2018 constituting the lone exception; last year’s 76-86 record was their best since then, a 14-win improvement over 2022. While they did not have a particularly auspicious winter, they didn’t sit still, with general manager Ben Cherington signing half a dozen players — including four former All-Stars (Aroldis Chapman, Yasmani Grandal, Martín Pérez, and Andrew McCutchen, the last of them re-upping) and a Gold Glove winner (Michael A. Taylor) — to one-year contracts worth anywhere from $2.5 million to $10 million, with a couple notable minor league deals as well (Domingo Germán and Eric Lauer). Cherington also made a handful of trades, most notably adding Marco Gonzales and Edward Olivares. The team’s biggest move was inking top starter Mitch Keller to a five-year, $77 million extension that suggests he’ll outlast all of the newcomers. Read the rest of this entry »