It could not have started worse. Yoshinobu Yamamoto’s first pitch of NLCS Game 2 was a 97-mph four-seam fastball to Jackson Chourio, the Brewers’ powerful leadoff hitter. Chourio promptly hammered it 389 feet into the Dodgers’ bullpen. It landed like a signal to the relievers milling out on the berm: Be alert, you might be needed sooner than you thought.
They would not be necessary. It’s hard to imagine a better pitching performance than that of Yamamoto’s teammate, Blake Snell, who delivered 10 strikeouts over eight innings the previous night. But Yamamoto managed to one-up him.
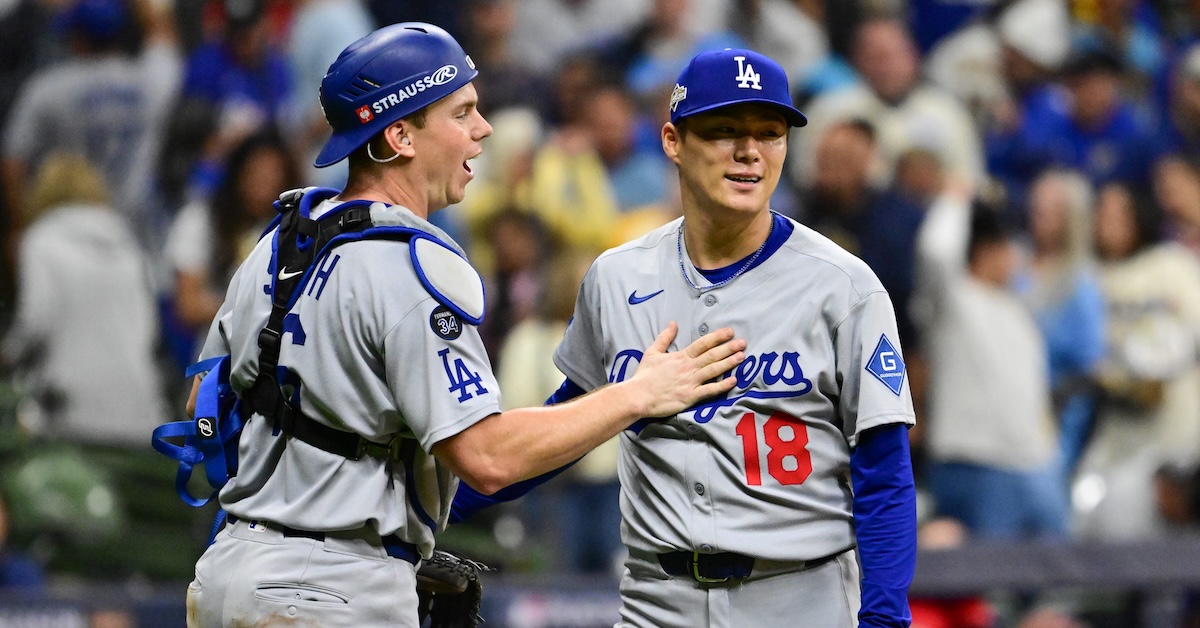
Over 111 magnificent pitches, Yamamoto rendered the Brewers’ bats rudderless, holding them to that single run over a three-hit complete game. It was the first in the playoffs in eight years, and it certainly offered one possible solution to the Dodgers’ bullpen woes: What if you just didn’t need those guys? Read the rest of this entry »
The margins were so thin on this first day of the 2025 postseason. Aces shoved, the games stayed close, and the high-leverage innings piled up; the first six teams to play combined for just 11 runs. At this unusual time of the year — when the patient regular season gives way to a best-of-three all-out sprint, when managers summon a flame-throwing reliever at the first sign of trouble — even a momentary slip in form can spell the end of the contest. And so it was for Hunter Greene in the third inning of the Dodgers’ (mostly) emphatic 10-5 win over the Reds in Game 1 of their NL Wild Card Series showdown. Greene faltered, the Dodgers capitalized, and Los Angeles gained a crucial series lead.
It seemed like this last game of the day would be yet another tightly contested pitchers’ duel. The Dodgers hurler, Blake Snell, headed into Tuesday night’s matchup in fine form, spinning a 2.01 FIP in September. He held up his end of the bargain, striking out nine Reds over seven innings, bullying the heavily right-handed lineup with hard heaters in and feathery changeups away. But for about 10 minutes, Greene was a touch off, and that was that. The Reds never really got back into the game after that four-run third inning, even as the shaky Los Angeles bullpen briefly stirred up a scene in the late innings. Read the rest of this entry »
If you’re familiar with Junk, it’s most likely due to his excellent command: Among all starters with at least 70 innings pitched this season, his 3.0% walk rate ranks as the lowest. (In an excellent interview with David Laurila last month, Junk talked about training his command at Driveline over the winter.) Seeing Junk in last place on this leaderboard was like spotting a polar bear in Arlington, Texas — in other words, a sign that something was seriously amiss.
By all four components of the Kirby Index, Junk ranked poorly. But his vertical release point was particularly inconsistent, sitting dead last among pitchers in the sample. In my article from last year introducing the Kirby Index, which I linked to above, I found that the ultimate location of the pitch is dictated almost entirely by release angles and release points. It follows that pitchers with inconsistent release points exhibit poor command. How was Junk varying his release point so frequently and still throwing so many strikes? Read the rest of this entry »
Here’s what I see: Brooks Lee lofts a soft fly ball 248 feet from home plate. Chandler Simpson circles it but loses a bit of momentum by the time it lands in his glove. Twins third base coach Tommy Watkins sends the not-particularly-fast Trevor Larnach (18th-percentile sprint speed). Shallow fly ball, slow runner, close play at the plate — Larnach slides in just ahead of the throw. It’s an exciting sequence, and I’ve missed an important part of it. Read the rest of this entry »
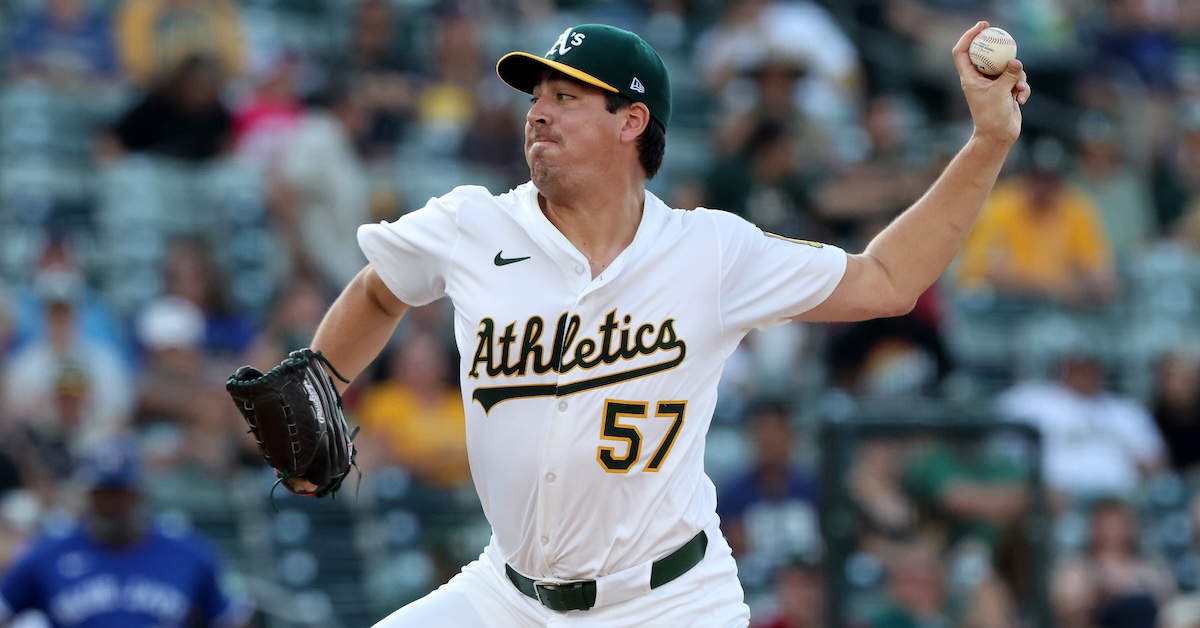
Straight away, I wrote Jacob Lopez off. Even as he strung together three incredible starts in June — 32% strikeout rate, one run allowed over 19 innings — I couldn’t bring myself to think it actually meant anything. A 27-year-old lefty with hardly any prospect pedigree and so-so command throwing 90 mph dead zone fastballs? Small sample weirdness, nothing to see here.
It’s harder to dismiss Lopez these days. Once again, he’s on an infernal heater, this one even more scalding than the previous iteration. His last three starts: five innings, no runs, five strikeouts against the Diamondbacks; 7.2 innings, no runs, 10 strikeouts against the Nationals; seven innings, no runs, nine strikeouts against the Rays. That’s a 34.3% strikeout rate and a 0.98 FIP in a 19.2 inning sample.
Some of this is the quality of the opposition; the Rays and Nationals have been among the worst offenses in baseball over the last month or so. But the overall sample is getting uncomfortably significant. Over his 84.2 innings pitched this year, Lopez holds a 28.9% strikeout rate, eighth — eighth! — among all pitchers (minimum 80 innings pitched). He’s striking out more hitters than Paul Skenes, Jacob deGrom, and Spencer Strider. Read the rest of this entry »
There’s no such thing as a perfect pitcher. There are guys with an incredible ability to spin the ball, but nothing to throw for whiffs at the top of the zone. (Mitch Keller and Matt Brash come to mind.) Some pitchers pump backspin four-seamers, but never settle on a reliable secondary. (Ryne Nelson, I’m looking at you.) Excelling at one thing often means being deficient at another.
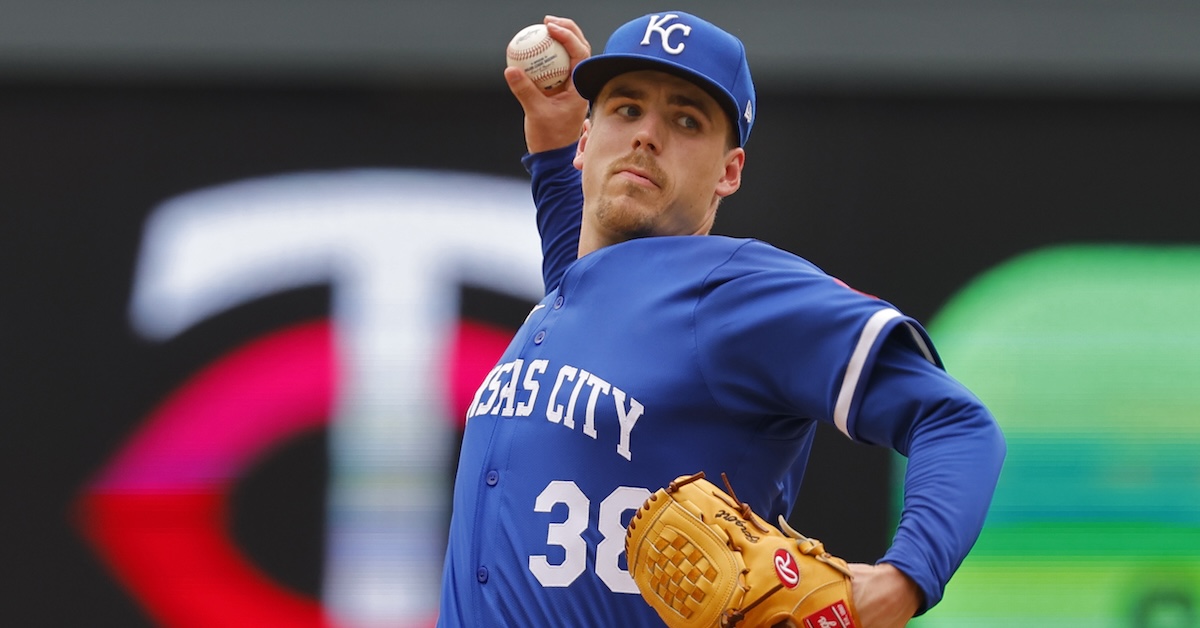
Still, even if there are no perfect pitchers, there are some who come closer than others. Prime Gerrit Cole featured a carry heater and a firm slider with meaningful horizontal break. Jacob deGrom? Same deal. Some guys break our general understanding of the tradeoffs between certain pitch types. Most of those guys are aces. One of them is Ryan Bergert — at least potentially.
If that name rings a bell, it’s likely because Bergert featured in a deadline deal that brought him to Kansas City (along with Stephen Kolek, a rock-solid fifth starter type) in exchange for backup catcher Freddy Fermin. In these early days following the trade, Fermin is acquitting himself well, lining a bunch of base hits and striking out just once so far.
Fermin is valuable — especially to the catcher-deprived Padres — though not particularly exciting. He’s under team control for the rest of the decade, but he’s firmly locked into the “light-hitting backstop with excellent defensive skills” archetype. Bergert, on the other hand, strikes me as a guy with serious upside. Read the rest of this entry »
For Twins fans, the Louis Varland deal was something like the final straw. Parting with Willi Castro could be forgiven — his contract was up at the end of this season. Jhoan Duran and Griffin Jax — okay, they were under team control through 2027, but you could convince yourself that the deadline is the best time to part with a premium reliever, and look at the return. Dumping Carlos Correa and the majority of his contract on the Astros was definitely a feel-bad move, but it was also one that was requested by Correa himself after the Twins made clear that they were headed into a rebuilding phase, and the back half of that deal might look pretty bad from a production standpoint.
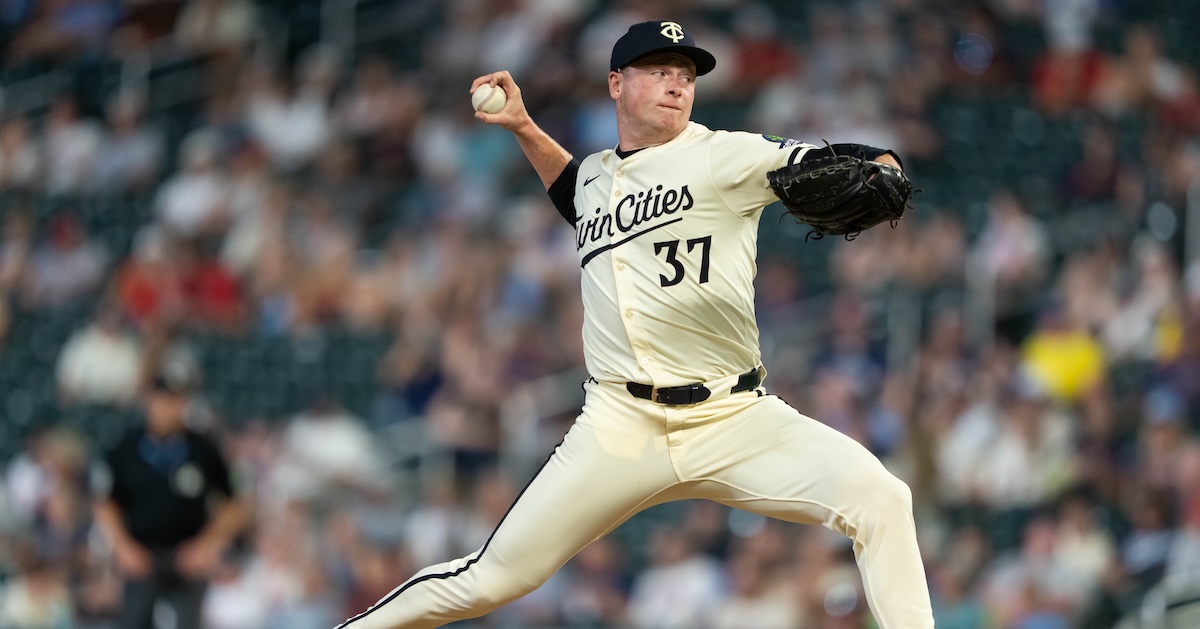
But giving up on Varland defied any reasonable explanation. He grew up in Minnesota, played his college ball there, and was brought into the Twins organization as a 15th rounder in the 2019 draft. From these humble hometown beginnings, he developed into a fire-breathing bullpen monster. Varland sits 98 mph on his four-seam fastball; he’s under team control until 2030, and wouldn’t even hit arbitration until 2027. If there was ever a perfect closer to bridge from one competitive Twins era to the next, it would’ve been Varland.
Instead, the front office sent him (along with Ty France) off to Toronto in exchange for outfielder Alan Roden and left-handed pitcher Kendry Rojas. On the merits, it’s a reasonable return; Roden can really rake, and Garcia is a legitimate pitching prospect close to the big leagues. Read the rest of this entry »
At the time of this writing, the Kansas City Royals’ playoff odds sit at 12%. They’re 54-55, 3.5 games back of the third AL Wild Card, packed in tight with a bunch of average teams chasing the major contenders, including the Rangers, Guardians, Rays, and Angels. (I’m going to go ahead and count the Twins out.) It’s a tough spot. You don’t necessarily want to go all in with a 12% chance of making the playoffs, but it’s a good enough shot that a sell-off would go down pretty poorly.
Threading this needle with precision, the Royals made a series of moves that filled key roster holes without gambling away any significant long-term pieces. The first of those went down yesterday morning, when they picked up two solid, controllable right-handers in Ryan Bergert and Stephen Kolek in exchange for backup catcher Freddy Fermin.
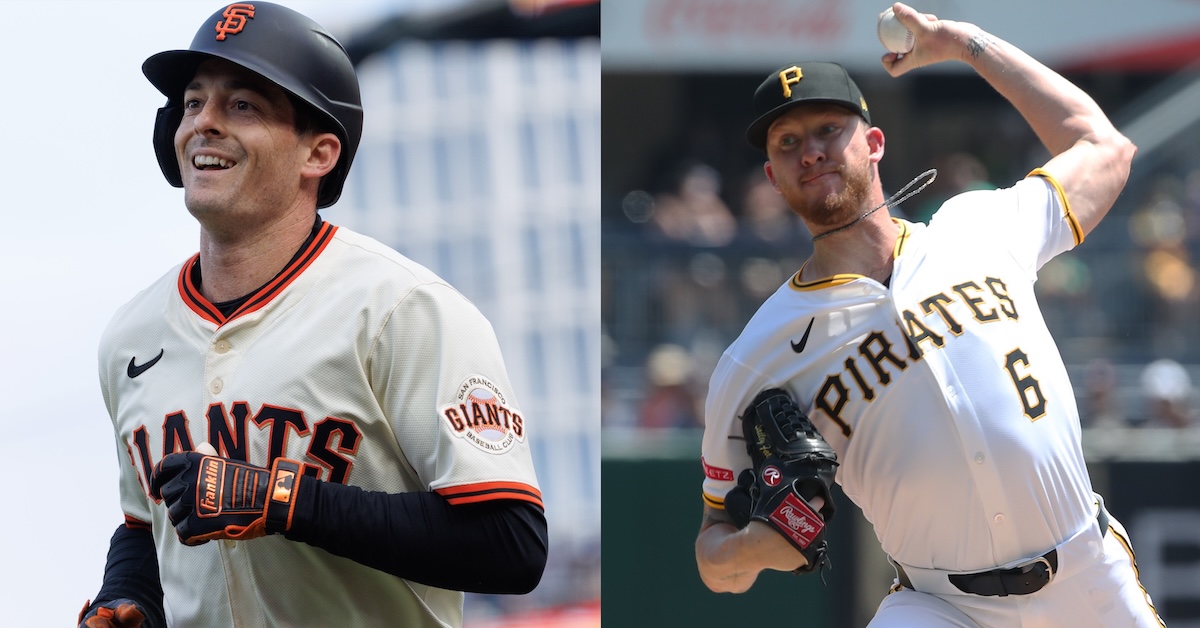
Later in the day, the Royals made two more trades. The first further shored up a depleted rotation; the second improved a truly abysmal outfield. First, they brought in lanky left-hander Bailey Falter from the Pirates, parting with up-and-down lefty Evan Sisk and Callan Moss, a first baseman with a .790 OPS in High-A who went undrafted in 2024. And a few minutes after the deadline passed, Jon Heyman reported that they’d picked up Mike Yastrzemski from the Giants for A-ball hurler Yunior Marte. Read the rest of this entry »
In a deadline where things are shaping up to be a little spicier than anticipated — Mason Miller for Leo De Vries and friends, holy cannoli — Steven Matz’s arrival in Boston in exchange for first base prospect Blaze Jordan feels destined to get swept under the rug. But wait, don’t look away yet. This season, Matz shifted to short-term relief work for the first time in his career, and the results have been impressive. In 55 innings, he’s delivered a 2.87 FIP, mostly on the strength of a minuscule 4% walk rate and excellent home-run suppression.
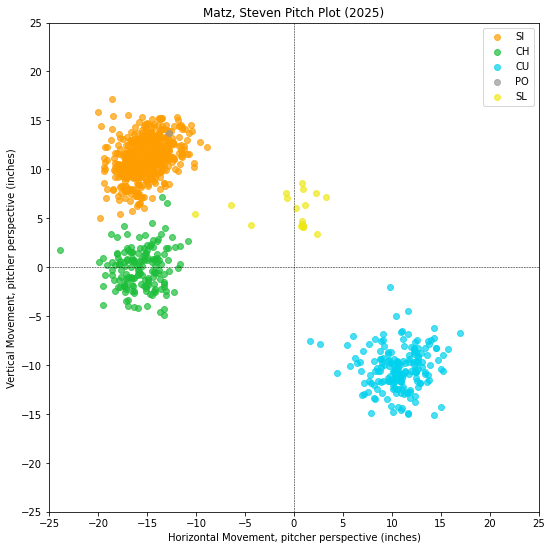
Matz hasn’t really overhauled anything about his arsenal with his move to the ‘pen. His heater is up maybe a tick, but it’s still the same fundamental Matz package, remarkably unchanged since his 2015 debut: heavy sinker usage, a slow two-plane curveball, and a changeup to mix in against right-handed hitters:
The lateral movement and lack of carry on his sinker makes it a somewhat ineffective pitch against righties, but those same qualities render it a weapon against lefties. Same-handed hitters are hitting .179/.216/.226 against Matz this season, good for just a .199 wOBA. Among pitchers who have thrown at least 250 pitches to lefties this season, he ranks 13th best in wOBA allowed.
Early in counts, Matz pounds the outside edge with that sinker. The precision aim — he zones the pitch nearly 65% of the time while aiming for a fine target — gets him a ton of called strikes, allowing him to frequently work with count leverage. Armed with an edge, Matz deploys his loopy curveball as his preferred put-away option. It doesn’t get a ton of whiff, but it’s also tough to elevate. And if he sneaks it through the front door, there’s just no way a hitter is swinging:
From a roster fit perspective, the move seems a bit curious. According to RosterResource, Matz will be the fifth lefty in Boston’s ‘pen. Aroldis Chapman is the closer, so he doesn’t really count, but between Justin Wilson, Brennan Bernardino, and Chris Murphy, it may look like the Sox are well-covered on the lefty specialist front. But a closer look suggests why they might not want to stand pat with that crew.
Let’s take them in reverse order. Murphy is an up-down guy, throwing just 16.2 innings in the major leagues this season. Alex Cora and co. probably aren’t going to feel comfortable thrusting a guy that green into high-leverage work during a big playoff series. He might even get optioned to clear room for Matz.
Bernardino is a guy who has been around a while, and does have a prototypical lefty-killer arsenal: a sinker that hovers around the zero induced vertical break line from a super-low release point, and a “curveball” (it’s a sweeper) that breaks nearly three feet in the other direction.
The problem? Bernardino sits 91 mph and walks a ton of guys. Thinking about a future where the Red Sox need to get through, say, Josh Naylor and Dominic Canzone to stave off an ALCS sweep at the hands of the Mariners, it’s a bit scary to have a guy throwing 91, with the distinct potential of walking two of the three hitters he is obligated by law to face. By contrast, Matz feels like a trusty pair of hands — he’s got the fourth-lowest walk rate among relievers with at least 40 innings pitched this year, and he’s a veteran with big-game experience.
But there is a third lefty, and he’s one of the dozen pitchers who’s actually been better against lefties this season than Matz. Wilson isn’t exactly Tim Hill. He throws from a high slot and gets a ton of fastball carry, and he pairs his heater with an 88-mph bullet slider he throws below the zone for whiffs. Even though it looks like a platoon-neutral north-south attack package, he’s been much better against left-handed hitters than righties, holding them to just seven hits (one double, zero homers) and five walks in 63 chances. Matz, at first glance, seems a bit redundant given the presence of Wilson. But I’ll get back to that.
As for the return: The Red Sox are sending Blaze Jordan to the Cardinals. On short-form social platforms, I saw a not-insignificant share of Boston fans lamenting the departure of such a premium prospect. Perhaps the enthusiasm can be attributed to his 80-grade name, or the sterling stats he posted in Double-A Portland earlier this year. The reaction suggests Jordan is an incredibly valuable prospect, not someone who Eric Longenhagen (favorably) compared to Ryon Healy in a recent write-up.
Jordan’s numbers in the high minors, as Eric noted, are impressive, and he’s relatively young for the level. But… well, instead of summarizing Eric’s report, I’ll just paste it here:
The chase is concerning when you’re talking about a bad corner defender. So many toolsier guys have been undone by that and that alone. Jordan is slow-of-foot and has well below-average range at third base, though he does other stuff well and could play there in a pinch. He has mostly played first base in 2025, and that’s his better position. Low-OBP first basemen need to have titanic power to be impact players, and while Blaze has meaningful pop, it’s not in Yordan Alvarez territory or anything like that.
Eric put a 40 FV grade on Jordan, which seems like a totally fair return for a reliever like Matz.
The last bit that’s curious about this deal: There just aren’t that many good left-handed hitters on the likely American League playoff teams. Of the teams with at least 15% playoff odds, there are only five qualified lefties with at least a 120 wRC+: Cody Bellinger (133), Riley Greene (133), Trent Grisham (127), the aforementioned Naylor (122) and Zach McKinstry (121). (Corey Seager, Jazz Chisholm Jr. and Addison Barger just missed the plate appearance cutoff, while Yordan Alvarez has yet to be activated from the IL.) That’s not exactly a murderer’s row. Given the lack of lefties in the way of their pursuit of a pennant, it does make one wonder why Boston would load up on lefty specialists.
But perhaps Boston is thinking optimistically. What if they find themselves in the first game of the World Series, and there are runners on first and second, and it’s the fifth inning, and Shohei Ohtani and Freddie Freeman are due up, and they need Wilson for the next time through the order. Hey, it’s a long shot — but if it comes through, the Red Sox will be awfully happy to have a reliable Matz in their pocket.
There’s been a lot of chatter about surplus value around these parts in recent days. As Ben Clemens wrote last week, surplus value informs a large part of a given player’s appeal as a trade target. Count up all the projected WAR remaining on a player’s deal, multiply it by the price of a single win, subtract the remaining cost of the contract, and what’s left over is an estimate of the player’s surplus value. Anything less than zero, and the contract can be considered underwater; if a contract is underwater, a team seeking to offload that player would expect to receive nothing of value in a trade return.
A couple of months back, my assumption was that Mitch Keller’s contract was ever-so-slightly underwater. The right-hander inked a five-year, $77 million extension in February of 2024. His first year on that deal was thoroughly mediocre: He made nearly every start, but posted a so-so 4.25 ERA/4.08 FIP. Over the two years preceding the deal, it was much of the same. His 4.13 ERA between 2022 and 2024 ranked 68th out of 106 pitchers with at least 300 innings pitched; his 3.92 FIP ranked 51st. The strikeout and walk rates were nearly dead-on league average.
Is a roughly 2-WAR starter worth tens of millions of guaranteed dollars? Your mileage may vary. Patrick Corbin went to the Rangers for $1.1 million after posting a 1.8-WAR season last year. Andrew Heaney got two years and $25 million after delivering 2.2 WAR. Nick Pivetta, notably younger than both of those guys but still three years older than Keller, signed with the Padres for four years and $55 million. If Keller had hit the open market after the 2024 season, when he put up 2.2 WAR in 31 starts (178 innings), I’d imagine he would have received a contract similar to what Pivetta earned after his 2.0 WAR and 145 2/3 innings. Perhaps Keller’s deal wasn’t terrible, but it also wasn’t something teams would be dying to get on their books.
But now it’s the peak of trade deadline season, and the 29-year-old Keller is a hot commodity. The Pittsburgh Post-Gazettereported last Tuesday that the Blue Jays are in on Keller. That’s in addition to reported interest from the Cubs, Mets and Yankees. Nearly half of the most serious World Series contenders are in on the Keller sweepstakes, suggesting that contract is now perceived as having surplus value. Perhaps this has something to do with the haggard state of these teams’ rotations, but I’m inclined to believe that isn’t the entire reason. Read the rest of this entry »