Author Archive

Are Umpires Expanding the Strike Zone as the Season Goes On?

David Ortiz of the Boston Red Sox recently complained that the strike zone has been expanding as the season has gone on. He stated that the zone is growing in order to speed up the games. I decided to have a look to see if there was validity to this statement

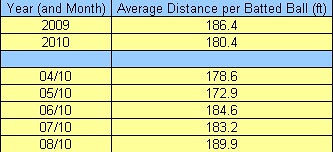
I examined the area of the strike zone where about 50% of the time a pitch taken is called a strike and the other 50% of the time it is called a ball. This zone is just smaller than the rule book strike zone. Here is the percentage of called strikes strikes compared to the sum of called strikes and balls for each month and year:

percent

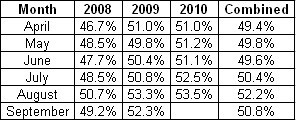
Note: Combined September data should be taken with a grain of salt because none is available from 2010 and this year more pitches generally are being called strikes.

As a rule, the number of pitches called strikes in this zone increase by ~ 2.5% from the beginning of the season to the end. The called balls and strikes thrown into this zone account for only 12.4% of all pitches throw over the time frame. This works out to 0.3% of all pitches during a game — or, in a 300-pitch game, one extra pitch that is called a strike versus a ball. Not that much difference.

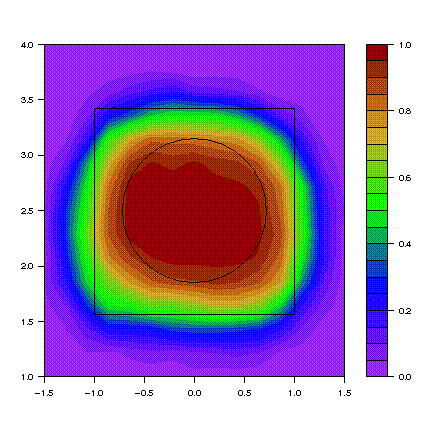
To further show the difference, here are the called strike zones of all umpires from 2008 to 2010 for right-handed batters in the months of April and August.

Note: The numbers indicate the decimal format of the percentage of pitches that are called strikes. The circle means nothing, it is just used for visual reference.

April

4_April_Right

August

8_August_Right

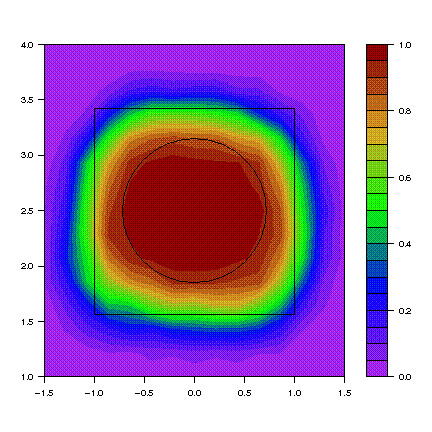
The zone extends a bit on the right and left parts of the plate, but not that much. There seems to be some increasing of the zone over the season, but it is not that much for teams or players to worry about.


Jay Bruce and Batted Ball Distance

Yesterday, our own David Golebiewski, looked at how Jay Bruce was progressing at the plate. In the comments, Jason461 noted that Bruce broke his wrist last season on July 12th and the injury could be the cause of some of his problems. Also, Jason461 stated that it takes about a year for a player to return to previous production when recovering from a wrist injury.

I have always followed players with wrist injuries after breaking my own wrist at the ripe old age of 20. Fourteen years later, my wrist is still not right. I, personally, don’t believe players can come back 100% after being off only one month for a broken wrist like Bruce.

I have previously looked at the effects of wrist injuries on individual players using spray charts. I have extended that analysis to Bruce. Here is a look at Bruce’s 2009 (pre-injury) and 2010 spray charts (images courtesy of texasleaguers.com):

2009 pre-injury:

2009beforeinjury

2010:

2010

One noticeable difference is the lack of of deep power in 2010 to all fields compared to 2009.

I decided to make sure my eyes weren’t playing tricks on me and look at the average batted ball distance of all his batted balls (excluding bunts). I used a process I documented previously for determining the batted ball distance. The data is from MLB and marks where the fielder gets the ball, not where it lands. Though this data is not perfect, it is the best I have available to me. Here is a chart of the batted ball data for 2009 and 2010, including the monthly data for 2010:

bruce_dist

As it can be seen, Bruce is hitting the ball 6 feet less in 2010, vice in 2009 before the injury. In 2010, the batted ball distance has gone up ~10 feet from the beginning of the season to now. In the month of June, Jay started hitting the ball like he did back in 2009, so the claim of one year recovery time seems to be correct for Jay Bruce..

I am just beginning to look at the effects of injuries on players, but hopefully in the near future I have more information to publish. Please let me know if you have any questions and if there are any other players you want me to examine.


David DeJesus Out, Alex Gordon In

Last night during the Royals-Yankees game, David DeJesus sprained his right thumb after running into the fence (video). The complete extent of the injury is not known, but reports are saying that he could be back in two weeks or out for the entire season. This injury could not have come at a worse time for the Royals.

David was having a career year this season hitting .318/.384/.443. The batting average and on-base percentage were each career highs. Among all right fielders, he is 8th this season in WAR with 2.5. After Billy Butler, David was the second best hitter on the Royals.

The real value for the Royals wasn’t the production they expected to get from David on the field. Instead it was his trade value. David currently has 1.5 years left on his contract with less then $2.3 million owed to him this season and $6 million owed to him next season. David projects to be around a 3 WAR player, so his salary is team friendly.

Some of the of the teams interested in trading for David are the Giants and Nationals, though some other teams, Red Sox, A’s, Braves and Padres, may have been possibilities because of holes in their outfields .

With David’s earliest DL return date being after the trade deadline, the Royals lost one of their best trading chips to help build a team for a run at the division in 2012. Now the Royals must decided if they are going to trade him this offseason or keep him until the end of his contract.

Alex Gordon was called up from AAA Omaha to take David’s place. To say that Gordon’s career has been a disappointment would be an understatement. After missing most of last season with a hip injury and having a bad start to this season, he was demoted to AAA and moved to right field.

Gordon’s stats are not exactly what teams are looking for from a right fielder. With so few outfield prospects currently in the Royals system, he would not have much competition from the minors. The major league club should not give him much competition either, but we are dealing with the Royals. Just yesterday Rick AnKKKKKKiel was taken off the DL. Rick has been close to horrible in his minor league rehab starts by striking out 19 times while taking only one walk in 68 plate appearances. He did not let the Royal faithful down last night by going 0-3 with 3 Ks when he replaced David DeJesus.

So looking at the current roster, it seems like the following players will be splitting time in the outfield: Scott Podsednik, Mitch Maier, Willie Bloomquist, Rick Ankiel, Alex Gordon and Jose Guillen. Personally I would like to see Posednick in LF, Maier in CF and Gordon in RF. I would like to watch a younger player get a chance, versus watching a declining veteran struggle. Knowing Ned Yost, we will probably be seeing Podsednik in LF, Ankiel in CF and Bloomquist in RF.

Truthfully, I have no idea what is going to happen with the Royals outfield. One thing I will say with 100% confidence is that Alex Gordon will not see any regular playing time unless someone else gets hurt or traded. In that case, the Royals are already looking into another outfielder. Just when I thought it couldn’t get worse as a Royals fan, it seems it might.


The Alberto Callaspo Trade: Royals Perspective

It has been reported that Alberto Callaspo of the Royals has been traded to the Angels for pitchers Sean O’Sullivan and Will Smith. This could be the first of several trades the Royals make this year.

What the Royals lose in the trade:

The Royals traded off their starting third baseman this season since Alex Gordon was sent to the AAA team in Omaha to begin a move to the outfield. Callaspo has been hitting .275/.308/.410 with a wOBA of 0.312 this season. These numbers are similar to his career numbers of .283/.333/.406 wOBA of 0.323 making him an average to below average major league hitter over his career.

His defensive stats are better at his current position, 3rd base, compared to when he played 2nd base. His lifetime UZR/150 in 216 games at second base is -6.7, but has a 9.4 UZR/150 at third base in 111 games. Having seen most of the Royals games this year, Callaspo has looked smoother at third base vice second base.

The Royals will probably fill the void at third base with Wilson Betemit. I am sure that some people will be calling for Alex Gordon to move back to third. Alex and the team are happy with his move to the outfield. We are dealing with the Royals, so anything can happen, but I don’t see him moving back.

Wilson Betemit will be a stop gap at third base until prospect Mike Moustakas makes it to the majors. Betemit’s lifetime batting line of .263/.329/.444 is comparable to Callaspo’s line, but with a little more power. His defense though is a little worse with a -10.7 UZR/150 in 250 games at third base.

What the Royals get in the trade:

The Royals receive some much need needed pitching help. Currently two starters for the Royals are on the DL, Gil Meche and Luke Hochevar, with another, Anthony Lerew, rumored to be headed to the DL also. The Royals minors are loaded with some pitching talent, but all of it is in AA and lower.

Neither player gained is considered to be a top Angel prospect. Sullivan (age 21) has had a K/9 of 4.9 and BB/9 of 2.8 in 17 major league games. In the minors he averaged 6.6 K/9 and 2.4 BB/9. Smith (age 20) has average 7.6 K/9 and 2.2 BB/9 while in the minors. Both were pitching for the Angels AAA team at the time of the trade. Smith began the season at high A and has been promoted to the AAA team.

Neither pitcher seems ready to make an immediate impact on the major league team, but they may be called to help because of the injuries to the Royals starters. I wouldn’t be surprised to see Sullivan pitch this weekend. They will allow the Royals highly touted prospects to stay in the minors and progress to the majors without a jumping a level.


All Star Pitchers and the Cy Young Award

Ubaldo Jimenez and David Price got the nod this last Tuesday as the All-Star Game starters. Both pitchers had a decent first half, but do the pitchers that get chosen at starters end up winning that season’s Cy Young Award like Tim Lincecum did last season?

I decided to go back and look at how often the Cy Young Award winner was that year’s All-Star Game starter. Both leagues started awarding Cy Young Awards in 1967 and that is were I started my comparison. To begin with, there were seven instances where a reliever won the Cy Young. I removed these instances since there was no chance for him to start the game. So out of a possible 79 Cy Young Award winners, 20 — or 25% — of them started the All-Star Game. Of these 20 instances, 16 of the them have happen since 1988, the halfway point in years since the award started.

Besides just looking at the All-Star game starter, I looked to see if that season’s Cy Young Award winner, starter or reliever, was selected to participate in the All Star Game. Of the 86 Cy Young Award winners, 70 — or 81% — of them were selected for that year’s All-Star Game. Since 1998, when the All-Star rosters started to expand from 28 players to the current 34, 23 of the 24 Cy Young Award winners were selected for the All-Star Game. The only exception was Johan Santana in 2004.

Most of these numbers make common sense. For someone to win the Cy Young, they are going to need a good first and second half of the season. All the pitchers that had a good first half are on display for the All-Star Game. These players are seen as the top pitchers and create a short list of players for the voters to watch in the second half of the season.

Ubaldo Jimenez and David Price are not guaranteed to win the Cy Young Award, but they shouldn’t be counted out either. There exists a good chance that this year’s Cy Young Award winner was on the All-Star roster though, especially considering recent trends.


Pick-offs and Stolen Base Attempts

Last week, I looked at which teams were most likely to have players thrown out while running the bases (e.g caught stealing, picked-off, throw out while trying to take extra base, etc). In the comments of the article, it was discussed that the more aggressive base running teams are more likely to be thrown out on the bases. I am working toward a better solution for those base running numbers, but in the meantime I found some nice information on players getting picked-off.

The more aggressive a team is at attempting a stolen base, the more likely they are of getting picked-off. It seems like common sense to me, but I have had too many incorrect ideas to leave it only to instinct. The following graph looks at the attempted steals versus pick-offs for all teams from 2005 to 2009:

As it can be seen, the more aggressive a team is attempting to steal, the more likely they are of getting picked-off. Using the equation of the best fit line, it can be determined that for every 12.5 stolen base a team attempts, one player is likely to get picked off (12.5 attempts * 0.080 = 1).

Note: The relationship between the two values, doesn’t mean that one directly caused the other. There could be other factors at work on the two values.

I took this examination one step further and compared the times caught stealing versus time picked-off. I was looking to see if teams that were bad at stealing bases were also bad at getting picked-off:

My hunch was correct in that the r-squared (how closed one set of values correlates to another sets of values) is a bit higher (0.37 vs 0.32) for the caught stealing data. Using the values from the equation, it can be shown that for every 3 times a player is caught stealing, they are likely to be picked-off once (0.32 * 3 = ~1).

So far this season the numbers are similar to the previous 5 seasons as seen in the following two graphs:

Aggressive base stealing teams are more likely to be picked-off thereby removing a base runner. Rich Lederer proposed back in 2006 that the caught stealing value should include both caught stealing and picked-off numbers. I am not sure how the baseball community would accept that change, but if someone does include picked-off outs into caught stealing values, I could understand the reason why. For now it seems that teams looking to get an extra jump for a stolen base seem get thrown before they have the chance than those that are less likely to attempt the steal in the first place.


Who Are Creating Outs Running the Bases?

Last Tuesday night, I watched the Royals score 2 runs in the tenth inning to beat the Mariners. The Mariners were actually lucky because 2 Royals were thrown out trying to steal in the tenth inning. The Royals seem to get 1-3 runners thrown out on the base paths during each game (e.g. as I write this Billy Butler gets thrown out making a wide turn at 1st base).

Well, how does the Royals base running compare to the rest of the league. I took all the times a runner was safe at first and was then picked off, caught stealing or thrown out running the bases in a non-force out situation (e.g. trying to go from 1st to 3rd on a single). Some teams will have more chances to get thrown out because they have more base runners so I found the percentage of times a runner was thrown out on a non-force play once the runner was safe at first.

How does the Royals compare to the rest of the league? Here is a list of the worst running teams so far this season (team and percent of time thrown out by a non-force play) :

White Sox 7.9%
Angels – 7.7%
Rays – 7.6%
Rangers – 7.6%
Padres – 7.6%
Royals – 7.5%

Now that base path incompetents have had their 5 seconds of shame, here are the teams that get thrown out the least amount of times on the base paths:

Red Sox – 3.3%
Phillies – 3.6%
Blue Jays – 4.0%
Tigers – 4.2%
Braves 4.4%

Note: Here is a Google Spreadsheet of the all the teams for reference

The Royals are not the league’s worst team, but are not too far off. A few more running errors and they could quickly over take the White Sox.

Unnecessary outs on the base paths are frustrating to deal with as fans. Some of us fans though have to deal with it more than others.


M.A.S.H. Report

Comings and goings

It was a busy week for the disabled list. Last week there was a total 12 transaction (4 returning and 8 going) while this week there was a total of 30 (8 coming and 22 going).

Coming back ….

Aaron Hill – 2/12 with a homerun
Hong-Chih Kuo – 0.1 IP, 2 hits, 1 BB
J.C. Romero – .1 IP, 1 BB, 1 HR
Joe Thatcher – 0.1 IP, 1 SO
Brian Fuentes – 2 ER, 2 BB, 2 SO, 2 IP
Lance Berkman – 4/15 with a 2B
Russell Branyan – 3 for 9 with a double
Alex Gordon – He is still in Hillman’s dog house and not even getting to start every game at 3B.

… and Going to

Chan Ho Park – Strained right hamstring
Felix Pie – Strained upper back muscle – He is out 3 months while he waits for ruptured back muscle to heal
Jose Mijares – Strained left elbow
Chris Getz – Strained right oblique – Should be back after 15 days
Ross Ohlendorf – Back spasms – Looks to do one minor league rehab start and then rejoin team.
Aaron Rowand – Fractured cheekbones (video) – No surgery required to fix cheek bones and plans to be ready after 15 days.
Conor Jackson – Strained right hamstring – Should be back after require 15 days
Chris Johnson – Strained right intercostal muscle
Mike Cameron – Sports hernia – Should be read to come back after 15 days
Jacoby Ellsbury – Left chest contusion (broken ribs)
Jeff Mathis – Fractured right wrist – This one could be a while, but extent not known yet
Ryota Igarashi – Left hamstring strain – Injury caused when he squatted to field a bunt
Mark Ellis – Strained hamstring – He had already missed 7 days before going on DL
Jason Marquis – Loose bodies in right elbow – No surgery needed
Edwin Encarnacion – Sore right shoulder – Same arm that had broken wrist. He didn’t play much during Spring Training for it to rest and arm wasn’t ready according to team.
Brian Tallet – Left forearm injury – True extent on injury not know yet
Travis Buck – Strained right oblique – Injured during batting practice
J.A. Happ – Left forearm strain – Unknown return time
Jeff Weaver – Strained right lower back
Carlos Guillen – Strained left hamstring – Looks to be out just the 15 days and here is the video of him injuring himself trying to score.
Nick Punto – Strained right hip flexor (groin)
Manny Ramirez – Strained right calf – Only 3rd time on DL in his career. The injury has been nagging him since first week. Torre and him agreed to rest and get it healed correctly now.

Here are a few players that have some nagging injuries that could be heading to the DL

Bobby Crosby – Stiff left shoulder – He hasn’t played since 4/18

Andy LaRoche – Back spasms – He hasn’t played since 4/16 and can be used a PH if needed.

Pat Neshek – Sore tendon with middle finger of right hand – He has not pitched since 4/14, but the team is now reporting he is ready to go any time.

A couple injuries of concern

Prince Fielder – Sore wrist – He has been playing through the pain, but it may be sapping some of his power.

Brad Hawpe – Sat for the second time this season with a injured quadricep muscle.


Injuries to Outfielders Set Red Sox Back

Mike Cameron and Jacoby Ellsbury are now both on the disabled list, even though both were out for a few days before the Red Sox made the official decision. Jacoby was hitting decent with a line of 0.333/0.333/0.467 while Mike was not fairing as well with a line of 0.233/0.361/0.333. The Red Sox were 3-3 while they had both players on the team, but then have gone 3-7 since. The offense has gone from scoring 5.5 to 3.1 runs per game. The loss of these two can’t be the only reasons for the drop, but it for sure isn’t helping.

To take their roster positions, the Red Sox have brought up Josh Reddick and Darnell McDonald. The team also had Bill Hall and Jeremy Hermida on the team already to field the outfield. Since the two starters have gone down, all four of these players have started in the outfield at sometime, but they do not measure up to the players they replaced. Here are the 2010 projected wOBA from ZIPs for all 6 of the outfielders

Starters on DL
Mike Cameron
Jacoby Ellsbury 0.343

Replacements
Jeremy Hermida 0.340
Darnell McDonald 0.314
Bill Hall 0.299
Josh Reddick 0.299

Of the available replacements, Jeremy Hermida looks to be a decent offensive sub for the two on the DL. The other 3 aren’t close offensively.

On the defensive front, it is a little tough to come up with any great numbers for comparision since some of these players are from the minors and Bill Hall is completely out of position. I looked at several sources, the defensive numbers here at Frangraphs and Tom Tango’s Fan Scouting Report, and got the following information. Josh Reddick is probably the best of the 3 replacements and is probably a better defender than Ellsbury. Bill Hall and Darnell McDonald are similar and look to be average defenders. Jeremy Hermida is by far the worst of the 4.

What kind of options do the Red Sox have right now? They might just wait for both players to return and see if they get a competitive boost. Ellsbury is planning to return to the team immediately after his time is up on April 27th. A return timetable for Cameron has not been set yet.

I think the team needs to make a move for bat, preferably someone that can play outfield for now, but can move to DH once both Cameron and Ellsbury return. The DH position for the Red Sox has been hitting a pathetic 0.159/0.243/0.286 so far this season. They could make a move for a someone on a team not looking to make the playoffs like Michael Bourn on the Astros. Adam Dunn would be a nice fit, but with the Nationals only 2 games out, they will probably not ready to trade one of their top hitters yet.

The season is fairly young and no team is totally out of contention of yet. After losing two of their starting outfielders at the same time and not getting any production from the DH, the Red Sox are in a hole. In any other division, I don’t think it would be a problem, but they are in the AL East with the top 2 teams in the AL. They are currently 6 games behind Tampa and 5.5 games behind New York. Boston needs to start looking into options to get themselves back in the race or even just back to 0.500 before any chance to make the playoffs is completely gone.


M.A.S.H. Report

Update on a few injuries

Felix Pie – He has been found to have a torn left latissimus dorsi muscle which will not require surgery. He will though be out 3 months recovering from it.

Mike Wuertz – Should be able to come off the DL any day now. The team is reporting that he should be pitching his 3rd and final rehab outing Wednesday.

Ted Lilly – He is ready to come off the DL and plans on starting on Saturday vs Milwaukee. He went 7 innings in his last rehab start on Tuesday.

Brian Sanches  — He is planning on joining the Marlins on Monday after his required time on the DL is up.

How Sleeping Patterns Affect Players

Sleep is often an overlooked aspect of a player’s health and ability to play. Russell Carleton at BaseballProspectus looks at some general effects of bad sleep habits. The Portland Trail Blazers have decided to address the issue with some positive results.

Differences between X-ray, CT (cat) Scan and a MRI (link to a more in depth article).

X-rays – Useful for only looking at solid body parts (bones). – Machine cost = $6K to $7K

CT (cat or Computerised Tomography) scan – Highly sensitive x-ray that is more detailed than a normal X-ray. It can also pick up soft tissues in the final image that x-rays can’t. Machine cost = $200K

MRI (Magnetic Resonance Imaging ) – Uses 2 oscillation magnetic fields to magnetize hydrogen atoms for detection. Picks up non-bone tissues extremely well, including any non-normal tissues (tumors). Machine cost = $1 to $3 million

Sometimes a player will have an initial x-ray or CT scan and wait until they can get an MRI. The reason is pretty simple in that at around two million dollars a pop, a MRI machine is not always available everywhere.

Pitcher aging curves

MGL at the The Book Blog put out a $100 charity bounty recently for someone to find any kind of aging curve for pitchers. This could be any subset of the overall pitching pool that goes from a lower value and then peaks and finally drops off. All he was been able to find is that pitchers start at their peak at age (study started looking at 21 year olds) and remain at that pitching level until age 28 to 29. At that age, they then begin to show the signs of aging.