By the Numbers: Evaluating the 2020 Amateur Draft

With 2020’s amateur draft consisting of just five rounds, much of the strategy teams typically use related to shifting bonus pool money around was rendered moot. There were no high schoolers to woo with big bonuses after the 10th round, no saving money on a seventh rounder to sign a better first rounder. This served to decrease the incoming talent pool by quite a bit, with many good players going undrafted or unsigned, but it also makes an immediate analysis of the exercise a little bit easier.
With just 160 picks, we can evaluate a team’s decision to take a lesser player early in the draft in order to use the money saved on picks later and vice versa. With less scouting time and fewer looks, there might have been a bit more variation in terms of the quality of the players taken on draft day. Likewise, determining who might improve and surprise is trickier. As such, we shouldn’t consider this analysis ironclad. However, using Eric Longenhagen’s rankings and the selected players’ actual draft positions, we can compare how well each team did with their picks based on those rankings. To determine the value of each player and each pick, I’ll be using my draft pick valuation research from last year, which examined expected production from every draft slot.
Different drafts have different strengths and weaknesses. Some are heavier at the top, while others are deeper in the 50-100 range. This analysis doesn’t consider the shape of the 2020 draft, but instead uses a more general basis for what every pick is worth. As a reminder, here’s what the first 70 picks looks like:
| Pick | Present Value of Pick ($/M) |
|---|---|
| 1 | $45.5 M |
| 2 | $41.6 M |
| 3 | $38.2 M |
| 4 | $34.8 M |
| 5 | $31.9 M |
| 6 | $29.3 M |
| 7 | $27.4 M |
| 8 | $25.9 M |
| 9 | $24.5 M |
| 10 | $23.3 M |
| 11 | $22.2 M |
| 12 | $21.1 M |
| 13 | $20.2 M |
| 14 | $19.2 M |
| 15 | $18.4 M |
| 16 | $17.6 M |
| 17 | $16.8 M |
| 18 | $16.1 M |
| 19 | $15.4 M |
| 20 | $14.8 M |
| 21 | $14.1 M |
| 22 | $13.6 M |
| 23 | $13.0 M |
| 24 | $12.5 M |
| 25 | $12.0 M |
| 26 | $11.5 M |
| 27 | $11.1 M |
| 28 | $10.7 M |
| 29 | $10.3 M |
| 30 | $10.1 M |
| 31 | $9.8 M |
| 32 | $9.5 M |
| 33 | $9.3 M |
| 34 | $9.0 M |
| 35 | $8.8 M |
| 36 | $8.5 M |
| 37 | $8.3 M |
| 38 | $8.1 M |
| 39 | $7.8 M |
| 40 | $7.6 M |
| 41 | $7.4 M |
| 42 | $7.2 M |
| 43 | $7.0 M |
| 44 | $6.9 M |
| 45 | $6.7 M |
| 46 | $6.6 M |
| 47 | $6.4 M |
| 48 | $6.3 M |
| 49 | $6.1 M |
| 50 | $5.9 M |
| 51 | $5.8 M |
| 52 | $5.7 M |
| 53 | $5.5 M |
| 54 | $5.4 M |
| 55 | $5.3 M |
| 56 | $5.2 M |
| 57 | $5.0 M |
| 58 | $4.9 M |
| 59 | $4.8 M |
| 60 | $4.7 M |
| 61 | $4.6 M |
| 62 | $4.5 M |
| 63 | $4.4 M |
| 64 | $4.3 M |
| 65 | $4.3 M |
| 66 | $4.2 M |
| 67 | $4.1 M |
| 68 | $4.0 M |
| 69 | $3.9 M |
| 70 | $3.8 M |
Third-round picks come in at $3.8 million, while fourth round picks come in at $2.8 million; the final round of 2020 is generally worth $2.5 million per pick. Compared to the cost of paying players in free agency, the first five rounds of a draft represent around $1 billion in surplus value due to the constraints on signing bonuses and players’ suppressed salaries for the first six-plus years of their major league careers. Rounds six through 20 generally provide about $675 million in value, but MLB and its teams opted not to take advantage of that this season.
Below I’ve taken drafted players’ rankings from The Board and given them draft pick values as though they had been drafted in order. Based on that methodology, these teams added the most in value on draft day:

It should come as no surprise that Detroit tops the charts. The Tigers had the draft’s top pick and took its top player. Many of the values you see above are dictated simply by the number of picks a team had and where those picks fell. Teams picking at the top of the draft tend to get good players. To evaluate how teams did with their picks, I compared the above numbers to the expected value of the picks themselves:
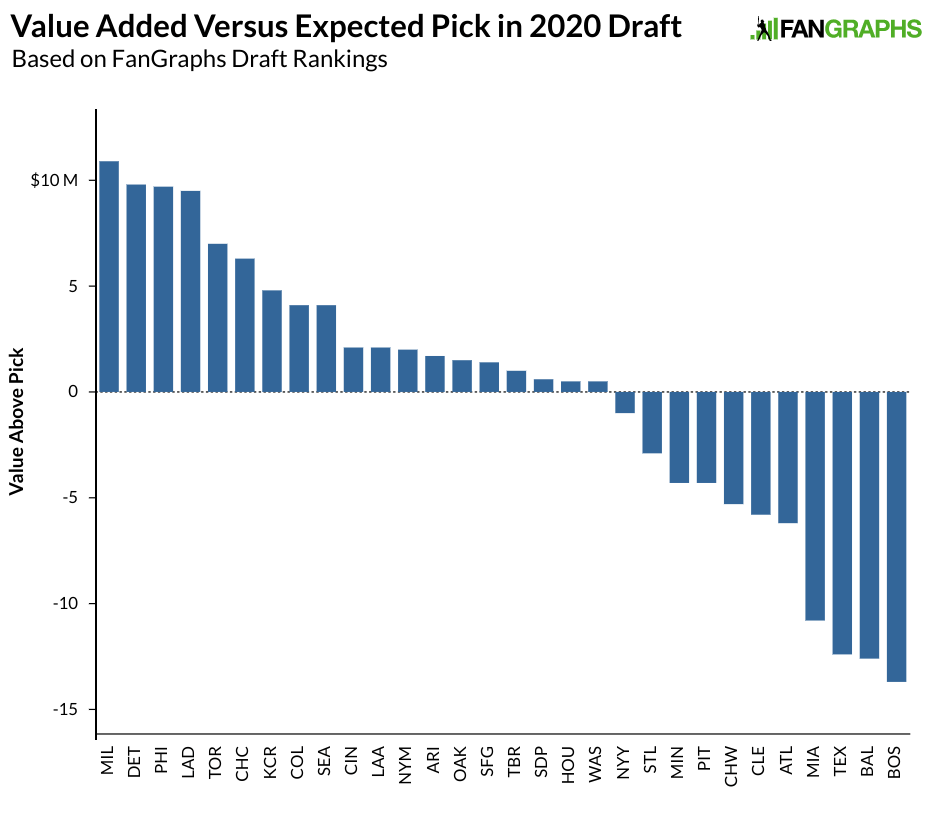
Based on the rankings, the Brewers, Tigers, Phillies, and Dodgers did very well picking players who fell to them on draft day. Boston only had one pick in the first two rounds and used it on the 165th-ranked player on The Board, Nick Yorke, as Eric noted in his Day 1 recap. With just three more picks, they were unable to make up for that lost value. While Baltimore definitely picked up some talented prospects, there’s a sizable gap between the expected value of the second pick and the seventh-ranked Heston Kjerstad. And as Eric noted after the draft, the Rangers had a fairly unusual strategy, one that suggested financial considerations related to the team’s new ballpark may have been a factor in their approach.
Most teams did about as well as could be expected compared to the draft rankings. The difference between the sixth-ranked Cubs and the 26th-ranked Braves is just $12.5 million. Using the same chart by percentage above and below expectations, we see slightly different results:
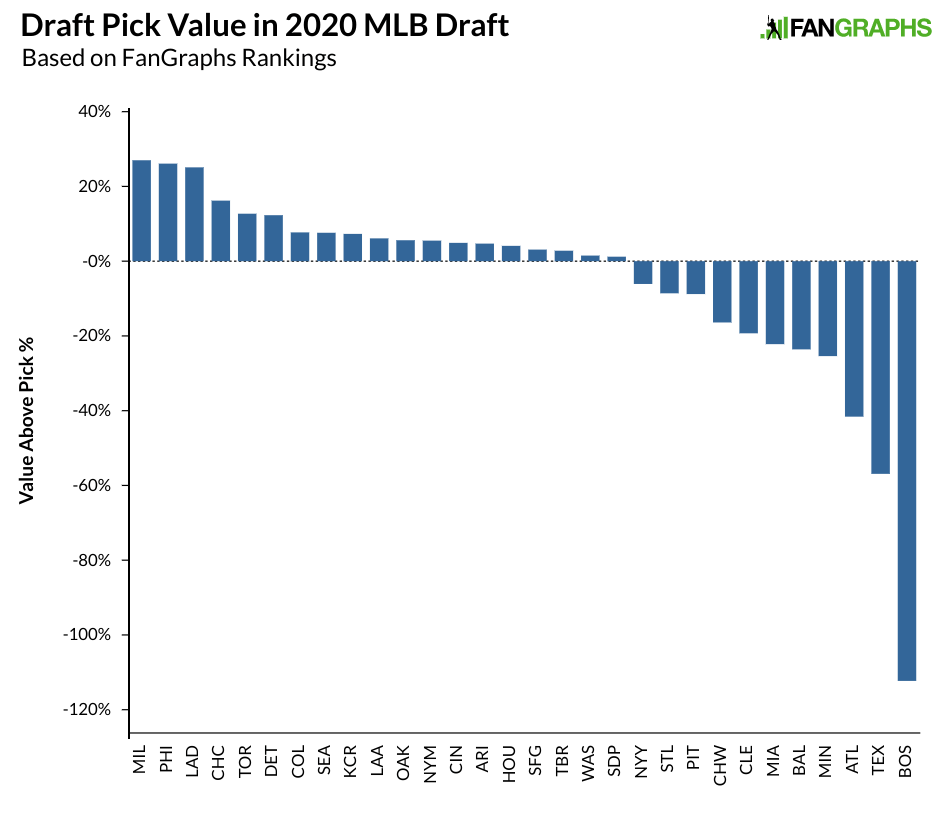
Milwaukee still takes the top spot, but a few teams move ahead of the Tigers due to Detroit’s very high expected value. Here’s a full, sortable chart of teams. All dollar values are in millions:
| Team | Actual Player Rank Value | Draft Pick Value | Value Above Pick | Value Above Pick % |
|---|---|---|---|---|
| MIL | $40.3 M | $29.4 M | $10.9 M | 27.0% |
| PHI | $37.2 M | $27.5 M | $9.7 M | 26.1% |
| LAD | $37.8 M | $28.3 M | $9.5 M | 25.1% |
| CHC | $38.8 M | $32.5 M | $6.3 M | 16.2% |
| TOR | $55.2 M | $48.2 M | $7.0 M | 12.7% |
| DET | $79.5 M | $69.7 M | $9.8 M | 12.3% |
| COL | $53.1 M | $49.0 M | $4.1 M | 7.7% |
| SEA | $53.8 M | $49.7 M | $4.1 M | 7.6% |
| KCR | $65.6 M | $60.8 M | $4.8 M | 7.3% |
| LAA | $34.5 M | $32.4 M | $2.1 M | 6.1% |
| OAK | $26.7 M | $25.2 M | $1.5 M | 5.6% |
| NYM | $36.1 M | $34.1 M | $2.0 M | 5.5% |
| CIN | $42.9 M | $40.8 M | $2.1 M | 4.9% |
| ARI | $36.2 M | $34.5 M | $1.7 M | 4.7% |
| HOU | $12.1 M | $11.6 M | $0.5 M | 4.1% |
| SFG | $44.9 M | $43.5 M | $1.4 M | 3.1% |
| TBR | $35.9 M | $34.9 M | $1.0 M | 2.8% |
| WAS | $32.3 M | $31.8 M | $0.5 M | 1.5% |
| SDP | $51.3 M | $50.7 M | $0.6 M | 1.2% |
| NYY | $16.3 M | $17.3 M | -$1.0 M | -6.1% |
| STL | $33.9 M | $36.8 M | -$2.9 M | -8.6% |
| PIT | $48.9 M | $53.2 M | -$4.3 M | -8.8% |
| CHW | $32.4 M | $37.7 M | -$5.3 M | -16.4% |
| CLE | $30.0 M | $35.8 M | -$5.8 M | -19.3% |
| MIA | $48.7 M | $59.5 M | -$10.8 M | -22.2% |
| BAL | $53.5 M | $66.1 M | -$12.6 M | -23.6% |
| MIN | $16.9 M | $21.2 M | -$4.3 M | -25.4% |
| ATL | $14.9 M | $21.1 M | -$6.2 M | -41.6% |
| TEX | $21.8 M | $34.2 M | -$12.4 M | -56.9% |
| BOS | $12.2 M | $25.9 M | -$13.7 M | -112.3% |
Boston’s draft looks really bad, but obviously they were considerably higher on York than the popular consensus leading into the draft. It’s often said that we can’t really evaluate a draft on Day 1 because we won’t know the outcomes for its players for several years, but we can take a look at how teams did based on the information we have today. There are going to be some players who look like reaches but pan out because a team’s scouts saw something they might be able to fix, allowing the player to turn into a version of themselves who’s much better than most might expect today. Likewise, there are going to be some players who evaluators love now, but who will see some part of their game fail to develop as anticipated. Uncertainty doesn’t necessitate abandoning all analysis. This is just a simple way of evaluating how teams performed compared to The Board.
Craig Edwards can be found on twitter @craigjedwards.
I am assuming the Twins were lower on the value added simply because they did not have a 3rd round pick?