Archive for Daily Graphings

Contract CrowdSource: Carl Crawford

Today, I want to kick off an experiment of sorts. Over the last few off-seasons, I’ve noticed that the expectation of what I think a player will sign for is regularly not anywhere close to what he actually gets. Whether it was due to my misconceptions of what the market would value a player as, or just corrections inspired by the recession, we’ve seen guys sign for fractions of what they were expected to get, or not sign at all despite being pretty useful players.

So, rather than just go into this winter with my own observations of what the market may look like, I thought it would be a worthwhile effort to crowdsource the expected contracts for most of the major free agents who are looking to get paid this winter. We’re going to find out just how well the wisdom of crowds works in projecting the free agent market.

The first player we’ll throw out for discussion is the big fish of the winter, Carl Crawford. The Tampa Bay outfielder, who just turned 29, has established himself as one of the game’s best all-around players. Over the first nine years of his professional career, he’s averaged just under +4 WAR per season, and he’s been even better than that the last two years, posting a +5.5 win season last year and already reaching +5.6 wins so far in 2010. He’s in the prime of his career with a skillset that ages very well, and with a variety of abilities that are valued by every team, no matter their team-building philosophy.

Crawford is going to attract intense interest from multiple teams. There will be an inevitable bidding war for his services, with the Yankees and Angels most often rumored to be the teams ready to break the bank in an effort to lure Crawford to join their organizations. So, the question is, how much does he get, and for how long?

You can use the form below to submit your answers. Once we have a decent sample and the numbers seem to have stabilized around a length and figure, we’ll revisit the expectations. Assuming there’s enough interest, we’ll continue doing these until we get to free agency and find out just how much you guys actually know about projecting free agent contracts. It should be a fun experiment.

Prospects Chat – 8/30/10


David Ross: The New Gregg Zaun

I’m not sure who started it (perhaps Rany Jazayerli?), but a few years ago many internet writers began to call Gregg Zaun the Practically Perfect Backup Catcher. However, as people looked more closely. they began to realize that a catcher who was close to league average offensively (Zaun has a career 94 wRC+) and non-horrible defensively would actually make a Pretty Good Starting Catcher. The Toronto Blue Jays noticed and were the only team to really give Zaun a full season of playing time in 2005. By that time, Zaun was in his mid-30s, durability issues started to set in, and he’s never seen that much playing time again. However, the nerdosphere’s like affair with Zaun continued, and although he’s been more of a half-time player since then, he’s hit well enough to be an above average player (relative to his playing time).

Zaun’s 2010 with the Brewers ended early due to injury, and it’s an open question whether he’ll come back for his age 40 season in 2011. But there may be a new candidate to take up his role: Atlanta’s David Ross. Of course, barring unforeseen circumstances befalling Brian McCann, it makes sense that Ross isn’t going to be a starter in for the Braves any time soon. Despite his backup role, however, it seems to me that he could ably start for someone.

Ross has a good defensive reputation, and both DRS and TotalZone rate him as above-average. But let’s leave that aside and focus on his bat. We know that that most catchers don’t hit well. One of the handy things about wOBA is that it is just linear weights in rate-stat form, so we can convert it to runs above/below average. At FanGraphs, the full-season positional adjustment for catcher is +12.5 runs. So prorated 700 PA, to be average a catcher has to be worth -12.5 runs or better to be average or better (assuming average defense). In the 2010 run environment (.322 league average wOBA), that means a defensively-average catcher with about a .300 wOBA will be league average.

How does Ross stack up? Over the last three seasons (2008-present), he has a .349 wOBA (.249/.369/.421), which clearly puts him above the .300 “average line” we set above, as well as better than many starters over the same period, some of are rightly considered to be good players: Russell Martin (.324), Carlos Ruiz (.323), Yadier Molina (.319), and Kurt Suzuki (.315). While Ross’s 2009 power outburst (.234 ISO) was likely far above his true talent, and he’s probably had a fair bit of BABIP luck the last two season (.341 BABIP in both 2009 and 2010 so far), Ross has also thrived on an very good walk rate (15.1% from 2008-present) due to his consistent ability to lay off pitches outside the strike zone. Of course, there’s a sample size issue here, as Ross hasn’t even had 500 plate appearances total the last three seasons. A good bit of regression (particularly for BABIP) is called for here. After doing so, ZiPS RoS projects Ross’s current true talent as a .322 wOBA hitter — about MLB average, which, as a catcher makes him an above-average player.

In a league where Bengie Molina and Jason Kendall have full-time jobs, one wonders why more teams didn’t offer Ross a bit more money and playing time when he was last a free agent. His .286 wOBA in 2007 probably didn’t help, and perhaps teams felt he couldn’t handle even a half-time workload. However, in 2006 he played almost as much and had a .386 wOBA. Whatever the case may be, we probably won’t get to see what Ross could do with more playing time. Not only is he playing behind McCann, but the Braves have Ross locked up through 2012 at a bit more than $1.5 million a year — a bargain given that Ross still been delivering them about a win a season in less than 200 PAs. If McCann does go down for a while, Atlanta knows they won’t suffer too much in the hands of the new Practically Perfect Backup Catcher Who Could Probably Be Starting Somewhere.


Wrist Injuries and Rickie Weeks and Troy Tulowitzki

A few days ago, I looked into Jay Bruce’s decline in power since his wrist injury last season. I asked our readers if there were any other players they wanted examined. Troy Tulowitzki, Derrek Lee, Jordan Schafer and Rickie Weeks were brought up. I don’t have the batted ball data around when Derrek Lee’s injury happened and Jordan Schafer was sent to AAA after coming off the DL, so neither of those two will be examined. That leaves Rickie Weeks and Troy Tulowitzki to be looked at closer.

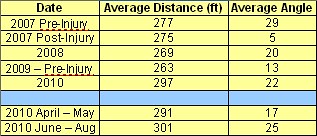
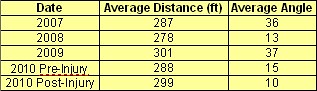
I will be looking at the average distance in feet for the fly balls and line drives and the average angle they were hit towards (positive angle is to left field and negative number is to right field). The angle is important to look at because it shows that the batter is able to get the bat through the ball and drive it.

Rickie Weeks

Rickie is a nice test case since he has broken his wrist twice since making to the big leagues: once in May 2007 and the other time in May 2009. Here is a look at line drive and fly ball distances and angles for Rickie from 2007 to current:

weeks

I am not for sure what to make of the data exactly. Before either injury, he was driving the ball to left field and averaging 277 ft per hit. After the first injury, he never hit for the same power in distance and started hitting the ball more towards center field. This season, it looks like he has had a boost of power and is starting to turn on the ball a little more. I am wondering if his 2007 injury never actually healed until this past off season.

Also, I divided this year’s data into two time frames. It can even be seen that he is increasing his distance over this season. Again, the one year recovery on wrist injuries looks to hold true.

Note: As asked in my last article, someone pointed out that the weather may be a concern (flyballs travel further in warm weather vice cold weather). The difference is that the ball travels at most ~3 less feet in April compared to a peak distance in June.

Troy Tulowitzki

There is not much data since Troy’s return, but here is his data from the last 4 years:

tulo

Two pieces of information stick out to me right away, though.

First in 2008, he had much less power than in 2007 and 2009. Looking back to 2008, he had both a quadricep and hand injury during that season that may have slowed him down. I may also have to look if hand injuries have the same loss of power that wrist injuries do.

For 2010, he has hit for distance just fine, but before and after the injury, he was taking it more to center than he did previously. Since Troy has returned, he is hitting it even more towards center.

Further Research

I am really needing to get some good baseline data to work off of for future analysis. I will probably wait to start it this off season so I can use all of the 2010 data on injuries and batted ball data.


Biggest WAR Fallers from 2009

With September fast approaching, it’s incredible to think the season is almost over. I say the same thing every year, but it really does seem like Opening Day was yesterday. As we get closer to the big 1-6-2, I wanted to take a look at some of the biggest decliners in WAR (not primarily due to injury) from 2009 to 2010 and do a little analysis as to why the drop occured.

UT Ben Zobrist
2009 WAR: 8.3
2010 WAR: 2.7

Zobrist was the name around sabermetric circles last year, putting up awesome offensive numbers while playing a variety of positions. Unfortunately for Ben and Rays fans alike, that prowess at the plate has not carried over to 2010. The 29-year-old’s wOBA dropped from .406 last year to just .330 this year, a combination of an 11.9% drop in home runs per fly ball and concurrent drops in BABIP and BB%. Meanwhile, here’s Zobrist’s defensive games started in 2009 versus 2010:

1B: 2/7
2B: 81/27
3B: 1/0
SS: 6/0
LF: 2/0
CF: 5/8
RF: 37/71

Due to Tampa Bay’s roster construction, Zobrist is playing a lot more of right field and less of premium positions that require a lower offensive performance to beat replacement level standards.

SS Derek Jeter
2009 WAR: 7.4
2010 WAR: 2.2

Jeter’s 2009 was truly remarkable, putting up the fourth highest wOBA of his career (and best since 2006) while also accumulating the most fielding runs of his career. In 2010, everything has come apart for the captain from the Bronx. Jeter’s on pace to have the worst offensive year of his career by a pretty decent margin with a .323 wOBA (102 wRC+); he’s walking 2.3% less of the time while also hitting grounders at a Tim Hudson-esque 65.8% rate. With a BABIP .63 lower than last year, there isn’t much saving Derek at the plate. On defense, UZR has him for -4.3 runs with DRS saying he’s been at -11. Either way, Jeter has disappointed given his 2009 and contract.

INF Chone Figgins
2009 WAR: 6.1
2010 WAR: 0.2

The most dramatic decrease of all, Figgins has gone from one of the best third basemen in baseball last year to one of the worst second basemen this year. In his first year in Seattle, Figgins has hit a measly .248/.336/.292 despite a modest .306 BABIP; after a .358 wOBA with the Angels last season, Figgins is at .298 this year, well below league average. Despite moving to second base, the positional advantage hasn’t mitigated enough to put Figgins where he should be. After a UZR/150 of 17.9 at third base in 2009, Chone is at -13.8 at second this season. Simply put, Jack Z can’t be pleased.

OF Matt Kemp
2009 WAR: 5.1
2010 WAR: 0.6

At the start of the season, Kemp was the big name throughout baseball. He was dating Rihanna and coming off of a stellar 2009 in which he put up a .367 wOBA while playing solid defense in center field. But everything has fallen apart since then. Kemp just hasn’t been the same player he once was with a UZR/150 of -15.6, nowhere near where he was last year. Moreover, Kemp’s .323 wOBA has been due primarily to a BABIP .49 points below his career average. Here are his peripherals for the the past two seasons:

BB%: 7.8/7.9
K%: 22.9/27.9
LD%: 21.3/20.2
GB%: 40.4/40.9
FB%: 38.3/39

Not much different. Still, Kemp’s production has been seriously disappointing, but at twenty five years old he has a lot of time to go back to his better days.


Manny to The White Sox

For the second year in a row, the White Sox have used the August waiver period to add a talented outfielder who has worn out his welcome with his current team. Last year, the White Sox took on the remainder of Alex Rios‘ contract, and while he struggled to finish out 2009, he has been one of their best players this season, and the move has certainly paid dividends. Will adding Manny Ramirez pay off as well?

There are a couple of ways to look at whether Ramirez will work out or not. The White Sox are a fringe playoff contender, with about a 13 percent chance of making the playoffs. Ramirez is a significant upgrade from their rotating DH platoon, a position that has been most frequently manned by Mark Kotsay and his .233/.307/.382 line. ZiPS projects a .292 wOBA going forward for Kotsay, which pales in comparison to the .400 mark projected for Ramirez.

Even if you bump up the projection a bit to account for the other guys who would rotate through the DH position, we’re still looking at a 100 point gap in wOBA in September, which is a huge number, and, over 100 plate appearances, it adds up to nearly an eight run difference. Even though it’s only for a month, replacing Kotsay with Ramirez should add almost a full win to the White Sox total.

Given their place in the standings, a one win upgrade could make all the difference in the world. It is certainly within the realm of possibility that Chicago ends the season within just one game of the Twins. Having Ramirez’s bat in the line-up could put them in the playoffs, and given how valuable that is, picking up his $4 million in remaining salary and not surrendering any talent is something of a no-brainer. The team gets significantly better in a playoff race and all they have to give up is cash. That’s the kind of move every fan should want their team to make.

But it does raise a question. If the White Sox had $4 million in their budget for 2010, why did they wait until August 30th to spend it? They gave Kotsay $1.5 million to occupy a fairly important roster spot, despite the fact that he’s been a replacement level player since 2006, and failed to make necessary upgrades to their offense over the winter. If they had the ability to throw another $4 million at this roster, couldn’t that money have been spent better last winter on a guy who would have been around for the whole year, rather than just the final month?

It’s a fair question, but the reality is that circumstances change and budgets are not static. I’d imagine, though I’m just guessing, that if Kenny Williams could have spent another $4 million last winter, he’d have done so, and probably made some different choices about what his team looked like. The uncertainty about a team’s overall performance is far greater in January than it is in August, and not knowing if a team will be a contender or not pushes teams to be somewhat conservative with their payrolls each off-season.

The team has information they didn’t have before, and Jerry Reinsdorf was willing to gamble some cash on a player who can upgrade the team in a playoff race. Perhaps that is cash he was not willing to gamble over the winter, not knowing what this team would look like come the stretch run. While it’s reasonable to ask Williams why he was willing to lean so heavily on Kotsay, I don’t think we can assume that the money that they just spent on Ramirez was available to him over the winter.

So, overall, kudos to the White Sox again. They made a bold, intelligent waiver claim last year with Rios, and they’ve done so again with Ramirez. I still think Minnesota wins the AL Central, but Chicago will at least make it interesting. Plus, Manny being managed by Ozzie Guillen? Let the comedy begin.


Jake McGee’s Impending Debut

With playoff rosters being set tomorrow night, don’t be surprised if the Rays place J.P. Howell – out for the season following shoulder surgery – on their roster with intent to replace him at a later date. Keep an eye out in particular for Jake McGee to fill that vacancy.

The team set a precedent in 2008 using the disabled list trick to eventually place David Price on the playoff roster. He would come out of the bullpen in the postseason and recorded the final out in the American League Championship series. McGee, like Price, is a hard-throwing southpaw, but one whose future is likely within the same role. McGee’s secondary stuff is not as polished as Price’s was in 2008 and he has an elbow zipper to boot.

In 88 innings for Double-A Montgomery, McGee struck out more than one batter per inning and held a 2.53 FIP. The Rays promoted him to Durham, where he’s appeared in eight games (seven as a reliever) and he has continued striking out more than one batter per inning, but he has dropped his walk rate to fewer than one free pass per nine innings pitched. Obviously those ratios are skewed given the small sample sizes associated, but McGee looks major league ready.

Ostensibly, the rest of the bullpen would remain steady, with Andy Sonnanstine and Lance Cormier likely moving aside as Jeremy Hellickson and Grant Balfour join the ranks. Wade Davis could also find himself on the inactive list for at least the first round of the playoffs, giving the Rays the chance to carry 12 pitchers like normal with four being starters. Whatever the combination, the Rays’ pen has been a strength all season and could be even better over the rest of the season.


Unlikely Success for Dickey

R.A. Dickey has never managed to go an entire season without at least some time spent in the Minor Leagues. Perhaps 2011 will break that streak because the Mets certainly have to be a little regretful of the 60.2 innings they had Dickey spend in Buffalo to begin 2010.

Dickey wasn’t much different in Triple-A this season then he has been in the past aside from a reduced BABIP and a higher ground ball rate. Then again, Dickey has always been better than the Triple-A level and this season was no different with Dickey accumulating in the range of about 1.5 WAR if we extended the formula to the Minor Leagues. Called up to the big leagues and inserted into the Mets rotation as of May 19. It wasn’t an auspicious beginning with four walks and two strikeouts in six innings, but things only got better from there. In the 120.1 innings since that first start, Dickey has recorded 83 strikeouts and just 27 walks and one hit batter.

What’s working for Dickey? Not surprisingly, it’s his knuckle ball. Never before has he committed to it so fervently, throwing it over 80% of the time and getting good results. And despite the increase in knuckle balls, Dickey has halved his walk rate from last season and kept his strikeouts level. He’s even manged to keep more batted balls on the ground. Also despite the heavy use of a knuckler, Dickey’s wild pitch and passed ball rate (just one per 240 pitches) is merely 59th amongst all pitchers with at least 1,000 pitches in 2010.

Coming into play today Dickey is sporting a sparkling 2.64 ERA but more importantly, his FIP is a solid 3.44 and his 3.68 xFIP points to a pitcher not succeeding through luck alone. And that is before you consider that Dickey might deserve a discount on his FIP due to his knuckleball. His 2.5 WAR to date exceeds his previous career best of 1.9 with the Rangers in 2003. That’s a significant bounce back from a really poor 2009 season spent mostly in the Twins’ bullpen.

Even though he has bounced around the league for the past ten seasons, Dickey has yet to accumulate enough service time to qualify as a Major League free agent and thus the Mets still retain arbitration rights to him. It’s always fun to take heed of players such as Dickey who have found some, perhaps fleeting, success after years of struggle. Will he be able to stick an entire season in a big league rotation next season?


Votto’s Reaching the Grass

While pulling some numbers last night about Joey Votto for my post on the Triple Crown* I stumbled across Joey Votto’s number of infield pop ups this season. It’s zero. According to BIS, Joey Votto has yet to hit a single fly ball that hasn’t at least reached the outfield grass.

*For what it’s worth, I think the edge goes to Votto over Pujols because I believe more in his high batting average than ZiPS does and I think his home field advantage in home runs and RBIs puts him in a better situation. However, it wasn’t a conclusion based on any exhaustive study of projections and I thought that was obvious since I didn’t back it up with anything. It was a single sentence reflecting a personal feeling only.

In case you were wondering, that is pretty impressive. The list of qualified hitters who have managed an infield fly per fly ball (IFFB%) rate under 1.0 since 2002:

2004 Larry Bigbie 0.0%
2009 Ryan Howard 0.6%
2009 Derek Jeter 0.8%
2006 Bobby Abreu 0.8%

Derek Jeter makes the list once and several times was amongst baseball’s best. He has perhaps best been consistent in avoiding hitting pop ups with 4.9% being his highest rate, which is still lower than the league average.

Larry Bigbie is an interesting case. 2004 was certainly the high mark of his short Major League career and he still ended up as a below average player with only a slightly above average bat. 2004 was the only season that Bigbie qualified for the batting title otherwise he would be all over this list. According to BIS, and Retrosheet’s markers have a similar interpretation, Larry Bigbie hit exactly one infield fly ball in his Major League career over 1,367 trips to the plate.

Like Jeter and Bigbie, Votto has never been one to hit into many pop ups. More impressively, he’s done it as a hitter not inclined to ground balls the way Jeter and Bigbie are or were. Votto’s career 42% ground ball rate is much lower than either Jeter’s 52% or Bigbie’s 56%. Votto doesn’t shy away from hitting fly balls, he just hits them with consistent power.


More Bullpen Moves in Minnesota

The word around the twittersphere is that Brian Fuentes is heading to the Twins with a player to be named later heading back in return. It is doubtful that the PTBNL is of any real value, but the Angels certainly have no need for a closer whose contract ends this season. I can say that with pretty good confidence because the vesting option on Fuentes’ contract stipulates that he needs to finish 55 games in 2010 to activate it. Fuentes is at 33 this season and is headed to a team with at least two relievers ahead of him for saves.

Since the Twins have little to worry about Fuentes’ vesting option, this can be seen as simply a very short-term rental. This looks like just a little extra insurance to better the Twins’ odds of outlasting the White Sox for the AL Central title. My question is whether adding Brian Fuentes actually betters the bullpen.

After a down season in 2009, Fuentes has not rebounded meaningfully. His fastball speed is still down and the ground balls are even more infrequent in nature. Fuentes has regained some of his lost strikeout rate, but not a lot and he’s been treading water thanks in part to his .250 BABIP. Fuentes’ tenure with Anaheim paints him as being close to a replacement-level reliever.

The Twins have had a very strong bullpen this year. Jeff Manship, Matt Guerrier and Glen Perkins are the only active members of the team who have posted a FIP above four while in the bullpen. Perkins was done in a very small sample and he’s more of a starter anyways.

This move certainly makes the claiming of Randy Flores even more curious as Fuentes is simply a better version of Flores and Fuentes isn’t even all that good. If the idea is to ditch their claim on Flores and replace him with Fuentes to be their LOOGY, that individual move at least makes sense. If the Twins keep both of them, then I’m wondering who loses his job to make room because there’s a decent chance that Fuentes is less useful. I understand the motivation behind wanting to grab whatever improvement is out there, but I’m left feeling there isn’t much or any improvement to be had in this case.
