Archive for Daily Graphings

Is Anthopolous Right to Take the Picks?

The Toronto Blue Jays have had a fun year for a team many picked to be among the worst in baseball before the season started — a short burst of pseudo-contention to start the season, tons of home runs, and they are still above .500. However, given where the team is at in the “success cycle,” most assumed that before the deadline they’d trade away some of their veteran relievers who will be free agents after the season: Jason Frasor, Scott Downs, and Kevin Gregg (the Jays hold a club option on Gregg). Surprisingly, all three relievers are still with the team. Jayson Stark reports that Toronto GM Alex Anthopoulos decided that relative the offers they were getting for these pitchers, Toronto would be better off offering the relievers arbitration (which Anthopolous is confident they’ll turn down) and getting compensation draft picks in return.

In the cited article, Anthopolous sounds confident that the relievers would turn down arbitration if it was offered to them, thus netting the Jays compensation picks if they were signed by another team. Assuming that the Jays would have made a fair trade for both sides, and the players will turn down arbitration, is Anthopolous right that the draft picks are likely to be worth more than the prospects in return? My seven longtime readers will know I’m about to refer to Victor Wang’s research on the trade value of prospects and draft pick compensation as summarize by Sky Kalkman. The average surplus value of Type A compensation picks (meaning this takes into account the average of all the players who “made it” and “busted”) is around six million dollars. The average value for Type B picks is about three million dollars. How does that compare to what the relievers would have brought back in a fair trade?*

* Calculating pitcher WAR is a bit involved, so I won’t be going through each step (see Dave Cameron’s primer here), I’ll simply cite each Pitchers ZiPS RoS FIP and then their projected “true talent” WAR assume that.

Gregg, who is currently projected to be a Type B free agent in the offseason (assuming the Jays decline his option) has a ZiPS RoS FIP of 4.01. Over a full “relief season” of about 65 innings and with decent “setup” leverage, that’s not quite a 0.5 WAR player, or at best about $2.5M worth of value over a full season. Gregg is getting paid $2M this season, and has a $750,000 buyout on his contract (all quoted salaries are according to Cot’s). Assuming the Jays didn’t throw any money in, there really isn’t any surplus value to be had here, so they shouldn’t have received any prospect of note. The draft pick would certainly be better, although I must say that Gregg would be crazy to turn down arbitration of the Jays offered it to him.

Jason Frasor has a ZiPS RoS projected FIP of 3.22, which comes to between 1 and 1.5 WAR over a full season, or between four and six million sollars of value. His 2010 salary is $2.65 million. Over a the half-season after the deadline, a team would project to get (again assuming the Jays don’t send any money along) between about one or two million dollars in surplus value. Frasor also projects as a Type B free agent (with a projected value of three million on the compensation picks), so so even at best the C prospect the Jays would get in a fair trade wouldn’t be as potentially valuable as the compensation pick.

Scott Downs is even more interesting, as he looks as if he will qualify for Type A status. (I highly recommend reading Mike Axisa’s piece on the implications of Type A status for Down’s free agent prospects). Downs actually doesn’t project as that much better than Frasor (both are good relievers): 3.17 FIP, between 1 and 1.5 WAR over a full season. Downs is making four million dollars this season, however, so he actually had less surplus value than Frasor. Over half a season, that’s probably one million dollars of surplus at most, which Wang shows to be about the value of a younger C propsect, and not worth nearly as much as even Type B compensation, and certainly not Type A compensation (as Axisa discusses, the Jays will still get a decent pick the team that signs Downs doesn’t have to give up a first rounder).

On this rough outline, it appears that the Blue Jays are making the right choice. The picks project as more valuable the Jays would have received in fair trade return. That’s a good sign for Jays fans. It might also show that the league is getting smarter about what they are willing to give up for half a season of a reliever.


Can Teixeira Reach His Career Numbers?

Mark Teixeira, for whatever reason, typically gets off to slow starts. Maybe it’s because he’s a switch hitter and has to fine-tune two different swings. This is the explanation he offered when the Yankees introduced him. That might not be true of switch hitters in general, but it still might be something Teixeira personally struggles with. As he explains, he’s a “power hitter that relies on timing,” so it might take him a game or 25 to get in sync. But whatever the reason, the results are clear.

Teixeira has a career .389 wOBA, but in April it is just .329. That does mean that he’s producing at an even higher level in the following five months, but those first 25 or so games still put him in a hole. This year he started off quite a bit worse, a .271 wOBA in April. He came back in May with a .365 wOBA, though that was still lower than his career .386 wOBA in May. Things got even worse in June, where he dropped to a .352 wOBA. By the end of the month it was certain that he would not reach his numbers from 2009. The chances that he’d even reach his career numbers even looked bleak.

On Monday I wrote about Raul Ibanez and the rock bottom point of his season. Not only did Teixeira have one of them, but it came at the same time. Ibanez hit his low point on June 6. Teixeira hit his on June 5 when he struck out five times in a 14-inning game against the Blue Jays, one the Yankees lost 3-2. Since then he’s been on a tear, outpacing even his 2009 season with a .299/.399/.626 line. It has come with steady improvement in both his OBP and ISO, as the following graph shows.


Click for larger

The vertical line is the five-strikeout game. Before then he was up and down, though that’s to be expected of early season numbers. But since then he has steadily increased his output. What this makes me wonder is where we’ll see these lines level off. Clearly they can’t keep going up — and the OBP line has leveled off a bit already. At some point he just won’t be able to hit for any more power, or raise his OBP above a certain point. Will that come at the end of the season? Or will he level off at some point before that?

This leads me to the further question of whether Teixeira can reach his career numbers this season. Reproducing his 2009 season is essentially out of the question. He’d have to hit .380 the rest of the way to accomplish that. But if he reaches the same 707 PA he did last year, could we see him get back to his career line of .287/.377/.540?

Teixeira has 198 PA before he hits 707. At his current 13 percent walk rate, he’d take a free pass about 25 times. He’ll also probably get hit by three more pitches (1.5 percent of his PA) and will hit maybe one more sac fly. That’s 29 PA, leaving him with 169 AB, or 602 on the season. In order to hit .287 he’d need 173 hits on the season, 62 more, so he’d have to hit .367 the rest of the way. To reach his career .540 SLG he’d need 325 total bases, or 110 more than he has now. That would mean a .651 SLG the rest of the way.

His OBP throws off the situation because of his higher than normal walk rate. For his career that rate is 11.5 percent, but to change that would throw off all the other calculations. But, just for fun, if he walked in 11.5 percent of his remaining 198 PA he’d have 23 walks, which we could make, say, 26 because of HBP and SF. That gives him 172 AB the rest of the way, so he would need a .360 BA and .651 SLG to reach his .287/.540 career marks. At the 11.5 percent walk rate he’d then reach a .386 OBP, which outpaces his career (because of the walks he took earlier in the season, I guess).

Can Teixeira hit .360/.444/.651 the rest of the way? Almost certainly not. Even at his currently torrid pace that’s an unrealistic expectation. It seems, then, that Teixeira will end the season with numbers considerably below his career marks. It happens to the best of them. But at this point his season numbers mean very little. If he continues to hit .299/.399/.626 the rest of the way I don’t think anyone in New York will complain.


Pitching to Contact in the Bronx?

Javier Vazquez’s problems this year have been well documented – his velocity is down, his performance isn’t good, and he’s been less than what New York hoped when they acquired him. However, hidden by the downturn of their newest starter is the fact that two other Yankee starters have also seen pretty dramatic drops in their strikeout rates this year, and are also different pitchers now than they were when the Yankees acquired them – CC Sabathia and A.J. Burnett.

Take a look at the three graphs below.

From top to bottom, those are the K/9 rates for Burnett, Sabathia, and Vazquez. If you’re not sure when they joined the Yankees, just look for the year in which their strikeout rate tumbles. In all three cases, the players have become far more contact oriented upon arriving in New York, and for Burnett and Sabathia, its continued on for a second year.

This isn’t to say all three are the same. Sabathia has traded strikeouts for groundballs, as he’s posting the best GB% of his career, so his overall effectiveness hasn’t changed much. While he’s a different pitcher this year, he’s not demonstrably worse. The same cannot be said of Burnett or Vazquez, who have both failed to adjust to their inability to miss bats, and are having seasons far worse than their most recent ones.

There is one commonality between them, though – all three are using their fastball a little bit more often than last year. Sabathia has gone from 61.6% to 64.5%, Burnett from 65.9% to 70.7%, and Vazquez from 49.9% to 53.4%. These are not major changes, but they’re different enough across the board that, combined with the lack of strikeouts from all three, it may be time for the Yankees front office to sit down with their pitching coaches and say “hey, what exactly are you telling these guys?”

It could just be a coincidence. It might not have anything to do with what these guys are being taught. But if I worked for the Yankees, I’d certainly want to make sure that there wasn’t something going on at the field level that was changing all these high priced pitchers that we kept bringing in, and in several cases, making them worse.


The Evolution of Groundball Rates

On Wednesday, Dave Cameron ended his piece entitled “Halladay and Verlander” with this note, seemingly fired at those of us in the prospect business:

It might not be as sexy, but getting groundball outs and limiting walks is a far more efficient way of pitching than trying to blow every hitter away. Strikeout rate is nice, but don’t let it be the only tool you use to evaluate a young pitcher – not only are Ks not the only way to succeed, they aren’t even the best way.

This is a belief system that isn’t new to me, as it was essentially the premise for my offseason Staring Down the Sinkerballers series. But, that piece was limited to discussing one type of player: the two-seamer/slider pitcher that often flies under the radar. The fact is, we need to do a better job understanding how all pitchers will see their batted balls translate from minor league baseball to the Bigs. This is a case study of just that.

I created a list of pitchers that debuted in 2009, have had 150 innings over the span of two years, and at least 150 batters faced in each season. If I did my search at the B-Ref Play Index right, and I whittle it down to players with minor league experience, there are 18 pitchers left. It’s a diverse list, with lefties and righties, groundballers and flyballers, good pitchers and bad. It’s also a group that had their entire minor league career in the MinorLeagueSplits era. Now, I’ll tell you this: there are flaws with the mLS data. We all know that. But, like anything else, until we have something better, I’m going with that. I’ll probably follow this post up at a later time using GB/FB ratios — which I have official data for — but that seems just as flawed.

So, I looked at all 18 players, and I compiled a list at the levels where they faced 150 batters (this number I keep using is important: it’s when groundball rate stabilizes for a pitcher, at least at the big league level). Let’s start, both as an introduction to my sample group and as an entryway into the data, with the career minor league (mLGB) and Major League groundball rates of each player. I have ranked them in the order of those that dropped most from the minors to Majors:

Name                MLGB      mLGB      Diff
Brett Cecil         43.2      59.7      -16.5
Brian Matusz        34.7      48.1      -13.4
Rick Porcello       51.6      63.7      -12.1
Vin Mazzaro         41.9      52.8      -10.9
David Hernandez     28.5      37.9      -9.4
Trevor Cahill       51.2      58.6      -7.4
Jason Berken        41.3      48.6      -7.3
David Huff          37.2      44.3      -7.1
Craig Stammen       48.4      54.1      -5.7
Wade Davis          40.5      45.7      -5.2
Kris Medlen         42.2      47.2      -5.0
Mat Latos           43.1      47.7      -4.6
Brad Bergesen       49.0      52.6      -3.6
Brett Anderson      52.4      55.5      -3.1
Brian Duensing      48.5      50.3      -1.8
Doug Fister         47.8      47.9      -0.1
Tommy Hanson        40.2      39.1      +1.1
Ricky Romero        54.0      48.6      +5.4

It’s interesting, of course, that a different Blue Jays lefty is on both the top and bottom of this list. But also interesting that half the players dropped their groundball rate between 3 and 7.5 percent between the minor and Major leagues. Those who attended FanGraphs Live heard the problems I have with using MLEs to project minor leaguers. While it would be easy to do this study with everyone in the MinorLeagueSplits era, create an average drop that we apply for everyone, I just don’t find it all that informative. If you want to assume a player drops about 5-5.5 percent when he reaches the Majors, you’ll probably be about right as often as you’re about wrong.

But, let’s take it a step further. I next brought the 18 into four quadrants, ranked by their MLB GB%. Here are the five least groundball-ing pitchers, and their groundball rates at each level they registered 150 batters faced at (Note: The ~ symbol appears when they did so at that level in multiple seasons. I’m eyeballing there. Again, there are error bars around this data that are unavoidable).

Name       Low-A   HighA   DoubA   TripA   MLB
Hernandez  36.8    37.6    36.7    38.8    28.5
Matusz      N/A    49.5    45.8     N/A    34.7
Huff        N/A    42.0    49.5    ~44.0   37.2
Hanson     41.6    38.6    40.7    36.5    40.2
Davis      49.5    47.5    ~46.5   ~39.6   40.5

I find this far more explanatory. If we broke this group into guys with similar stuff profiles, you’d certainly group Hanson and Davis together as hard-throwing right-handers, with similar velocities on their fastballs, sliders and curveballs. Hanson was always the flyball pitcher he’s proven to be, but Davis took some trending down before showing his true colors in Triple-A. Hernandez is close to that caliber, but his stuff was never viewed in the same light. Like Hanson, he was always a flyball pitcher, but has taken it to a new level in the Major Leagues. He’s ditched his slider, and has problematic command, which I think might be to blame for the sub-30 GB%.

I’d also group Matusz and Huff together — college lefties with good command that start their arsenal with a 90 mph fastball and an 82 mph changeup. Neither had dependable Double-A numbers in the slightest, and with their stuff, shouldn’t have been trusted as 45% guys. I could see looking at all similarly-profiled lefties and searching for something similar. But for now, we look at our next quadrant, the flyball-leaning pitchers:

Name       Low-A   HighA   DoubA   TripA   MLB
Berken      N/A    52.0    47.6     N/A    41.3
Mazzaro    56.4    53.9    52.7    ~49.2   41.9
Medlen      N/A     N/A    43.4     N/A    42.2
Latos       N/A     N/A    41.3     N/A    43.1
Cecil       N/A     N/A    59.2    59.8    43.2

Wait, there’s another college lefty with good command, a fastball around 90, and a changeup at 82, also posting some misleading Double-A numbers! Brett Cecil, come on down! Cecil throws a sinker more often than Matusz and (especially) Huff, and it really worked in the minors. Whether it’s an issue of command, or just not enough sink, it hasn’t in the bigs. Latos probably fits in with Tommy Hanson, never really hiding that he’d be a flyball guy. Medlen is just outside of that category, smaller than those pitchers, with less velocity, and a change-up as his go-to pitch. In a small sample, he was getting a ton of groundballs in the low minors, but in Double-A, showed the tendencies he’s settled into with Atlanta.

Finally, I think we have to compare Jason Berken and Vin Mazzaro, similarly sized fastball-slider guys. Mazzaro throws more sinkers, and thus, has always had higher groundball rates. But ultimately, I think this is a sign of the quality of Major League hitters: neither pitcher has stuff that’s considered particularly world-beating. Next, we have four guys that have induced better-than-average groundball rates:

Name       Low-A   HighA   DoubA   TripA   MLB
Fister      N/A     N/A    ~48.0   44.1    47.8
Stammen    55.9    ~53.5    N/A    ~54.0   48.4
Duensing    N/A    48.8    ~48.8   ~50.2   48.5
Bergesen   ~48.5   54.7    53.1     N/A    49.0

Having introduced Mazzaro and Berken, smallish sinkerballers, gives us a nice frame of reference with Brad Bergesen and Craig Stammen. Both of them are of a similar ilk, though maybe Stammen’s cutter separates him a bit, and maybe explains his greater success than Mazzaro in maintaining an above-average GB%. Bergesen is explained, I think, simply by having a better sinker. But the fact is, with all four, we do see a noticeable drop from even Double-A to the Majors. Fister is a bit of a weird duck, and hard to explain — you have to think his size, more than anything else, leads to a good groundball rate. But that’s sort of always been the case, I guess. Part of you wants to compare Duensing to the other college lefties above, but he throws a little harder, has spent most of his Major League time in relief, and his go-to offspeed pitch is a slider. And he hasn’t wavered much in terms of groundball rates.

Finally, here are the guys getting a ton of groundballs:

Name       Low-A   HighA   DoubA   TripA   MLB
Cahill     56.4    61.4    61.8     N/A    51.2
Porcello    N/A    64.1     N/A     N/A    51.6
Anderson   57.9    ~54.8    N/A     N/A    52.4
Romero      N/A    41.9    ~48.7   55.9    54.0

Ricky Romero is obviously the guy that stands out, but I hesitate to make many assumptions from his numbers. It’s pretty clear that he didn’t become interested in inducing grounders until 2008. This probably sounds like a cop-out, but it’s true: go back and read Baseball America’s scouting report of Romero from the 2005 draft — the movement on his fastball isn’t lauded at all. Fast forward three years, and they are praising the “good life” on his fastball, and referencing a new “vulcan change, which behaves like a splitter.” He’s just a different guy.

I would not hesitate to compare Cahill and Porcello, two lauded high school pitchers that are big, throw sinkers 50% of the time, and were 60% groundball guys in the minors. They are ridiculously similar, and I think tell us a lot about their type of pitcher. Finally, we have Cahill’s teammate Brett Anderson, who might be too unique to comp. His combination of movement, velocity and offspeed stuff is pretty unmatched among Major League lefties. It should be no surprise that the truly unique can sustain +50% ratios at the highest level.

That’s where we’ll leave things today. But there are some interesting groups that I think we can extrapolate and further investigate: the fastball-change lefty, the prospect-y hard-throwing righty, the smallish sinkerballer, among others. If we can understand players in the context of their own stuff, then we might be getting to a place where we can evaluate young pitchers using the tool that Mr. Cameron hopes.


A Post About Ned Yost

Actually, the title is a misnomer. This is a post about what Ned Yost thinks about his catcher position, and maybe about how baseball works in general. Yesterday, Ned Yost told the Kansas City Star that he was going to try and get Brayan Pena about 15 starts between now and the end of the season. That’s 15 of the final 49 games, or just a tiny bit more than a regular backup catcher might get.

This is on a team that features Jason Kendall as the first catcher. Kendall, who has lost all of his non-existent power (.091 career ISO, .044 this year) and is putting up a stellar 71 wRC+, for his whopping sixth year in a row with a sub-100 wRC+. He’s also 36 years old (or old as dirt in catcher years), and on a team with a 47-68 record that should be looking to next year, and yet the catcher is somehow on pace for 575 plate appearances.

Who knows how much promise Pena actually has. His .241/.285/.360 career line and 68 career wRC+ don’t scream ‘play me’ and do a lot to dampen the snark storm that would normally arise on a statement like Yost’s (a storm that is doing its best to permeate this column despite our best efforts to the contrary). But Pena does have a BABIP of .231 and an ISO of .038 right now, and those two numbers take much, much longer than 59 plate appearances to stabilize. In fact, those two stats would take longer than his 373 career plate appearances to become predictive. All we really have are his minor league numbers, and a catcher that can put up 180 walks to his 239 career minor league strikeouts deserves a little more attention from these Royals than he has gotten to date.

So we have a young catcher who is under team control for the next three years, and an old catcher obviously in decline who is under control just for next year. If we take current levels of production going forward, and use the math shown by Dave Cameron here, the old catcher would cost his team 4.7 batting runs above replacement assuming 34 games and 136 plate appearances while the young guy would cost his team 11.1 runs with the same playing time. Perhaps a team trying to create a ‘winning feeling’ in the clubhouse would care about those seven runs above replacement.

But there’s Pena’s BABIP. And his ISO. And his contact rate. If those returned (even mostly) to career levels – say, if we used the ZiPs projections from here on out – then Pena would cost the team only 2.4 runs in 34 starts. Since Kendall’s production right now is so in the norm for him, he would cost the team 4.5 runs going forward – he might actually be worse than Pena.

The worst part of this whole thing is – even if Kendall wasn’t worse than the youngster, wouldn’t a good organization pay a possible win in the standings to find out what they might have at a key position? Wouldn’t a coach that would like to stick around for next year want to know if the young guy could do more than just ‘work real hard?’ The fact that it’s not Pena taking the 34 starts, and Kendall the 15, is yet another reason why the snark storm always seems to settle around Kauffman Stadium.


Anatomy of a Collapse

Things are not looking good for the Los Angeles Dodgers. The Dodgers entered last night’s game eight games behind San Diego in the NL West and five and a half games behind the Giants. Baseball Prospectus had their playoff odds at a mere 1.9%. The trades the Dodgers made clearly show that they felt that they were in the race. With San Diego and San Francisco both winning last night, yesterday’s game against the Philadelphia Phillies was utterly key for the Dodgers.

After a three run rally in the top of the eighth inning that put the Dodgers ahead 9-2, the team had to feel good. With a mere 1% chance to win at this point, the Phillies chipped away in the eighth against Ronald Belisario, Kenley Jansen, and George Sherrill, putting up four runs on four singles as well as a Ben Francisco double.

Of course, the rally still meant that the Phillies would need to put up at least three runs in the ninth to make any of it matter, and they would have to do that against Jonathan Broxton– the same Johnathan Broxton who has the lowest FIP (2.35) among qualified relievers over the past three years. Even though Broxton hasn’t had the same kind of shutdown track record as, say,Mariano Rivera, or taking a step down, Joakim Soria, Broxton is clearly an excellent pitcher. With an average pitcher on the mound, the Phillies win expectancy was still tiny, at 4.6%. Against Broxton, that number comes down even farther.

When it comes down to it, though, odds between 1 and 20 and 1 in 30 aren’t that terrible, particularly compared to the 1 in 100 odds facing the Phillies entering the eighth. Broxton isn’t exactly a control artist, as his career and season walk rates are both above three. But one wouldn’t exactly predict that Broxton would load the bases via a HBP and two walks.

What happened next can hardly be attributed to Broxton, who did his job in inducing a Ben Francisco ground ball to third base. If it wasn’t for Casey Blake letting what should’ve been an easy play go five-hole, the Dodgers could either have gotten an out at home or possibly turned a 5-4-3 double play. Instead of either bases loaded, one out, and a three run lead or the ideal runner on third, two out, and a two run lead. Blake’s error resulted in two runs scoring and runners on first and second.

The result of the play was a 47.8% win expectancy for the Dodgers. Were the Dodgers to record the out at home, their win expectancy would’ve been 88.6%; a double play would have left them with a 93.7% win expectancy. These totals are increased somewhat by the presence of Broxton on the mound, but the error was clearly extremely costly for LA, much moreso than Broxton’s loading of the bases, which brought the team’s win expectancy down from 96.4% to 66.9%.

Still, the Dodgers were up by a run, and even with runners on and nobody out, the game was essentially a coin flip. Carlos Ruiz tipped the coin in the Phillies favor with a deep double to left field, plating both Francisco and Jayson Werth, and the Phillies won the game. As much as the Dodgers needed to win this game to really have any hope whatsoever of making the playoffs, this game was probably more important for Philadelphia. The victory allowed the Phillies to keep within two games of the Braves in the NL East race and within one of the Giants in the Wild Card, with each team winning last night.


[Click to enlarge]

As we can see in the Game Graph above, this one looked like it was over in the late innings. But there’s a reason that the Phillies’ win expectancy never read “0.00%” and the Dodgers’ never read “100.00%.” After 8.5 innings with only one play with a leverage index about 2.0, the 9th inning provided two of the most exciting possible plays in baseball, with leverage indexes above 5.0. It just shows that, as the legendary Yogi Berra said, “it ain’t over until it’s over.”


Lyle Overbay & Graphs

Lyle Overbay passed through waivers yesterday which registers as a non-shocking development given the Jays inactivity in moving him to another team over the last year-plus. Overbay has a quiet genius about him in that he was consistent throughout his career.

In 2004, his first full season in the majors, he posted a WAR of 2.4. The next year? 2.5. The year after that? 2.5. Then he had a down (and shortened) season with the Blue Jays, but after that, his WAR have been 2 and 2.4. This season he’s on pace for around 1.5 wins, depending on playing time, but his career WAR should top the 14 mark without hassle.

Overbay’s consistency got me wondering: just how common are two-win first basemen? So, I went back and looked at 2002-2009 using our leaderboards with a per-season minimum of 300 plate appearances at first base. I tallied each year up by the amount of players who had at least five WAR or greater and so on. Each player is only counted once; meaning Albert Pujols is in the 5+ WAR column only and not duplicated in the 4+, 3+, and 2+ columns as well. Here’s the graph:

Last season appears to be a golden age for first basemen, both elite and above average alike. Let’s take this a step further, though, and combine the first basemen into two groups: those who produced 2 or more WAR and those who produced fewer than 2 wins. From there, let’s make it interesting and make the grouping in which Overbay belonged to during each season yellow. Here’s how that looks:

What does this tell us? Well, besides the obvious – that Overbay was often above 2 WAR – that he was in the first base minority in 2008, 2005, and 2004. Maybe, then, it’s not a surprise that he was traded following the 2005 season, and trade rumors heated up for him once against after the 2008 season.


Freddy Garcia Is Staying Alive

Rare is it when a pitcher’s ERA, FIP, and xFIP are in a state of complete accord. Nearly as rare is Freddy Garcia pitching more than 100 innings in any given season during these twilight years of his career. All together, I suppose that makes Garcia’s 2010 season an exotic bird with colorful – if frangible – feathers. Twenty-one starts into the season, Garcia holds a 4.90 ERA, 4.90 FIP, and 4.70 xFIP with 119 innings pitched.

The last year-plus has been a tortuous path for Garcia. Signed to a minor league deal with the New York Mets, Garcia made starts for their organization before dismissal. Garcia then latched on with the team he spent the 2004-2006 seasons with and eventually made nine starts, pitching well enough for the Sox to exercise his option, worth $1 million with $2 million in additional performance-based incentives.

Garcia’s fastball still lacks life and sits at a career low 87.9 miles per hour. He’s adjusted by using it a career low 30.5% of the time. For comparison, his next lowest usage rate came last season at 43.4%. Garcia is using a combination of his changeup and split-fingered fastball instead and our pitch run values have his changeup as his best pitch and the splitter as his second best – albeit in the negative, as are his other three offerings.

When Garcia gets ahead in the count, his fastball has the tendency to become a rumor. He uses it 15% of the time or less in each of the two strike counts with the exception of 3-2 counts. It’s only when he falls behind that Garcia leans heavily on his heater, which is about as hot as the unthawed. It should come as no surprise that one-third of Garcia’s homers have come when he trails and another 11 on even counts. When he gets ahead, batters have a .373 slugging percentage against him, when he falls behind, batters are slugging .536; league average for those situations is a .306 slugging when the pitcher leads and a .498 slugging when the batter leads. In other words: when Garcia falls behind, his offerings are being smoked, and he is even being hit harder than normal when he does his job.

Those statistics come with the territory for right-handed starting pitchers with Ronald Reagan era fastballs. Not that Tupac Shakur era fastballs guarantee success, but so much of pitching is luck-based already, having a slow fastball just shaves the margin of error a little more. That Garcia himself acknowledges those limitations in an implicit manner is one of the reasons he’s been able to succeed as an above replacement level pitcher this season.

And that’s something all the metrics agree on.


Santana Picks Up Some Ks

On the surface, Johan Santana has had a solid season, putting up a 3.06 ERA supported by a 3.47 FIP and a 3.75 tERA. However, that masks a miniscule HR/FB rate of 4.6% and an xFIP of 4.53. If his HR/FB were to return to its normal levels – around 9% – Santana’s new inability to miss bats would likely be exposed. His swinging strike rate, never below 11% since 2002, has dropped to 8.9%, dangerously close to average for such a previously dominant pitcher as Santana. Unsurprisingly, his strikeout rate has dropped in tandem from 7.9 to 6.2, resulting in the higher xFIP.

Santana looked more like the Johan of old today against the Colorado Rockies, racking up 10 strikeouts against only two walks in a complete game shutout against one of the better offensive clubs in the National League. It was Johan’s old standby, the changeup, which made fools out of Rockies hitters. Santana pulled the string 40 times on opposing batters today, with 30 of them going for strikes. Rockies batters swung and missed a whopping 11 times, a 27.5% rate. That’s nearly double the 14.3 whiff (misses per pitch thrown) rate on Santana’s changeup this season to date.

Santana’s fastball didn’t show any more life, mixing around 86-90 mph and only drawing one swinging strike in 27 pitches. That’s right, Santana threw 13 more changeups than fastballs in this outing, a striking deviation from his average distribution of 58% fastballs to 27% changeups, with the remaining portion fitting in as sliders. It’s possible that a key to continued success for Santana will be a steady diet of changeups to opposing batters.

For the Mets and their fans, some of whom have compared Santana to the slightly less impressive Jarrod Washburn (and quite aptly, looking at Washburn ’09 vs. Santana ’10 here), this has to be encouraging. The fastball velocity is still down, but the changeup was working its former magic today. For the Mets brass in particular, who will pay Santana at least $77.5 million through 2014, this start has to bring some smiles.


Chipper Jones Out for the Year with a Torn ACL, Career in Jeopardy; Just How Good Was He?

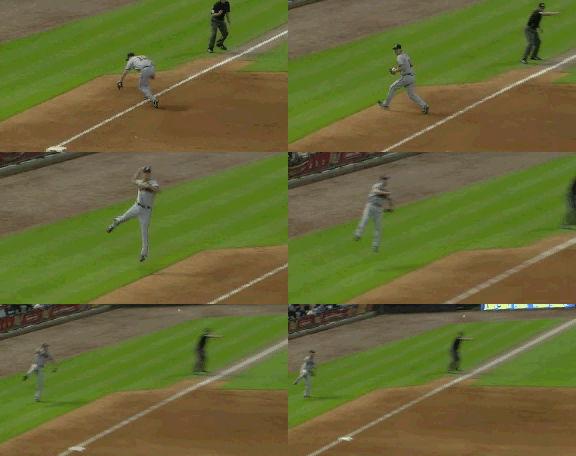
Yesterday, Chipper Jones suffered an ACL tear while making a spectacular play at third base; he’s almost certainly out for the rest of the year, and considering that he was retiring considering retirement at the end of the season, there’s a possibility that we have seen his last game in a major league uniform. (Jones’s agent has said he “doesn’t believe [Chipper] will simply retire without attempting to first rehab the injury,” so this is just preliminary speculation at this point.) Chipper Jones spent much of the year in the offensive doldrums, but had begun to heat up in the month of August, where he was 12-for-30 with three homers in nine games for the Braves. So the Braves will miss his bat. But they’ll miss his presence even more.

Chipper Jones was drafted by General Manager Bobby Cox as the first overall pick in 1990, famously going ahead of fireballer Todd Van Poppel in a draft-day override. Since then, as Jack Moore has written, he has been the greatest franchise player — has provided the most value to the original team that drafted him* — in modern history. His former teammates Greg Maddux, Tom Glavine, and John Smoltz will probably go into the Hall first, but he’ll be remembered as the franchise’s best hitter since Henry Aaron.

(*As reader Blue points out in the comments section, this should read, “… has provided the most value to the original team that drafted him with the first overall selection in the draft.”)

He’s had a strange career, though. His career began with an ACL tear, just before the start of the 1994 season, and looks like it might end on one. He won one MVP, and received votes in 11 other seasons, but never again finished higher than sixth. Until his 36th birthday, he never led the league in any traditional stat, until he finally won a batting title in 2008. (As a result, using the old Bill James Hall of Fame tools, he’s way above the Hall of Fame norm in HOF Standards and HOF Monitor, but way below the norm in Grey Ink and Black Ink.) From his rookie year in 1995 until 2003, Chipper Jones played in more than 94% of his team’s games every year; since then, he only once played in as many as 140 games. This will mark his first trip to the DL since July 2008, but since then, there have been ten separate occasions on which he has missed multiple consecutive games. While he’s been one of the best-hitting third basemen of all time, his defense has been below-average at best. And his admitted marital infidelity is pretty hard to defend, as well.

Still, as he’s gotten older, he’s been an unselfish leader on the team. In 2002, just three years after his MVP, he voluntarily moved from third base to left field to accommodate the team’s acquisition of Vinny Castilla; then, two years after playing his last inning at third base, he moved back. The left field move is commonly blamed for his numerous leg problems over the years, as they began to crop up shortly after he began playing his new position. On numerous occasions, he has offered to restructure his contract with the Braves to increase their payroll flexibility.

By now, most fans and baseball writers have gotten used to the idea of Chipper Jones as a Hall of Famer, so he probably won’t run into the problems that Ron Santo has had. But they may not realize quite how good Chipper has been. Last offseason, blogger Mac Thomason noted that, in Lee Sinins’ Sabermetric Encyclopedia last offseason, Jones led all third basemen in the modern era in Runs Created per Game and was in a virtual dead heat with Eddie Mathews at the top of the list for Runs Created Above Average. Chipper is 37th in all-time WAR, and sixth among third basemen (seventh if you consider Alex Rodriguez a 3B), behind Mike Schmidt, Eddie Mathews, Wade Boggs, Brooks Robinson, and George Brett.

Thomason goes on to say:

Chipper is the greatest player in Atlanta Braves history — and they’ve had some pretty good players. He’s clearly ahead of Dale Murphy, and even ahead of Hank Aaron (not counting the Milwaukee years). The only player who could have a case, because they’re so different, is Greg Maddux, and Chipper’s Braves career is twice as long. Scored purely as a hitter, he might be the best third baseman of all-time; he has the highest slugging percentage of any third baseman, and the highest OPS, and is third or fourth in on-base (depending upon if you count Edgar Martinez). I’d still rank Schmidt first, for a number of reasons, but second is muddled, and Chipper has a pretty good argument.

Whatever the future holds, he has had an incredible career.