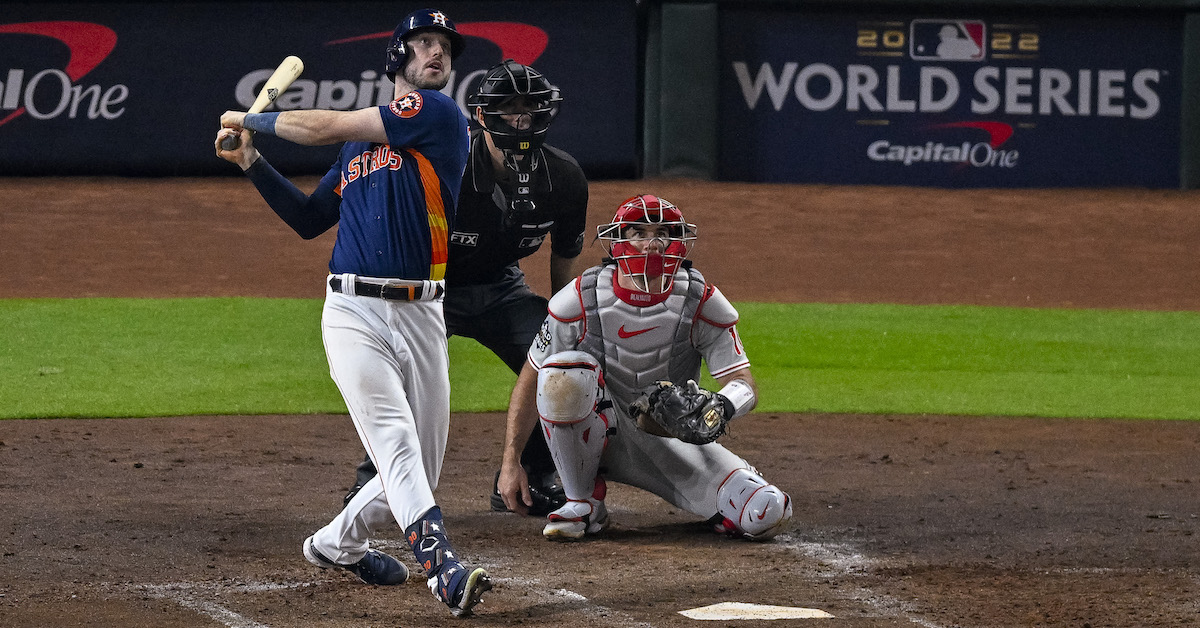
After coming up short in 2021, the Astros are back on top of the sport with their second championship in six years. Come playoff time, Houston consistently executed its gameplan better than any other team. This year, dominance came in the form of historically effective relief pitching and timely hitting. On the whole, the Astros’ hitting wasn’t strikingly better than any other team, but when given the chance to put up enough for their bullpen to hold it down, they did that with no problem.
That last part is what has lingered in my head for the past week or so. Over the last six years, it feels as if Houston’s hitters have figured it out in big moments while other teams have stumbled. Even in this year’s tournament, when there was dominant pitching across the board, Astros hitters made the most of mistakes. And Houston could rely on a large group of guys, including but not limited to Jeremy Peña, Alex Bregman, Yordan Alvarez, and Kyle Tucker. Compare that to teams like the Yankees and Phillies, who had to rely on just a few players throughout.
But why is that? How can Houston get timely production from any guy in the lineup while others can’t overcome their holes? I still haven’t gotten close to a definitive answer, but I think I’m making progress on a reason why. Read the rest of this entry »
It’s time to conclude the series on position player arm strength with the most impressive of them all: catchers. It was a joy covering infielders and outfielders, but it’s time for backstops to have the spotlight. They might now throw quite as hard as their position player counterparts, but let’s keep in mind that they do what they do out of a squat with no room for error. They can’t bobble, hesitate, or mess up their footwork and need to receive the ball and deliver it to second base in less than two seconds.
Let’s set some ground rules for the next iteration of this exercise. Baseball Savant sets their default minimum number of attempts to qualify on the pop time leaderboard at five, so we’ll stick with that. There’s thorough research that explains arm strength as the main component in pop time; because of this, I put strong value into it. Exchange speed still matters, but in this case, it’s more interesting to see how a player moves his body to take advantage of his arm strength.
Anyway, after sorting through the top of the leaderboard, I searched for clips of plays where the catcher especially needed his arm or just made so perfect of a throw that I couldn’t resist talking about it.
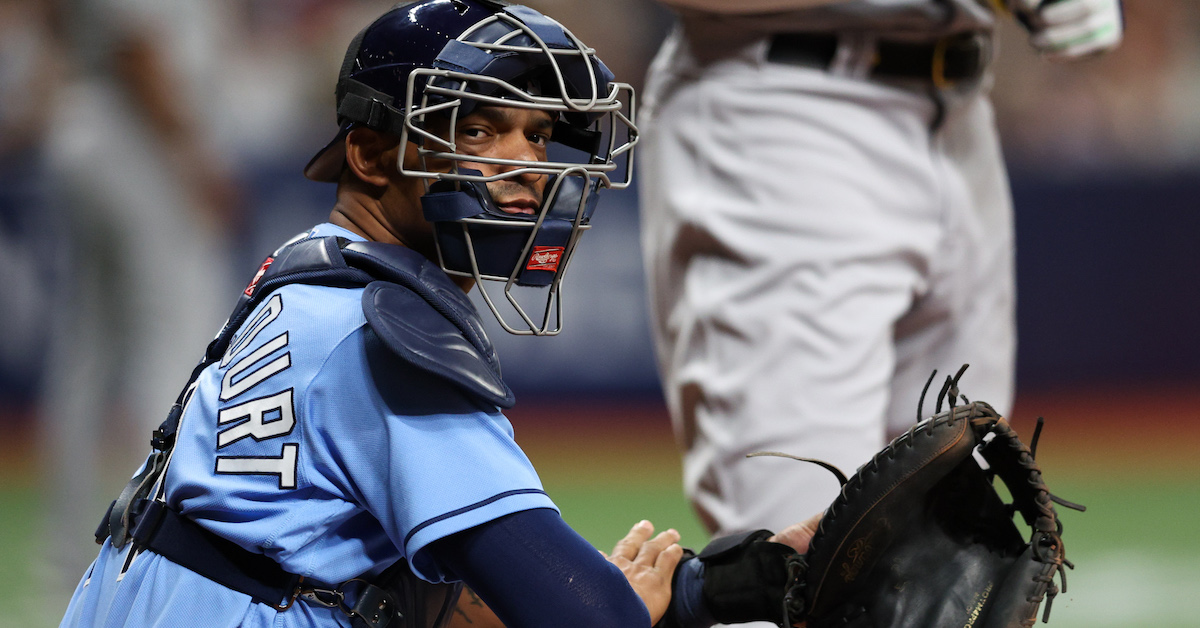
Christian Bethancourt (no. 1 overall, 88.3 mph)
There is a new king on top of the catcher arm strength throne, and his name is Christian Bethancourt. That’s not too shocking; he threw in the mid-90s off the mound.
One thing about this particular caught stealing that I find very cool: we get to see how big of a jump Will Brennan got off Corey Kluber. With that jump and a 78-mph sweeper to handle, Bethancourt had no business making this play. The difference is how he perfectly cheats with a slight quarter turn of his torso as he’s waiting for the pitch to come in. It’s usually difficult to do this move in the heat of the game, but he knew it was the only chance he had to catch the runner.
Typically a catcher would let the ball travel further than this, but Bethancourt’s loopy, pitcher-like arm swing means his low transfer is the most efficient for his body and mechanics. After the smooth transfer, he placed a seed right on top of the bag for Wander Franco. Impeccable mechanics with no room for error. Read the rest of this entry »
Two weeks ago, Rawlings and MLB announced this year’s Gold Glove finalists. The inclusion of Juan Soto, who posted the worst OAA among qualified outfielders but ran a 145 wRC+, prompted me to examine the link between Gold Glove finalists and offense. I found that Soto’s selection was likely due to the halo effect, a cognitive bias which may have led voters to extend a positive overall impression of him to his fielding.
Fast forward to this week, when Rawlings and MLB announced this year’s Gold Glove winners. While Soto was not among the 20 victors, the 16 non-pitcher, non-utility winners out-hit the other 32 finalists 115 to 107 in wRC+. Last year, the winners out-hit the other finalists 114 to 107 (I excluded this year’s utility finalists/winners to make the comparison). In my previous article on Gold Gloves, I also found that finalists out-hit other qualified fielders 109 to 103 in wRC+ last year and 110 to 102 this year. Read the rest of this entry »
If you’re a fan of balls in play and general athleticism, I’ve got bad news for you: the 2022 playoffs have featured the highest strikeout rate in playoff history, a whopping 26.6% excluding intentional walks heading into last night’s game. More than a quarter of plate appearances have ended without the fielders moving, the runners tearing around the bases, or indeed anyone having reached at all. For what it’s worth, the unintentional walk rate is only 7%; the strikeouts are what’s out of hand, not the non-contact plays.
Why is this the case? I can think of many reasons. Maybe the teams that made the playoffs are jam-packed with the best strikeout pitchers they can find. Perhaps the parade of relievers Jay Jaffe noted last week are just too effective. Maybe that extra velocity from starters is to blame. Hitters shouldn’t escape scrutiny, either; maybe they’re swinging for the fences more with the bright lights of October on them and accepting more strikeouts as a result. It could be matchup-based, or pitchers could be using their best pitches more often. It could be better scouting of hitters’ weaknesses, or just an accident of a few pitchers getting hot, or any number of things. Read the rest of this entry »
How much should a team’s postseason strategy differ from its regular-season tactics? Overall, probably not that much; if your club makes it to the postseason, it ain’t broke, so to speak. Further, I generally believe the postseason is not the time to experiment with new gameplans that always carry some heightened risk. But historically, there are myriad ways that teams have shaken things up come October.
This especially seems to be the case when a team is down in a series. Take the Yankees in the ALCS this year — that squad went with three different leadoff hitters in four games, moves that had little to do with platoon splits. They faced one lefty starter during the series, Framber Valdez, and had righty Harrison Bader lead off that game, but Bader also led off in Game 4 against fellow righty Lance McCullers Jr.; lefty Anthony Rizzo and righty Gleyber Torres led off the other two games against right-handers. The Yankees also had three different starting shortstops in the series. Read the rest of this entry »
When Juan Soto was announced as a finalist for the Gold Glove this year, I was perplexed. To say that the right fielder struggled with his defense this season would be an understatement. As recently as Game 2 of the NLCS, he was still making (or, failing to make) plays like this:
So I turned to Rawlings’ official website to get a better understanding of how Gold Gloves are won. In order to qualify for a Gold Glove, infielders and outfielders must have played in the field for at least 698 innings through their teams’ first 138 games. Maybe Soto grades out better in this subsample. In the absence of custom date ranges for advanced fielding statistics, I compared Soto to the 76 other players who were in the outfield for at least 698 innings on the season. Here is where he ranked:
Last week, when I wrote about some of the league’s strongest throwers, I ended up exclusively featuring outfielders. The nature of the position is more suited to making full capacity throws than in the infield, and as a result, only outfielders ended up on the list. Because of that, I feel obligated to acknowledge and highlight some of the strongest throwers in the infield. On average, these throws won’t be quite as fast. The footwork and time required to throw the ball is one reason for that, and that will be the focus of this piece.
Similar to last time, we’ll have to sort through some qualifications on how I came up with this short list of names. The first is at least 100 throws in the infield. One thing I ran into when sorting through the leaderboard was that several players near the top were utility players, rather than just strictly infielders. That led me to using the 2B/SS/3B filter and sorting the list by the overall throws at those positions only. See the full leaderboard here.
After working that out, I wanted to select plays where a player needed their plus arm strength to get an out. For example, a shortstop and/or third baseman needs to fire a rocket when moving multiple steps to use their backhand. A second baseman needs to have the correct footwork to fire a ball when ranging up the middle or quickly spinning a double play. Those are the types of plays I’m looking for, but they were harder to find than you would expect, given how so many plays in the infield are routine. I started with about 15 players from the top 20 on the list and worked my way down to a representative sample of five. Now, let’s get into it. Read the rest of this entry »
We live in an era where every team, to some degree or another, embraces modern analytics when assessing itself and the rest of the league. Wanting to know about the numbers that drive baseball has filtered into fandom as well, which is why you’re here on this very website! But despite all the progress the stathead crowd has made over the last quarter-century, when it comes to the playoffs and playoff results, many fans seem more inclined to defenestrate the numbers and attribute the losses to all sorts of causative elements beyond a surplus or dearth of players just happening to have particularly good games that week.
In the worst case, failing to win two of three games or three of five is attributed to some kind of character flaw. At best, the loss is because of some fundamental flaw in a team’s construction, typically something that sabermetrics is to blame for, no matter whether the team is sabermetrically inclined or not. Here’s one example of very common thinking along these lines just from the last couple of days. It’s from a fan on Reddit, so I’m not specifically attributing them, mainly because I don’t want to risk social media pile-ons:
The postseason is the real season from now on, so the focus shouldn’t be on sabermetrics as much as it has been. With the playoffs being expanded, 111 wins doesn’t mean squat. Shift some of the focus to bringing in guys who play with fire and aggressiveness and will situationally hit rather than live and die by the long ball. If it costs us some wins during the regular season, so what?? It’s the little things that win the most important games.
With three of MLB’s four 100-win teams already out of the playoffs and the 99-win team pushed to the brink but ultimately surviving, these types of incriminations will be common this season. The Dodgers didn’t lose a 60/40 matchup (the ZiPS projection for the series) because they were simply outplayed over four games, but because something was broken in how the team was built. Depending on who you listen to, you can hear the same type of grumbling about the Mets and Braves.
Since questions should be explored rather than dismissed, let’s look at playoff overperformers and underperformers over the Wild Card era (starting in 1995) and examine if there really are consistent patterns behind which teams are overperforming or underperforming in the postseason. And since this is illustrative more than anything, I’m trying to keep it as simple as possible, within reason. Read the rest of this entry »
I’m not sure about you, but I’ve been eagerly awaiting the release of Statcast arm strength data for a while now. At the end of September, the day finally came, inspiring me to dive into the metrics of some of my favorite throwers in the league. Fielding mechanics are an under-appreciated part of the game. So much goes into having the appropriate footwork to direct yourself towards a base in order to make an accurate, strong throw, and some do it better than others. With the help of the Statcast Arm Strength leaderboard, I’m going to show you exactly what sets those players apart from the rest of the pack.
There are a few different ways to sort through the leaderboard. You can change the minimum number of throws if you’re mainly interested in finding who has the highest peak arm strength, regardless of how many total throws they’ve made. I settled on 100 throws, the default on the leaderboard. From there, I set out to find concrete examples of players near the top of leaderboard making accurate throws to nail runners between second base and home. Why? Because throwing isn’t just about arm strength – accuracy also plays a big role when it comes to outfield throws. The time it takes for a fielder to step to a ball or move their glove across their body can be the difference between a runner being called safe or out, while a strong and accurate throw gives their teammates the best chance to make a play. At home plate, throws on a fly or one long hop are crucial for catchers. It’s extremely difficult to make a play on a short hop while trying to get a tag down. After my search, I settled on five players from a sample of 20 to 25 who showcased great footwork and instincts to pair with their strong, accurate throws. Below is a representative play for each. To MLB’s Film Room!
Nate Eaton, Kansas City Royals (no. 1 overall)
Nate Eaton has an absolute cannon for an arm. Of all the players in the league with at least 100 throws in 2022, he ranks first on the arm strength leaderboard with an average throw of 98.1 mph. Statcast calculates this number by averaging the top portion of a player’s throws. Eaton is the only player with a number above 98 mph; he also has the highest maximum throw at 103.3 mph. There are only a few players who make your jaw drop when they make throws and Eaton is one of them.
After Gary Sánchez lined this pitch down the left field line, Eaton had a beat on the ball and immediately knew how to attack it. Knowing Sánchez’s speed, he got to the ball and took a few extra steps to plant on his back foot and push a speeding mack truck’s amount of force into the ground. I sometimes get frustrated watching position players throw because they forget their glove side exists. That isn’t a problem for Eaton. After planting, he creates a perfect angle to use his left arm as a coil to throw off of, leading to a seed right over the bag and a nice outfield assist.
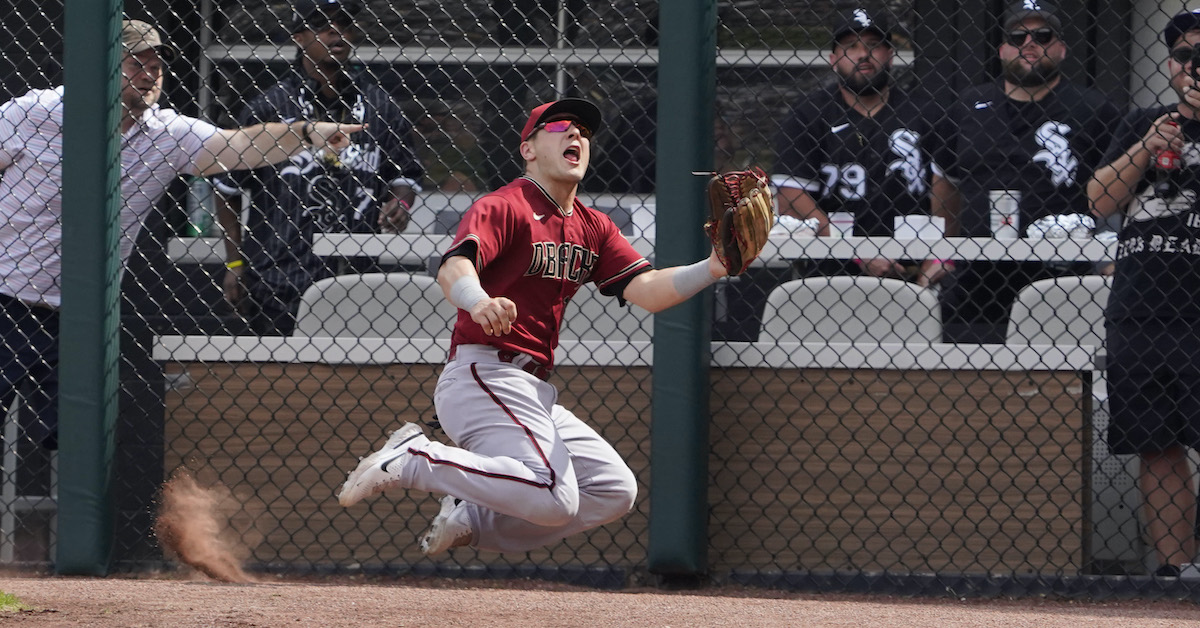
Aristides Aquino, Cincinnati Reds (no. 3 overall)
It isn’t hyperbole to say that this is one of the most impressive throws you’ll ever see. Some of the best opportunities for a guy to make a play with his arm come after a misread, when he has overestimated his chances of making a play with his glove. After Aristides Aquino jumped up on the wall to save a few runs, the ball ricocheted off and forced him to scurry after it. After gathering himself and seeing how far Rhys Hoskins was from home, he knew he had a shot.
The two most important parts of this throw are the lead leg block (foot plant) and the crazy sub-scapula adduction (pinching of both scapula). Foot planting like this after running is nothing to bat an eye at. That, on top of his hyper mobile scapula, equated to a beautiful throw. Aquino’s max throw this year was 101.6 mph. I imagine this was pretty close to that.
Michael Harris II, Atlanta Braves (no. 18 overall)
Michael Harris II isn’t quite as large as Eaton or Aquino, making this throw and his maximum throwing velocity of 100.0 mph incredibly impressive. And unlike Aquino and Eaton, this play came on a standard outfield groundball. Harris played the hop perfectly, used a pro step to direct himself, and threw a missile through the would-be cutoff man for a perfect one-hopper to nail Luis Guillorme at the plate.
The pro step is a simple fundamental move where you take your throwing-side leg and swing it right behind your plant foot to properly align yourself toward the ball’s destination. It’s a quick move and the perfect one for attacking a grounder you need to make a throw on. It’s not in this view, but Harris also finishes with a nice little spin after releasing, also known as a janitor throw. It’s a reciprocal movement for the quick rotation that a throw like this requires.
Aaron Judge, New York Yankees (no. 25 overall)
Aaron Judge ranks 25th (92.3 mph) on the arm strength leaderboard. You might expect to see him ranked higher given his size, but if you watch him regularly, you know that he tones it down to make accurate throws like this one. I’m not sure there is a better baiter in the league than Judge. His awareness and feel around the short porch in Yankee Stadium allows him to fool runners into thinking they have a shot at second base.
Tommy Pham is pretty fast! His 64th percentile sprint speed is decently above average, yet, Judge makes him look slow as molasses as he waltzed to this ball in the corner. The fundamentals here are all impeccable. Once Judge knows he can’t get it on the fly, he reorients himself and prepares his hands for a smooth transfer. That part reminded me of a catcher. As a backstop, you’re taught to transfer the ball as deep into your body and as close to your ear as possible when preparing to throw a runner out. It leaves little room for error. Judge did exactly that when reacting to this hop off the wall and made throwing out Pham look easy with a perfect no-hopper. If I had to guess what his hardest throw of the year was, it would be this one.
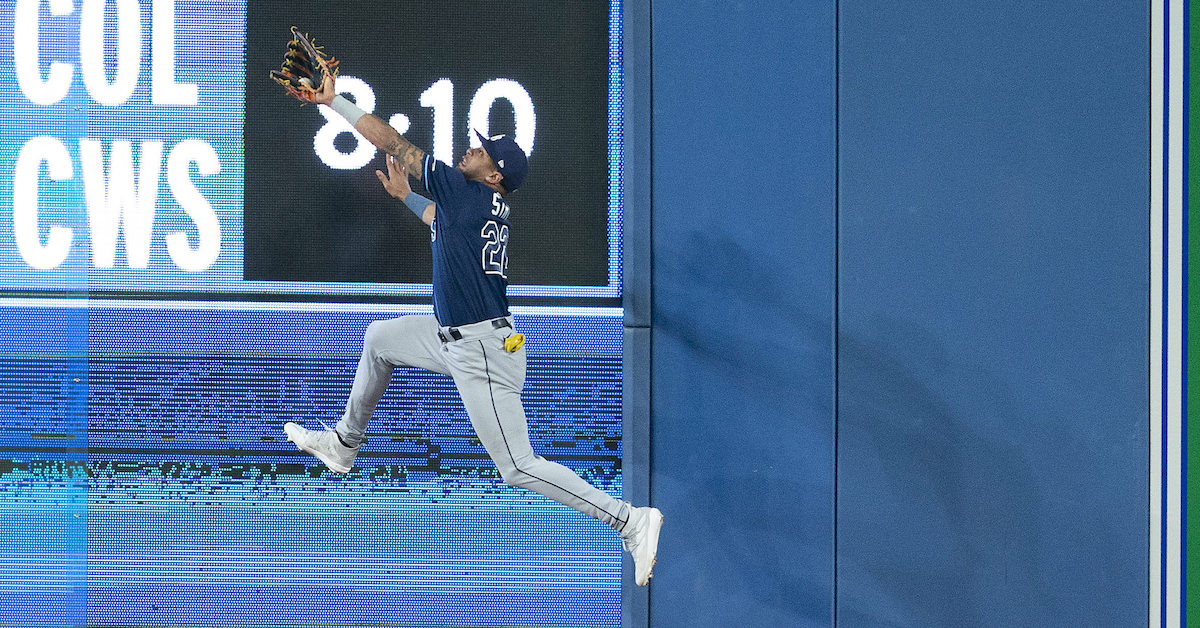
Julio Rodríguez, Seattle Mariners, (no. 14 overall)
Speaking of baiting, this play by Julio Rodríguez was prime example of the skill. As the ball was lined into center, Rodríguez remained calm and threw up his hands as if he was preparing to catch it on a line. Little did Lourdes Gurriel Jr. know, this ball wasn’t even close to being caught on a fly. This is a combination of lack of awareness and trickery leading to a perfect chance for Rodríguez to nab Gurriel on a force out.
He wouldn’t have been able to do this without his 96th percentile arm strength. Ranked 14th, Rodríguez is a threat to throw out any runner. Typically, a player should have no chance of getting a force out at third base from the outfield, but a slight hesitation due to the hand deke was enough for him to unload a pill. Unlike Harris, Rodríguez opted for a mini crow hop and not a pro step. It’s a slower movement, but my goodness, if you can throw a ball this hard off a crow hop, then I’d say you’ve made the right decision!
I’m going to have a ton of fun with this new leaderboard. To me, a high throwing velocity is just as impressive as a high exit velocity. Seeing arm strength numbers on broadcasts will add interesting insight and context to games. How fast does a throw need to be to turn a double play or nail a runner at home? These are great questions that I’d love to see answered. For now, I’ll leave you with this. Arm strength is the first step in being a great thrower from the outfield, but that doesn’t mean you can discount the importance of accuracy. Each of the throws I highlighted today has something in common in addition to their impressive speeds: they all ended up right over the bag or plate.
Everybody loves a shiny new tool. A new tool holds the promise of a better future. “This new spatula,” we say to ourselves, “will transport us to a world of fluffier pancakes.” “Loved ones,” we say to our loved ones, “this cordless drill is going to revolutionize the way we drill holes into things, if and when we decide to start drilling holes into things.”
Statcast’s Outfielder Jump Leaderboard is very shiny. For balls with a catch probability of 90% or lower, it lists every player’s average in several categories. Playing with this leaderboard, I envisioned a bright new future. A future where I could definitively tell anyone unfortunate enough to be within earshot whether it’s more important to get a good jump on a ball or take a good route to it.
Predictably, I broke the tool immediately. Or at least, I thought I did. What I noticed was that the players who took good routes tended to be, well, bad. They had worse reactions, bursts, and Outs Above Average. Most damningly, they counted among their number one Kyle Schwarber. That made me curious. Read the rest of this entry »