You’ll often hear of a pitcher “wasting” a pitch. Up 0-2 in a count, for example, the pitcher fires off something well out of the zone, hoping the defensive hitter will hack at it, missing or putting the ball in play weakly. The cost here is minimal – the cost of that pitcher having thrown an extra pitch and the change in count from 0-2 to 1-2.
On April 2nd, 2014, just one day removed from April Fools’ Day, the Houston Astros turned in the lineup for their game against the New York Yankees. Dexter Fowler would bat leadoff, Matt Dominguez would hit second and Robbie Grossman would bat in the three hole. The cleanup spot would be filled by Jose Altuve. Altuve is listed at five feet, five inches tall. Since that fateful day on April 2ns, he is now tied with Freddie Patek as the shortest player to bat cleanup since 1974.
Here comes the caveat that the Astros are doing their own thing at the moment and what they do should not be seen as some sort of new-age thinking in regards to winning baseball games. Short dudes in the four hole are not the new market inefficiency. Altuve’s odd lineup placement is just a phase. Like that one weird cousin of yours, Houston is taking some time to figure some stuff out right now.
Billy Heywood never actually managed the Minnesota Twins. Billy Heywood was a movie character, the titular character from the movie Little Big League. When you think about it, he was technically more of a manager than any of us will be, in that he got to wear a uniform and sit in actual major-league dugouts. The idea behind Little Big League is that Heywood is bequeathed the Minnesota Twins from his grandfather. The Twins stink and Heywood decides to fire the manager and instill himself into the position. The Twins start winning and all the players and Heywood himself find out a lot about themselves in the process. It’s a fairly dumb movie.
We are still quite a ways away from quantifying just to what extent a manager can affect a team, and perhaps further away from quantifying to what extent a manager who is a child can affect a team. There are so many variables, so many anecdotes from players about how managers can influence a winning attitude, that we really can’t put a number on most things. Some we can, like bunting, since a manager is largely responsible for calling those plays. He’s also responsible for initiating intentional walks.
Intentional walks are perhaps less of a lightning rod in our community than something like sacrifice bunts, but there is still a general idea that intentional walks are largely unnecessary, and can even be counterproductive at times, since they are allowing one of the things teams do not want — opponents on base. But as it happens, managers — or perhaps others in front offices that influence managers — appear to be getting smarter about intentional walks.
Foremost, a note on the research. I looked at play-by-play data from 1974 forward, the period in which we have the most accurate data of that kind. Obviously, this only entails an official four-finger, standing catcher type of intentional walks. There are certainly times when pitchers intentionally pitch around a player, but that isn’t really something we can look up definitively.
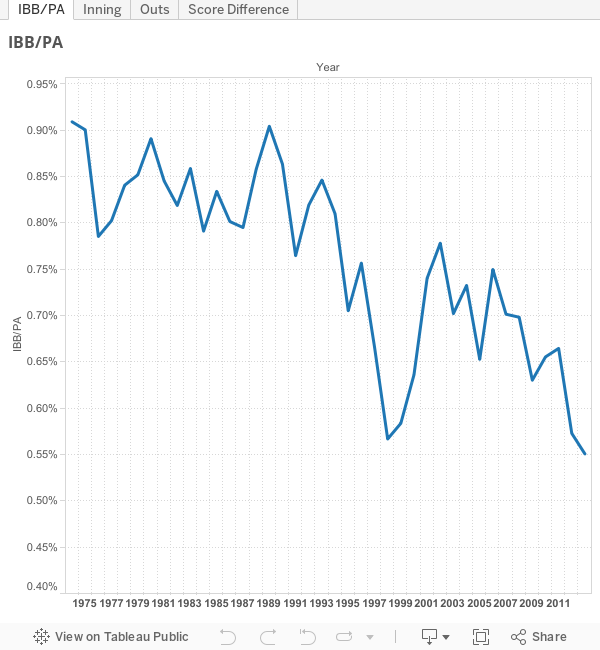
The first chart shows simply intentional walks per plate appearance. There was a sharp drop in the 90s, followed by a large spike in the early 2000s. The easy answer for that spike is that it was a reaction to the power surge showing among hitters that began in the late 90s — managers simply thought it to be more beneficial to put the big sluggers on base rather than have them hit. This, of course, culminated in 2004 when Barry Bonds was intentionally walked 120 times, accounting for almost 9% of the total intentional walks that year. We don’t know if that’s the reason for sure, but it seems like a fairly good bet. Nevertheless, that craziness has subsided, and we now see that IBB levels have leveled off back to the levels seen in the late 90s.
But something else has also happened, as the dirty cheaters who clicked on the other tabs have already figured out. Intentional walks are being used in more high-leverage situations than ever before. They now occur with more outs, tighter scores, and in later innings.
Without breaking down each base/out scenario, we can make a broad statement that intentional walks, if they make sense at all, usually make more sense in the later innings. Walking guys in the fifth or sixth is fairly poor strategy, in fact. Right now, we see that the average IBB happens in the 7th inning, and that is probably skewed a little low thanks the the NL’s always-make-the-pitcher-hit strategy.
More outs when putting a guy on is also a good thing — two outs being ideal, of course — since giving a free pass with fewer outs can lead to more runs for the batting team. In 2013, major league teams were averaging 1.5 outs when issuing a free pass. This ostensibly means that just as many teams issued a free pass with one out as they did with two. And while it’s historically high, that number hasn’t fluctuated all that much since 1974. Teams still need to work on this a bit, it seems.
The average score difference — about 1.38 runs in 2013 — is also trending downward, meaning the managers are using intentional walks when the games are closer. This also points to high-leverage usage. Teams are looking to keep the game close, or maintain their slim leads by bypassing the other team’s biggest threats. On the whole, if you’re going to just walk a guy, that’s probably the best time.
Without getting incredibly granular, it’s hard to make a mountaintop-worthy announcement that teams are figuring out how to use the intentional walk properly. There’s more research to be done here.We do know that the overall frequency of the IBB is down, which is good. We also know that when they do happen, they are happening in higher-leverage situations than five, ten, or 15 years ago. This is almost certainly good. I don’t remember if Billy Heywood every issued an intentional walk, but the fact that he was supposed to exist in a world just like ours save for the fact that a kid ran a baseball team, it seems safe to say he probably did. He may have done it in the fifth inning of a game his team was winning with one out and a man on. If so, that would have been a poor move. He may get a pass because he was 12 years old. Perhaps a petition campaign to teach run expectancies in elementary school is in order.
Remember Jake Fox? Jake Fox was a catcher/third baseman/outfielder for the Cubs/A’s/Orioles/Pirates. He didn’t really shine at any defensive position, and his hitting really wasn’t any better. He cracked a wRC+ north of 100 for the first time in 2009 as a member of the Orioles, at 104. He, to this point, has a career 85 wRC+ and has been worth -0.9 WAR. If you are a follower of one of the above-mentioned teams, you may remember Jake Fox. If not, you shouldn’t. That is, you shouldn’t unless you are hiding a dirty little secret. The secret being that you have been paying attention to Spring Training stats. Because Jake Fox would rake in Spring Training. Like, pretty much every year. Observe:
When the Rangers signed then-16-year-old Dominican Ronald Guzman in July 2011 for a whopping $3.45 million bonus, the 6’5″ hulk was said to profile as a corner outfielder with a big bat–the best offensive asset in the 2011 international amateur class. Over two years later, he remains a promising hitter–he hit .321/.374/.434 as a 17-year-old in the Rookie-level Arizona League and followed it up by posting a .272/.325/.387 line as an 18-year-old in Low-A this past campaign. He’s only gotten into 101 games due to a few injuries, but so far, Guzman’s offensive development is going about as well as the Texas front office probably hoped for. The other part of his profile, though, has changed.
Guzman was moved to first base almost immediately after signing. He has played in the outfield exactly once as a professional, back in 2012 for five innings to make room at first base for a then-rehabbing Mike Bianucci. To be fair, Guzman has played on teams that have featured notable outfield prospects like Nick Williams, Lewis Brinson, and Nomar Mazara, but his mooring to the game’s easiest defensive position at a young age owes far more to his lack of ability in the field than it does to his teammates. Guzman’s arm was widely panned as an amateur, he has a massive, sloping frame that doesn’t look built for speed (and will likely be even less so as he fills out), and he has a very odd gait that looks like he’s jogging on eggshells. Add it all up, and Guzman is, as WFAA’s Kate Morrison put it, “a first base prospect, not an outfielder/first baseman…but an honest-to-goodness stuck-at-first guy.”
In this post, I’m going to talk about the damnation of that designation.
A little over a month ago, I wrote this piece, examining how minor league catchers cut down on their passed ball rates over time. Indeed, anyone who peruses Baseball-Reference minor league catcher pages probably notices the tendency for teenage backstops to let pitches by them at alarming rates, only to ultimately settle into a more acceptable range as they reach their mid-twenties. On at least an anecdotal level, one can observe a similar phenomenon with left-side infielders–third base and shortstop are the most error-prone positions, and these tendencies can be blown up by inexperience. The worst qualified fielding percentage by an MLB shortstop in 2013 was Jed Lowrie‘s .962, and the worst from a qualified third baseman was Pablo Sandoval’s .940, but in, say, the Low-A South Atlantic League, ten of the fourteen third basemen who got over fifty games at the spot fell below that .940 fielding mark, and twelve of the fifteen shortstops didn’t break .962. And the short-season levels are a level of magnitude worse than that.
As with catchers, then, we can assume that left-side infielders cut down on their error totals significantly as time goes on. In this piece, I’m going to examine the development of shortstops in this area.
Now kids, I’m not a user of the Twitter, but I did follow a link to it in one of Eno’s articles last week, whereupon I came across an interesting question posed in a tweet by one @b_g_h: “Are hitters with low BB% also more volatile [because] of BABIP variance?” There are different ways to address the question statistically, but it seemed to me that with an altered version of my pitching correlation tool, one could provide insight into issues like this, at least regarding pitchers. A hitting version is waiting in the wings, don’t worry. So, what I bring to you today is an interactive and downloadable spreadsheet that allows you not only to analyze the relationship between any two pitching statistics, but also to filter your data by any three statistics of your choosing. Read the rest of this entry »
Back in the old days, like WAY back in the old days, the running game was an integral part to baseball. I mean, look at the stolen base totals from the 19th century. Dudes were running wild. That was how the game was back then. Hitters didn’t (or couldn’t, more likely) rely on power nearly as much, and the pitchers threw a lot softer, making it easier on the potential thieves. Base stealing was incubated by the culture of baseball at the time. The way baseball is played now would seem entirely foreign to fans in the 1890s.
Since those high-flying days of the Grover Cleveland administration, aggression on the base paths died down. It saw its peaks and valleys, certainly, but swiping bags never quite reached that pinnacle of the early days of the game. The most recent influx of base-stealing came in the late 1970s through the 1980s. These were the times of Lou Brock and Vince Coleman and Rickey Henderson. And we applauded these speedsters. Running became a valued part of the game again. Though running saw a decline over the 90s as power came to prominence, it’s still a much speedier game than it was in those slow-poke days of the 60s. Read the rest of this entry »
At the end of the 1972 season, Steve Carlton was awarded the NL Cy Young award for his efforts with the Philadelphia Phillies. He certainly earned it. He posted a 12.1 WAR, a 22% strikeout rate, and an ERA- of 56. What many voters and fans were looking at, however, was his wins — 27, the most in the National League.
That number is impressive for a different reason to my father. Steve Carlton’s 27 wins in 1972 are important to my dad because it is included in one of his favorite baseball tales, a not-so-secret weapon for dads — Steve Carlton won 27 games in 1972, the same year the Phillies won all of 59. For those keeping score at home, that means that Steve Carlton was awarded a pitcher win in 46% of the games that the Phillies won all together.
This is more in the “fun fact” category than the “useful information” one, but it’s an eyebrow raiser nonetheless. Still, I needed to set the record straight and, during the 14th or 15th time my dad relayed his trivia nugget I, politely, mentioned that pitcher wins perhaps aren’t as important of a stat as we once thought. This led to a discussion involving all the usual stuff statistically-minded people mention when discussing wins. We sort of agreed to disagree, I guess, but something still stuck with me.