Archive for Residency

How Do Baseball Teams Discount the Future?

This is Matt Swartz’ fourth piece as part of his July residency at FanGraphs. A former contributor to FanGraphs and the Hardball Times — and current contributor to MLB Trade Rumors — Swartz also works as consultant to a Major League team. You can find him on Twitter here. Read the work of all our residents here.

The most distinct feature of my approach to calculating the cost per WAR on the free-agent market is my inclusion of the draft-pick-based costs to signing free agents, in addition the more obvious monetary costs. This requires a greater collection of assumptions than a simple focus on the dollars spent on free agency, but provides a more robust estimate of what teams give up when they dip into the free-agent market. It also requires a logical economic framework, including opportunity costs, so it also requires estimating the foregone costs of draft picks that a club could have received had they not re-signed their own players.

The gap between my actual estimates of the cost per WAR and the same calculation absent draft-pick compensation is not trivial. While it normally is only around 7%, it reached as high as 20% in 2015. Of course, with the new CBA lowering draft-pick compensation, this difference is likely to drop, making this part of the analysis somewhat less important. However, it remains essential to consider changes in draft-pick compensation to understand changes in cost per WAR over time. What may appear, in some years, like a collective decision by clubs to spend more aggressively in the free-agent market is frequently just a product of lower opportunity cost of foregone draft picks, leading teams to pump more dollars into free-agent contracts.

The biggest challenge when utilizing this framework is determining the appropriate discount rate to use. This isn’t easy to do and can easily vary from team to team and over time, as well. This article won’t pin down a perfect number; it’s almost certain that a better estimate of the discount rate requires a more detailed analysis of trades and other decisions that teams make when considering how to value player performance at different points in the future. It’s also challenging to use this approach to determine if the discount rate that teams use has changed, because it appears that the method of estimating said rate is noisy enough that it varies over time within a very large range. However, it’s worth understanding the approach.

In this article, I attempt to present that approach. Before I begin, one note: some of what follows is rather technical. I feel much of it is necessary, though, to establish the entirety of my methodology before moving on, in later posts, to actual illustrative cases.

The simpler part of using this analysis is looking at draft-pick bonus money saved. While this pales in comparison to lost WAR values from missing out on draft picks, a full picture does require netting out how much a team saves by not paying bonuses on those draft picks. I’ve performed a slightly more sophisticated nonlinear approach to estimate bonuses for this series than in my previous work, basically assuming that bonuses paid to draftees have the same exponential structure (relative to pick number) as the WAR they produce varies by pick number. I’ve also found better estimates of the specific slot values for draftees by pick, leading to a better estimate.

Of course, the larger issue is analyzing the picks themselves. While the average pick surrendered has been around roughly the 30th overall, this has varied significantly and has been higher (at times) in the past. It also will certainly be lower in the future due to the new CBA rules. To estimate the value of picks, I continue to use the Draft Pick WAR Calculator developed by Sky Andrecheck way back in 2009. While the precise outputs have possibly changed over time, they probably haven’t changed much, and Andrecheck’s model is certainly the best publicly available one.

In addition to this estimate of the WAR produced by players according to their draft pick, I’ve also found (in my own research) that prospects tend to debut roughly three years after being drafted. Therefore, a player’s WAR tends to accrue to the team who drafted him from three to nine years after said player is drafted, after which the player is a free agent. That’s roughly equivalent in value to all the WAR accruing exactly six years after the player is drafted, so that’s what I use in my estimate. I also had to net out the actual salaries through arbitration that successful draft picks will eventually receive, knocking down the net value of the WAR created by about 20%.

I decided to continue using a 10% discount rate (meaning that teams currently value the ability to obtain future WAR 10% less each year into the future). This is still my best guess about how teams are valuing draft picks. This means the team values the WAR 56% less than they would if it all came right away. And since they have to pay roughly 20% of market value due to arbitration in the latter years, they value the WAR 20% less than that.

In the three tables below, I’ve split the free-agent market data I have available into three time periods: 2006-09, 2010-13, and 2014-16. I’ve looked at all players who earned salaries at least $2 million in excess of the league minimum and compared the cost per WAR for those free agents with and without draft-pick compensation attached.

Read the rest of this entry »


The Linearity of Cost per Win

This is Matt Swartz’ third piece as part of his July residency at FanGraphs. A former contributor to FanGraphs and the Hardball Times — and current contributor to MLB Trade Rumors — Swartz also works as consultant to a Major League team. You can find him on Twitter here. Read the work of all our residents here.

In this series of articles, I analyze the average cost per WAR on the free-agent market, as well as looking back at previously discovered market inefficiencies to see how they have changed over time. However, in doing this analysis, it is important to ensure that any assumptions I make have theoretical and empirical backing, including perhaps the largest such assumption — namely, the linearity of the Cost per WAR on the free-agent market. Does a four-win player earn twice as much as a two-win one? Some analysts have argued that, due to scarcity, a 4-WAR player could earn more than twice as much, although I have shown in the past why I believe this is not likely. Today, I will confirm linearity is still a fair assumption to make.

First, it’s useful to discuss the economic implications in theory. The question of linearity comes down to how easy it is to replace a four-win player on the free-agent market, and if teams would be better off going after two 2-WAR players. If so, teams would drive up the price of 2-WAR players and drive down the price of 4-WAR players as they got smarter over time, until both methods of acquiring 4 WAR cost the same. However, perhaps teams cannot upgrade at any enough positions to enable this kind of arbitrage. As revealed by analysis I’ve performed in the past, there are, in practice, many different options a teams has. Nearly every team has a lineup spot, a rotation spot, and a couple of bullpen spots open in any given offseason. Many have more, and teams also have the option of conducting trades, as well, to make room for upgrades if so desired.

None of this says that some teams would never choose to take the approach of going after more 2-WAR players in lieu of going after big names. Individual teams are bound to have different assessments of replacement level both for their own team and the market in general. A team that felt that they had a high replacement level internally would be more inclined to go after big-name players and fill in the remaining spots with their internal high-replacement-level players. Alternatively, a team that felt replacement level was much lower than the market suggests would spread their spending across multiple players to avoid having to fill a vacancy with such a poor player.

As mentioned, my previous findings suggested that Dollars per WAR was linear. To see if this is still true, I split the market into three periods — 2006-09, 2010-13, and 2014-16 — and looked at the cost per WAR using my framework discussed in the previous article in different ranges of salaries (net of the league minimum). This does lead to some sample-size issues, but here is the relevant table:

Dollars per WAR, by Salary Range
Net AAV Range 2006-09 2010-13 2014-16
$0-2 million $3.3 $2.7 $26.5
$2-5 million $5.3 $5.7 $13.1
$5-10 million $5.9 $5.7 $7.5
$10-15 million $5.4 $7.6 $7.2
$15-20 million $5.6 $7.6 $11.6
$20+ million $4.9 $7.4 $10.3
Overall $5.4 $6.5 $9.0

And here’s that data rendered into visual form:

As you can see, the dollar amounts per win retain a general proximity to the overall averages for each time period. Early numbers did show some non-linearity in the very low-$ part of the market (under $2 million net AAV) but that was probably related to measurement error. Such deals are often one-year deals with sizable incentives that are poorly reported. They also overwhelmingly go to players just above 0 WAR, and therefore are highly vulnerable to measurement error of WAR itself if replacement level isn’t measured correctly. A slightly higher approximation of replacement level could lead to a much higher $/WAR estimate in this range.

I probably was less likely to miss out on incentives in more recent deals when collecting data, and there is actually a large over-correction where $/WAR is very high in the lowest salary bucket for 2014-16. Overall, I think it is best to focus on deals more than $2 million above the league minimum. You will see that the above issue led me to focus only on deals in excess of the amount for much of the subsequent analyses.

But once we get past that first row, we can see strong evidence of linearity in all ranges. The most recent years (2014-16) do show a little bit higher cost per WAR in the high-salary ranges, but since they also do in the low-salary ranges, I suspect this is just noise, and I am comfortable using a linear framework to Dollars per WAR in subsequent articles. This jump in $/WAR at high-$ levels (in the last column) is probably also a function of the small sample sizes as well. There are just 80 and 74 player-seasons respectively in the top two salary groupings for 2014-16.

Any non-linearity in cost per WAR would severely complicate the analysis of the free-agent market. I would certainly welcome this complexity if it were warranted, but I think the evidence and theory both clearly point to linearity making far more sense.

In my next article, I will explain the calculation of draft-pick cost in the Dollars per WAR framework, and the importance of discount rate while doing so. Once that piece is finished, the framework will be defined clearly enough that we can begin looking at the evolution of market inefficiencies.


The Recent History of Free-Agent Pricing

This is Matt Swartz’ second piece as part of his July residency at FanGraphs. A former contributor to FanGraphs and the Hardball Times — and current contributor to MLB Trade Rumors — Swartz also works as consultant to a Major League team. You can find him on Twitter here. Read the work of all our residents here.

I first began estimating the average cost per WAR on the free-agent market after the 2009 season, but have not done so since my threepart series at the end of the 2013 season, leaving three extra seasons during which the market for free agents has evolved. In the first piece of my residency, I discussed the labor implications of using this framework. Many of my subsequent pieces in this series will look for which types of players are undervalued or overvalued by the free-agent market.

But first this piece will explain how I actually calculate average value — the reference point for whether players are undervalued or overvalued. It is also the appropriate reference point when considering the opportunity cost of any other number of baseball moves. For example, when a team is considering the value of acquiring a young player who will produce a large volume of team-controlled WAR, the reference point for valuing him is the cost of acquiring that amount of WAR on the free-agent market. This is an important concept for team construction.

Read the rest of this entry »


The Relationship Between Spending Efficiency and Labor Markets

This is Matt Swartz’ first piece as part of his July residency at FanGraphs. A former contributor to FanGraphs and the Hardball Times — and current contributor to MLB Trade Rumors — Swartz also works as consultant to a Major League team. You can find him on Twitter here. Read the work of all our residents here.

I’m excited to begin my FanGraphs Residency this month, during which I’ll present an updated analysis of the Dollars per WAR estimates that I’ve used for a long time. I’ve written about the Dollars per WAR framework for analyzing the free-agent market for nearly a decade now, most recently in a threepart series at Hardball Times using data through the 2013 season. In that collection of posts, I established the important definition of Dollars per WAR that I will use throughout this series of articles — namely, the average cost of acquiring one win above replacement on the free-agent market.

Since I’ve written about this, however, there has been a progressively minded, labor-sympathetic pushback against this framework that I felt it was important to address, because if the criticism were fair it would cast a long shadow across all of the analysis in the coming articles. Fortunately, I believe that this criticism is misguided, even if you accept the value system that proponents of this line of criticism generally espouse.

From my perspective, I will remain agnostic on the value system itself in these criticisms, but simply explain why I think this type of analysis does not line up with an anti-labor view at all. I will admit up front that I consult to a Major League team and therefore, when working for them, I do represent the interests of that employer. What I say in these articles, however, will represent only my own views — and, in general, I’m writing this from my perspective as a frequent contributor on this topic predating this good fortune, and as an economist — but neither as a team employee representing ownership nor as a former Department of Labor employee, either.

I’d like to address two well-written and well-argued articles here that I believe characterize some of the labor-related concerns. One by Mike Bates asks if statheads are pro-ownership and another by Michael Baumann reframes a series of team-friendly contracts as inherently bad and unfair. What I’d like to consider here is the implicit suggestion made by both authors that, when teams individually target lower cost-per-WAR players, that this doesn’t affect the prices of these lower cost-per-WAR players and drive them up, but rather that it serves only to drive down the price of higher cost-per-WAR players. This seems very unlikely to be true according to some of the increased prices for lower cost-per-WAR categories of players I find in later pieces in this series.

Read the rest of this entry »


Tampa Bay’s Second-Half Attendance

This is Michael Lortz’ fifth and final piece as part of his June residency at FanGraphs. Lortz covers the Tampa Bay baseball market for the appropriately named Tampa Bay Baseball Market and has previously published work in the Community pages, as well. You can find him on Twitter, as well. Read the work of all our residents here.

During my month here at FanGraphs, I’ve given an overview of the Rays’ attendance problems, detailed their need to attract millennials, compared them to other small-market teams, and discussed how their marketing strategy differs from local minor-league competition. Today, I want to end my time as June resident by talking about how baseball attendance in Tampa Bay will fare in the second half of 2017.

On June 24th, the Rays played their 41st game at Tropicana Field this year. Their average attendance at that point was 14,930. Of course, this is the lowest average attendance of any team in the Major Leagues, but it is also the Rays’ third-lowest midseason average attendance since 2007. Only in 2007 (when they were still the Devil Rays) and 2015 (the first post-Maddon year) was average attendance lower at the halfway point.

The following graph depicts Rays’ average attendance at Game 41 since 2007.

Read the rest of this entry »


What the Rays Can (and Can’t) Learn from Local Minor-League Attendance

This is Michael Lortz’ fourth piece as part of his June residency at FanGraphs. Lortz covers the Tampa Bay baseball market for the appropriately named Tampa Bay Baseball Market and has previously published work in the Community pages, as well. You can find him on Twitter, as well. Read the work of all our residents here.

There’s been a lot of circumstantial and empirical evidence showing winning baseball games has an effect on the amount of tickets purchased in subsequent games. In 2008, Michael Davis of the Department of Economics at the University of Missouri-Rolla (now Missouri S&T) concluded that team success leads to greater attendance. However, Davis’s study had a huge flaw. He limited his study to “only the ten major league baseball teams that have played in the same city for over 100 years. This list includes five National League teams: the Chicago Cubs, Cincinnati Reds, Philadelphia Phillies, Pittsburgh Pirates and St. Louis Cardinals; and five American League teams: the Boston Red Sox, Chicago White Sox, Cleveland Indians, Detroit Tigers and New York Yankees.”

For the sake of determining whether wins matter, that’s way too small of a sample size. Davis might have had enough data points, but his data points were not representative of the wide array of situations with which franchises must contend.

In 2012, Dan Lependorf wrote a post for The Hardball Times concerning the relationship between wins, attendance, and payroll. Whereas Davis went deep in time for a few teams, Lependorf analyzed every team from 2000 to 2011. Lependorf concluded that the relationship between wins and attendance produced an R-squared of .27. There was an even stronger correlation to attendance and wins the previous season (R-squared = .3). Attendance in a season featured an even stronger relationship to attendance level in the previous season (R-squared = .8).

Every sports team in every city will draw at least one fan. In Major League Baseball, we can also guarantee that every team will win at least one game. We can also guarantee a top level of attendance depending on the maximum capacity of the stadium. For the Rays, that would be 40,135 times 81 — or 3,250,935. And, of course, the most wins the Rays can have in the regular season is 162.

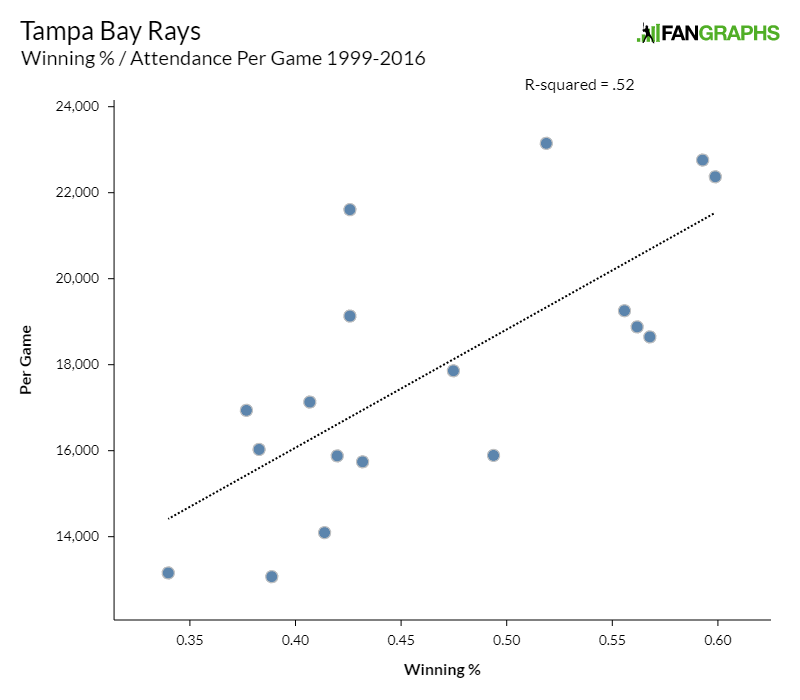
Since 1999 (excluding their inaugural season), the Rays have averaged 1.4 million fans and 75 wins per season. They’ve had eight seasons over 75 wins and nine seasons over 1.4 million fans. Since 1999, the correlation between the Rays’ winning percentage and attendance per game produces an R-squared value of .52.

That is almost double the correlation Davis found for teams. So despite the claims that wins don’t matter to attendance in Tampa Bay, they do. To a point.

Read the rest of this entry »


Can the Rays Ever Achieve League-Average Attendance?

This is Michael Lortz’ third piece as part of his June residency at FanGraphs. Lortz covers the Tampa Bay baseball market for the appropriately named Tampa Bay Baseball Market and has previously published work in the Community pages, as well. You can find him on Twitter, as well. Read the work of all our residents here.

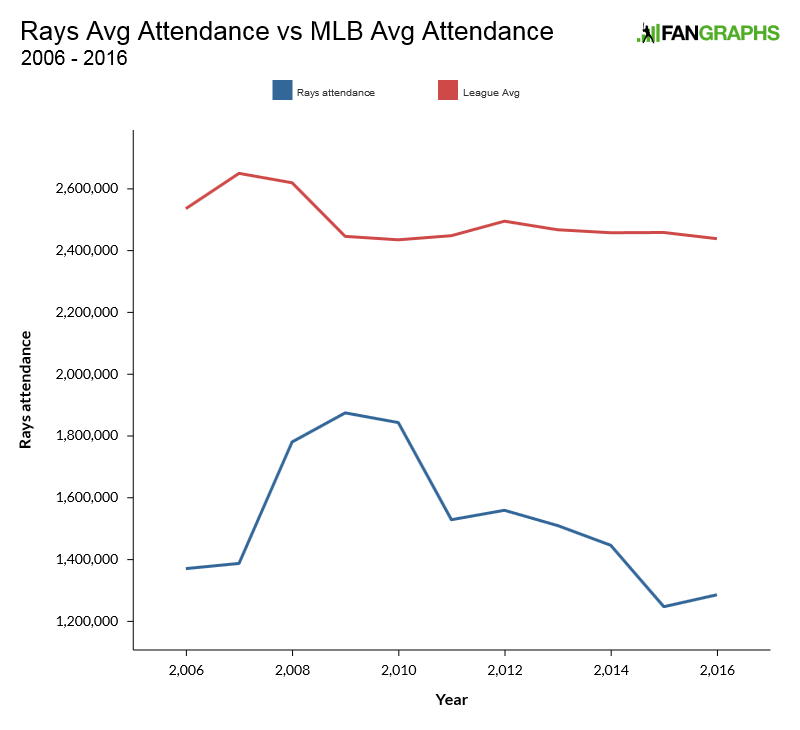
In my recent interview with Rays President Brian Auld, he stated that a goal of the Rays’ front office was to reach a league-average annual attendance mark. Last year, MLB average attendance was approximately 2.4 million per club. Rays attendance was 47% below that mar. Since Stu Sternberg bought the team in 2005, the Rays have never been close to league average. The closest they’ve been is 23% below in 2009.

Here’s the Rays’ attendance compared to league average since 2006:

And the following table illustrates how far the Rays have been from league average since Sternberg bought the team.

Rays Attendance as Percent of League Average
Year % of MLB Average
2006 54%
2007 52%
2008 68%
2009 77%
2010 76%
2011 62%
2012 63%
2013 61%
2014 59%
2015 51%
2016 53%

That’s obviously not encouraging. On the other hand, does it make sence for the Rays to set even the modest goal of “average” in a universe that includes major markets such as Chicago, Los Angeles, and New York? Since 2006, the Dodgers and Yankees, for example, have never been lower than 20% above league average in annual attendance and have been as high as 64% above average. The biggest markets in Major League Baseball skew the average for less populated areas such as Tampa Bay. Those teams would have to severely struggle over an extended amount of time to be anywhere near league average.

Read the rest of this entry »


Tampa Bay and the Millennial Challenge

This is Michael Lortz’ second piece as part of his June residency at FanGraphs. Lortz covers the Tampa Bay baseball market for the appropriately named Tampa Bay Baseball Market and has previously published work in the Community pages, as well. You can find him on Twitter, as well. Read the work of all our residents here.

According to the old stereotype, Florida is an elephant graveyard where everyone’s retired grandparents go to spend their final years. They drive slow, play bingo on Wednesdays, and clog the roads on the way to their early-bird specials.

The reality, as is frequently the case, is much more complicated.

As I mentioned in my first article, Tampa Bay is a growing region. Not only economically, but also in population. Earlier this year, the Tampa Bay Business Journal reported that the region of Tampa-St Petersburg-Clearwater is expected to top 3 million people by the end of 2017. According to the US census, approximately 330,000 people in Tampa Bay are over 65, or 11% of the population. A significant portion, but far from the majority.

There’s plenty of room for Millennials in these seats. (Photo: Walter)

Transplants are a large segment of the Tampa Bay population. In 2014, the New York Times published an article depicting where the population of each state came from. According to the Times, only 36% of Florida residents were natives, 8% were from New York, and 8% were from other Northeast states. We can probably safely assume many of the urban parts of Florida have a higher percentage of non-native Floridians. Which means Tampa Bay may have a higher percentage of transplants than other parts of Florida.

Read the rest of this entry »


Tampa Bay’s Attendance Problem

This is Michael Lortz’ first piece as part of his June residency at FanGraphs. Lortz covers the Tampa Bay baseball market for the appropriately named Tampa Bay Baseball Market and has previously published work in the Community pages, as well. You can find him on Twitter, as well.

By most accounts, Tampa Bay is a growing region. There is job growth, revenue growth, housing growth, and billions in development happening throughout both Tampa and St. Petersburg. But one number that is not growing, despite an increase in expendable income, is attendance at Tropicana Field.

Fortunately, the main reasons why the Rays continue to struggle at the gate have become somewhat well known. Most knowledgeable Tampa Bay residents and baseball fans know Tropicana Field is too far from the population center and the gridlock too tangled for enough fans to see the Rays on a daily basis. This media appears to have become aware of these particular challenges: we’ve seen fewer national editorials of late blaming the Rays’ fanbase for lack of attendance. There’s still the occasional tweet, but published commentary criticizing Tampa Bay sports fans for lack of Rays attendance is rare.

Regardless of how often the problem is covered, there aren’t many articles offering solutions. That is a problem. From the outsider’s perspective, it seems the Rays are running out of ideas to get people to the ballpark. While they can only put so much lipstick on the pig that is Tropicana Field, they’ve altered prices, involved their people in the community, and offered a smorgasbord of various promotions with varying results.

The lack of attendance is putting the Rays in a bind: without revenue from attendance and with lower-than-average broadcast revenue, they have to rely on revenue sharing to stay competitive in one of the more affluent divisions in baseball. And there’s skepticism from baseball owners and front-office personnel throughout the sport as to whether Tampa Bay can ever be a successful major-league market — despite the fact that four franchises spring train in Tampa Bay, two others train just over an hour away, and four minor-league teams call the region home.

At my website, I’ve covered Rays attendance since 2007, the last year the Rays had the Devil in their name. Over the history of the franchise (excluding the inaugural season), there have been four different eras of Rays attendance.

  • 1999-2007: The Phantom Ownership (avg 1.3 million)
  • 2008-2010: A New Fandom (avg 1.8 million)
  • 2011-2013: Indifference Strikes Back (avg 1.5 million)
  • 2014-Present: Return of the Empty Seats (avg 1.3 million)

As you can see, even with more recognition and more active ownership, the Rays now draw as many people to Tropicana Field as they did during the Dewon Brazelton years. That’s not a good thing.

Read the rest of this entry »


Where the Wild Things Are: Scenes from Life in the Independent Frontier League

This is Alex Stumpf’s seventh and final piece as part of his May residency at FanGraphs. Stumpf covers the Pirates and also Duquesne basketball for The Point of Pittsburgh. You can find him on Twitter, as well. Read the work of previous residents here.

March 24th, 2017

Zach Strecker sat alone in his Florida hotel room. He wasn’t ready to pack. He had a plane to catch and a Sweet 16 game to watch with his dad, but his mind was elsewhere.

After an offseason of preparation and work, the 23-year-old righty reliever thought he was going to be a part of the Twins organization for another year. He had turned a strong senior season with the University of Kentucky in 2016 to a contract as an undrafted free agent with Minnesota nine months earlier, thanks mostly to the testimonial of former coach Brad Bohannon. He even pitched well in Rookie ball, leading the Gulf Coast League Twins in saves.

But today, he heard the same dreaded words every low-level minor leaguer who is losing their job will hear: there just isn’t a spot for you.

It’s a brutal business. He knows that. He wasn’t even expecting to play professional baseball when he graduated from Kentucky. That’s why he has two degrees: one in accounting, the other in finance. He was going to give baseball a shot until there’s no future in it. The day might have come.

Thoughts started to run through his head. “Am I really leaving right now?” “Is this it?” “Am I really ready to go home and join the real world?”

It was the longest 30 to 40 minutes of his life. That was until he got a call from Tony Buccilli, the director of team operations with the Washington Wild Things. Their season was starting in seven weeks, and they were looking for relief pitchers.

“I gave it some thought, but there wasn’t much thought,” Strecker said. “I wanted to play ball, so let’s give it a shot. It’ll be fun.”

Read the rest of this entry »