Chris Sale is Sort of Back

There was a fair bit of consternation regarding Chris Sale at the start of the season. In his first start of the year, he gave up three homers in three innings against the Mariners. Concern mounted when his fastball averaged 89 mph against Oakland in his next start and he struck out just a single batter. The Red Sox told everyone not to worry because dialing back was part of a plan. Sale did nothing to help his cause with a lackluster start against the Blue Jays the next time out, but his fastball averaged over 95 mph against the Yankees in his fourth outing, and over Sale’s last six starts, he’s got 65 strikeouts against seven walks in 38 innings with a 1.92 FIP and a 2.61 ERA. He’s struck out 31 batters in his last two starts, including 17 Rockies in just seven innings on Tuesday. Chris Sale, ravager of batters is back, but his velocity is still down, so he’s adjusted how he attacks hitters.
The game against the Yankees could be looked at as the turning point in Sale’s season thus far — the results certainly back that point up — but that was more of an isolated incident when it comes to the velocity we’ve grown accustomed to the past few years. The graph below shows Sale’s fastball velocity in each start over the past few seasons as well as a band which shows the max velocity for Sale in any given start.
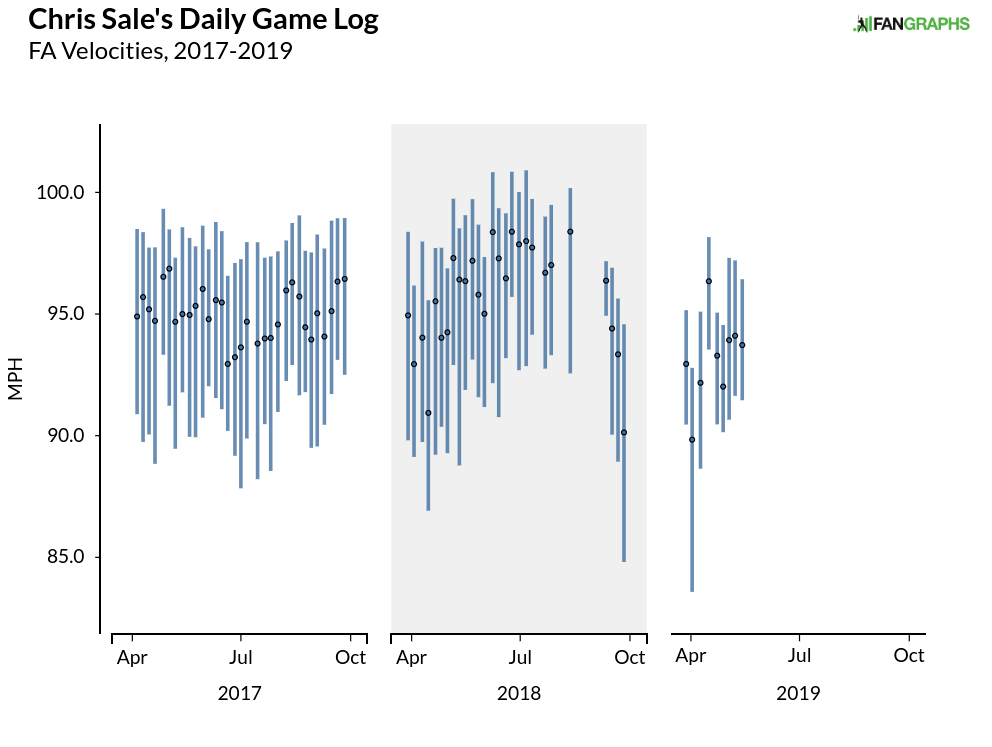
When the Red Sox indicated they had a plan for Sale at the beginning of the year amidst his struggles, pointing to 2018 was the biggest piece of evidence. Sale started the 2018 season with lower velocities and then ramped it up as the season wore on before Sale wore out. This season might require a slower, less inclined ramp to make sure that Sale is still pitching strongly at the end of the season. Where skepticism might remain is whether Sale can be anything close to his prior great self if he spends half the season at 92-93 mph instead of a few ticks higher. If the last few starts are any indication, Sale will be just fine.
To figure out where Sale is now, let’s figure out where he’s been. If the Yankees start wasn’t the turning point this season, then where is it? While breaking an already small sample size into even smaller chunks isn’t always advisable, there are three clearly different three-start periods for Sale this season. To get an idea of how far off Sale was at the beginning of the year, let’s compare those starts to Sale’s numbers in 2017 and 2018. First, just the basics.
| K% | BB% | ERA | FIP | |
|---|---|---|---|---|
| 2017-2018 | 37.1% | 5.3% | 2.56 | 2.25 |
| 3/28-4/9 | 13.1% | 6.6% | 9.00 | 7.26 |
Sale simply wasn’t striking anybody out and it hurt him. Let’s dig a bit deeper and look at his pitch usage.
| FA | FT | SL | CH | vFA | |
|---|---|---|---|---|---|
| 2017-2018 | 35.2% | 13.8% | 33.5% | 17.6% | 95.0 mph |
| 3/28-4/9 | 31.9% | 5.0% | 34.5% | 28.6% | 91.1 mph |
With Sale’s diminished velocity, he threw his four-seamer less while his two-seamer, which is slower, was nearly nonexistent. His slider he kept the same, but he replaced the missing fastballs with changeups. Worse, the fastballs he did throw weren’t in the strike zone. In 2017 and 2018, he threw fastballs in the zone around 55% of the time, but in his first three starts, that figure dipped below 40%. His plate discipline numbers suffered as a result, as seen below.
| Zone% | O-Swing% | Z Swing% | O-Contact% | Z Contact% | F-Strk% | SwStrk% | |
|---|---|---|---|---|---|---|---|
| 2017-2018 | 50.2% | 37.0% | 61.3% | 53.0% | 78.1% | 67.1% | 15.3% |
| 3/28-4/9 | 48.7% | 36.9% | 57.8% | 66.7% | 83.6% | 73.8% | 10.5% |
Sale was pitching in the zone more, but because his fastball was out of the zone, that meant his slider was in the zone more. It’s easier to make contact with fastballs out of the zone than sliders, so hitters made more contact and did more damage. That was the bad Sale. Over his next three starts, he made one significant adjustment and got better results. First, the results:
| K% | BB% | ERA | FIP | |
|---|---|---|---|---|
| 2017-2018 | 37.1% | 5.3% | 2.56 | 2.25 |
| 3/28-4/9 | 13.1% | 6.6% | 9.00 | 7.26 |
| 4/13-4/28 | 33.3% | 8.3% | 4.24 | 3.64 |
The strikeouts went back up to near-normal levels, but the walks are a little higher and the FIP and ERA are good, but not Sale-level. Sale’s pitch-mix underwent a pretty big change.
| FA | FT | SL | CH | vFA | |
|---|---|---|---|---|---|
| 2017-2018 | 35.2% | 13.8% | 33.5% | 17.6% | 95.0 mph |
| 3/28-4/9 | 31.9% | 5.0% | 34.5% | 28.6% | 91.1 mph |
| 4/13-4/28 | 32.6% | 4.0% | 48.8% | 13.6% | 93.3 mph |
The velocity increase is good, but all those fastballs that had been shifted to changeups were shifted again, this time to more sliders. Sale threw more of his fastballs in the zone, but he ended up getting hit hard on those pitches. All the sliders balanced out and Sale was reasonably successful, though Sale’s pounding the zone did come at some cost, as the plate discipline numbers show.
| Zone% | O-Swing% | Z Swing% | O-Contact% | Z Contact% | F-Strk% | SwStrk% | |
|---|---|---|---|---|---|---|---|
| 2017-2018 | 50.2% | 37.0% | 61.3% | 53.0% | 78.1% | 67.1% | 15.3% |
| 3/28-4/9 | 48.7% | 36.9% | 57.8% | 66.7% | 83.6% | 73.8% | 10.5% |
| 4/13-4/28 | 57.5% | 29.7% | 64.2% | 50.0% | 81.1% | 66.7% | 13.3% |
When hitters chased pitches, Sale was successful and getting whiffs, but batters swung less often at those pitches resulting in a lower whiff rate. We can see that Sale looks very much like his old self except for the zone percentage and chase percentage. He was able to change that over his last three starts and got great results, even if he was only facing the White Sox, Orioles, and Rockies.
| K% | BB% | ERA | FIP | |
|---|---|---|---|---|
| 2017-2018 | 37.1% | 5.3% | 2.56 | 2.25 |
| 3/28-4/9 | 13.1% | 6.6% | 9.00 | 7.26 |
| 4/13-4/28 | 33.3% | 8.3% | 4.24 | 3.64 |
| 5/3-5/14 | 54.0% | 1.3% | 1.29 | 0.54 |
These three starts are reminiscent of Sale’s incredible run last summer when he struck out 103 batters against 13 walks over 10 starts and gave up nine runs in all of June and July. While Sale was able to get by for a few starts throwing sliders half the time, it was maybe a sign of equilibrium that over Sale’s last three starts, his pitch mix looked like normal Sale.
| FA | FT | SL | CH | vFA | |
|---|---|---|---|---|---|
| 2017-2018 | 35.2% | 13.8% | 33.5% | 17.6% | 95.0 mph |
| 3/28-4/9 | 31.9% | 5.0% | 34.5% | 28.6% | 91.1 mph |
| 4/13-4/28 | 32.6% | 4.0% | 48.8% | 13.6% | 93.3 mph |
| 5/3-5/14 | 35.3% | 13.1% | 39.1% | 12.2% | 93.2 mph |
Other than a few more sliders than changeups, this is the pitch mix that made Sale so successful in his time with the Red Sox. The main difference was the lack of velocity with the fastball. The plate discipline numbers line up pretty well, too.
| Zone% | O-Swing% | Z Swing% | O-Contact% | Z Contact% | F-Strk% | SwStrk% | |
|---|---|---|---|---|---|---|---|
| 2017-2018 | 50.2% | 37.0% | 61.3% | 53.0% | 78.1% | 67.1% | 15.3% |
| 3/28-4/9 | 48.7% | 36.9% | 57.8% | 66.7% | 83.6% | 73.8% | 10.5% |
| 4/13-4/28 | 57.5% | 29.7% | 64.2% | 50.0% | 81.1% | 66.7% | 13.3% |
| 5/3-5/14 | 53.4% | 34.9% | 59.1% | 42.3% | 71.3% | 64.5% | 18.8% |
The changes are part conscious decisions and part the ability to execute. Sale’s slider was all over the place in the first three starts of the season, but the location has been much better as the season has gone on. There appears to be a deliberate difference when it comes to spotting his fastball. Compare Sale’s fastball locations over his three-start periods this season.

The first three starts, Sale is locating his fastball right where he has in year’s past, but either due to randomness or a lack of velocity, hitters were getting to the pitch. As a result, and partly due to the increased two-seamer usage, Sale began to throw the pitch lower in the zone. Against the Rockies, five of Sale’s strikeouts came on fastballs looking in the middle of the strike zone or lower, including this one to open the game against Charlie Blackmon.
He would do the same to Blackmon again in the sixth inning, this time dialing up a 96 mph four-seamer at the bottom of the zone.
We don’t know how long Chris Sale might hold up if he pitched above 95 mph every five days, but we know it didn’t work last year. We also know that a half dozen starts and lower velocities weren’t enough to keep his arm healthy in September, either. There was some question of just how effective Sale might be if he had to dial down the velocity for a long period of time, only occasionally reaching back for his old fastball. That question appears to have been answered with the last few starts. Sale is pitching pretty similarly to how he used to do except without the velocity. Sharp command and different placement of his fastball still made Chris Sale look like one of the best, if not the best, pitcher in baseball. We don’t know yet how he’s going to look in the fall, but the last three starts bode very well for the summer.
Craig Edwards can be found on twitter @craigjedwards.
Holy table overload