Corey Dickerson and the Best Bad-Ball Hitters

While writing about Miguel Sano last week, I connected two thoughts that had laid dormant next to each other for a while.
Those thoughts, as follows:
- It’s easier to lift and drive balls that appear in certain parts of the zone; and
- How pitchers approach batters in terms of location is part of an endless loop of adjustments that makes judging a batter’s true talent difficult.
That confluence of ideas led to an innocuous enough question: could we adjust exit velocity for pitch location?
The answer is yes, of course we can. The next question, however, was much more interesting: what the heck does this measure?
With Andrew Perpetua’s help, it was time to try and correct a player’s exit velocity for pitch location. My thinking at first was that pitchers generally try to avoid throwing down the middle, and if we’re looking at a player — like Sano early this season — who’s recorded an average exit velocity of 95 mph, maybe all he’s doing is capitalizing on mistakes. That would mean his exit velocity would return to earth once opposing pitchers stopped missing their spots.
So Perpetua grouped batted balls based upon how close they were in both location and pitch velocity. First he grouped balls that were very similar, within only one or two inches or one or two miles per hour. Then he grouped balls that were more different, within six inches or mph. All of the results were then combined and weighted based upon their similarity.
Once he had an expected outcome on each bin, he created a “league exit velocity” based on the pitch locations that a player had actually seen. With this having been established, we could then compare that expected league velocity to the league’s actual average to see which players have seen the most pitches down the middle that they should be banging.
Here are the players who appear on both ends of that list — or, in other words, the batters who saw the most and the fewest pitches in prime exit velocity locations. If you were going to laud Alex Avila’s 90.2 mph exit velocity, it might make sense to point out that the league-average exit velocity on the pitch locations he’s seen this year was 89.0 mph and not the 87.2 the league saw on all pitches as a whole. He’s added just over 1 mph of exit velocity over league average, as you can see in his “Delta EV” column.
| Name | BIP | Delta EV | EV | xlgEV | Avg. EV | Difference |
|---|---|---|---|---|---|---|
| Greg Garcia | 129 | -6.3 | 82.9 | 89.3 | 87.2 | 2.09 |
| Daniel Descalso | 182 | -1.3 | 87.8 | 89.1 | 87.2 | 1.91 |
| Alex Avila | 155 | 1.5 | 90.5 | 89.0 | 87.2 | 1.86 |
| Chris Herrmann | 124 | 1.2 | 90.0 | 88.9 | 87.2 | 1.69 |
| Jace Peterson | 95 | -1.8 | 87.0 | 88.8 | 87.2 | 1.62 |
| Derek Fisher | 56 | 1.3 | 90.1 | 88.8 | 87.2 | 1.61 |
| Gregor Blanco | 137 | -4.0 | 84.8 | 88.8 | 87.2 | 1.61 |
| Ryan Hanigan | 71 | -5.7 | 83.0 | 88.7 | 87.2 | 1.54 |
| Tony Wolters | 154 | -6.4 | 82.2 | 88.6 | 87.2 | 1.46 |
| Curtis Granderson | 245 | -1.6 | 87.0 | 88.6 | 87.2 | 1.43 |
| Kurt Suzuki | 149 | 1.0 | 86.8 | 85.8 | 87.2 | -1.34 |
| Brandon Phillips | 355 | -0.9 | 84.9 | 85.8 | 87.2 | -1.34 |
| Jose Martinez | 131 | 4.5 | 90.2 | 85.6 | 87.2 | -1.53 |
| Adonis Garcia | 131 | 2.0 | 87.6 | 85.6 | 87.2 | -1.59 |
| Hernan Perez | 295 | -0.6 | 84.9 | 85.6 | 87.2 | -1.60 |
| Juan Graterol | 54 | -4.5 | 81.1 | 85.5 | 87.2 | -1.63 |
| Giovanny Urshela | 53 | 0.5 | 85.9 | 85.4 | 87.2 | -1.72 |
| Adam Jones | 377 | 1.4 | 86.8 | 85.4 | 87.2 | -1.79 |
| Salvador Perez | 294 | 3.4 | 88.5 | 85.1 | 87.2 | -2.07 |
| Corey Dickerson | 345 | 1.8 | 86.7 | 84.9 | 87.2 | -2.22 |
As you can see, I’ve labeled that rightmost column just “Difference,” because I’m not sure what exactly it indicates.
At first, I thought it might be a measure of plate coverage. A player with consistently higher exit velocities than expected at each location would be exhibiting good plate coverage. Take a look at Adam Jones, for example, who has nearly average exit velocity despite hitting balls that have a low expected exit velocity. Here are his exit velocities compared to league average in each bin, with red being better than league average and blue being worse. This looks like good plate coverage, no?

But let’s look on the opposite end of the spectrum, to Alex Avila. I wouldn’t say this looks like “bad” plate coverage. He’s got warm spots all over the zone except up and in.

Looks like a completely different skill set at play here, that has little do with “plate coverage” or “luck” based on location of the pitch.
Let’s look at one last heat map. This should make it clear what we may have actually captured here. Corey Dickerson has the lowest league-average exit velocity based on the location of the balls he puts in play. He swings at bad balls, in other words.
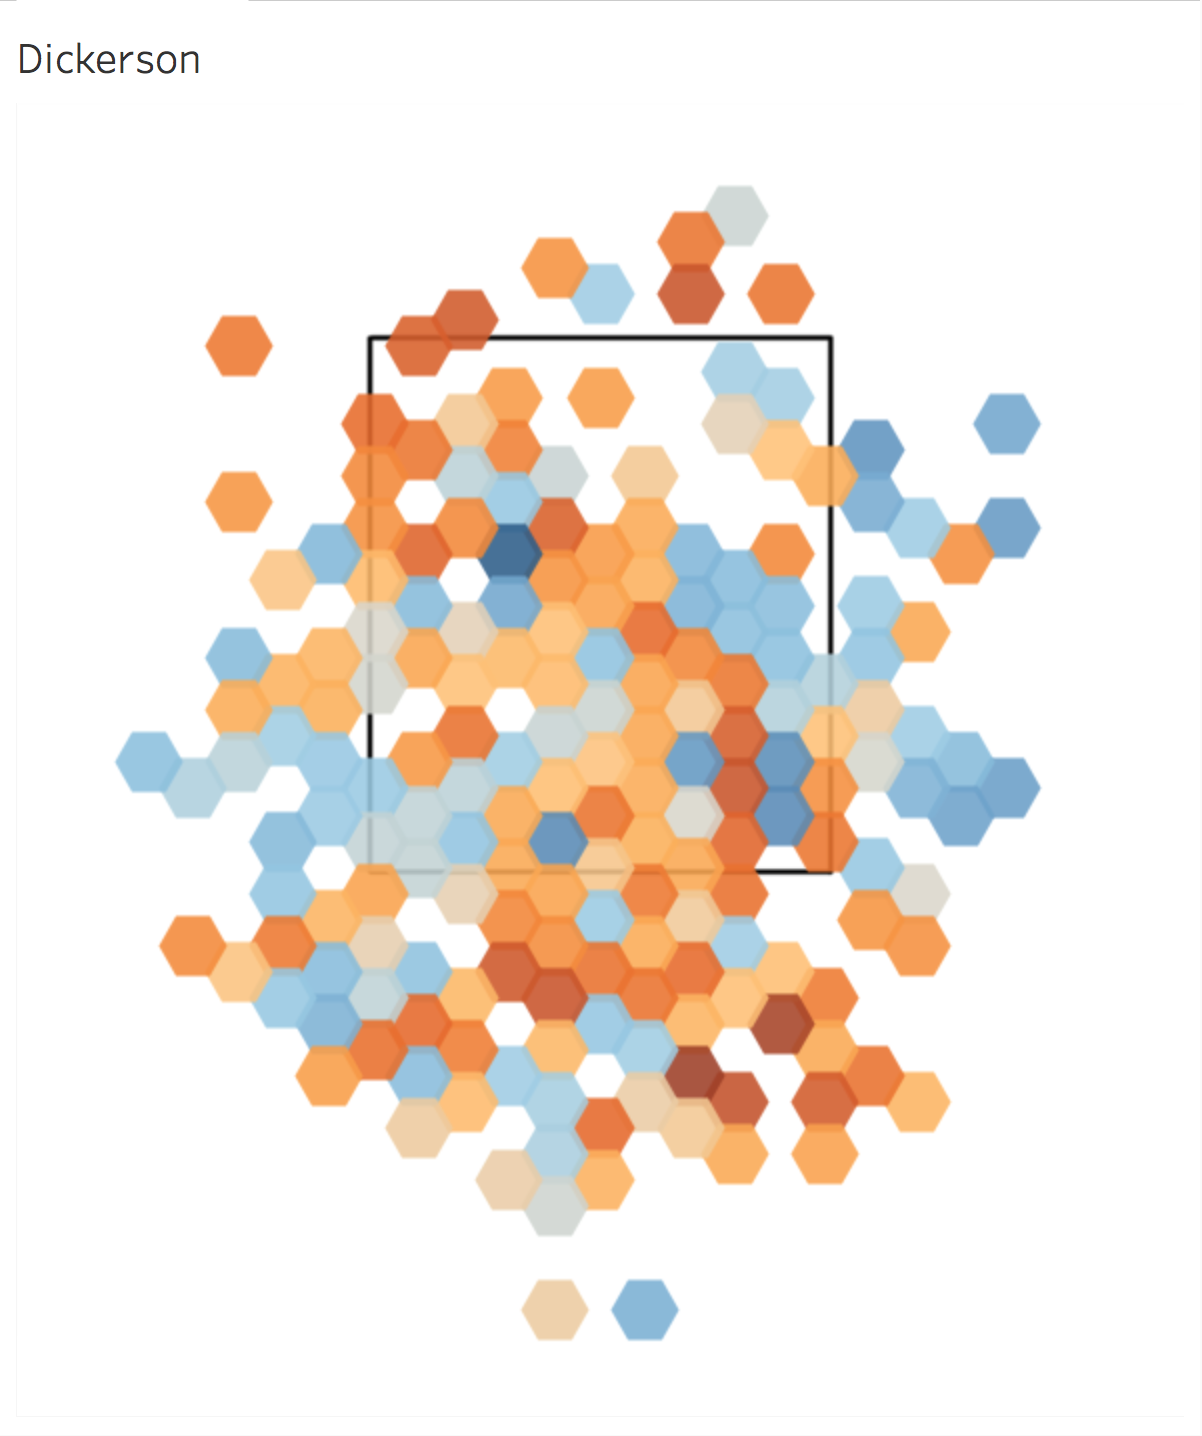
See what we’ve (maybe) captured? It’s a plate-discipline stat, expressed in exit-velocity outcomes. Dickerson is made to look better here because he manages nearly league-average exit velocity despite swinging at the worst balls in the majors when it comes to expected exit-velocity outcomes.
If you do this for the entire Statcast era, Salvador Perez, Corey Dickerson, and Pablo Sandoval rank third, second, and first, respectively, across the top of the leaderboards for the difference between their exit velocities and league-average exit velocities adjusted for pitch location. That’s your bad-ball leaderboard, really.
You go in looking for a way to adjust exit velocities for pitch location, and you end up with a plate-discipline stat that incorporates the ability to cover large swaths outside of the strike zone. You go in looking to remove luck from exit velocity, and you come out realizing, once again, that exit velocity is also a function of which pitches you swing at.
Here’s the full data set for the last three years and this year.
With a phone full of pictures of pitchers' fingers, strange beers, and his two toddler sons, Eno Sarris can be found at the ballpark or a brewery most days. Read him here, writing about the A's or Giants at The Athletic, or about beer at October. Follow him on Twitter @enosarris if you can handle the sandwiches and inanity.
Can you guys increase the granularity of the heat-map cells? Having a heat spot jump from warm to cold without any gradient paints a weird picture.
If anything, that shows the heat map is too granular. The jumps are due to small sample sizes in those baseball-sized cells.