FanGraphs Prep: Wins, Runs, and Pythagoras

This is the second in a series of baseball-themed lessons we’re calling FanGraphs Prep. In light of so many parents suddenly having their school-aged kids learning from home, we hope is that these units offer a thoughtfully designed, baseball-themed supplement to the school work your student might already be doing. The first unit, on constructing a team’s Hall of Fame, can be found here.
Overview: A one-week unit centered on the Pythagorean Theorem and Pythagorean Expectation.
The Pythagorean Theorem is a fundamental principle in geometry that describes the relationship between the three sides of a right triangle. In baseball, the Pythagorean Expectation describes the relationship between runs and wins.
Learning Objectives:
- Identify and apply the Pythagorean Theorem
- Identify and apply the Pythagorean Expectation
- Explain the relationship between runs and wins
- Evaluate various example problems and apply mathematical reasoning to solve them
Target Grade-Level: 9-10
Daily Activities:
Day 1
The Pythagorean Theorem describes the relationship between the three sides of a right triangle. When squares are formed on all three sides of the triangle, the Theorem states that the area of the largest triangle square (c) is the sum of the areas of the two smaller triangle squares (a and b).

This relationship can be put into an equation: a2 + b2 = c2, where c represents the length of the hypotenuse and a and b represent the length of the other two sides. For example, in a triangle with side lengths 3, 4, and, 5, our pythagorean equation would appear like this: 32 + 42 = 52 or 9 + 16 = 25. This relationship allows us to use algebra to solve a variety of geometric problems:
- You can use it to find the length of a missing side in a right triangle.
- You can use it to find the diagonal length of a square or rectangle.
- You can use it to determine if a triangle has a right angle.
Practice applying this theorem using these sample questions.
Additional resources:
- Khan Academy video introduction to the Pythagorean Theorem
- Math Is Fun introduction to the Pythagorean Theorem
Day 2
In much the same way the Pythagorean Theorem describes the relationship between the sides of a right triangle, the Pythagorean Expectation describes the relationship between runs and wins in baseball. A team’s winning percentage can be estimated by comparing the square of the team’s runs scored and the square of the team’s runs allowed. In other words, the ratio of wins to losses is directly related to the ratio of runs scored to runs allowed. The reason why this relationship uses Pythagoras’ name can be seen in this diagram:
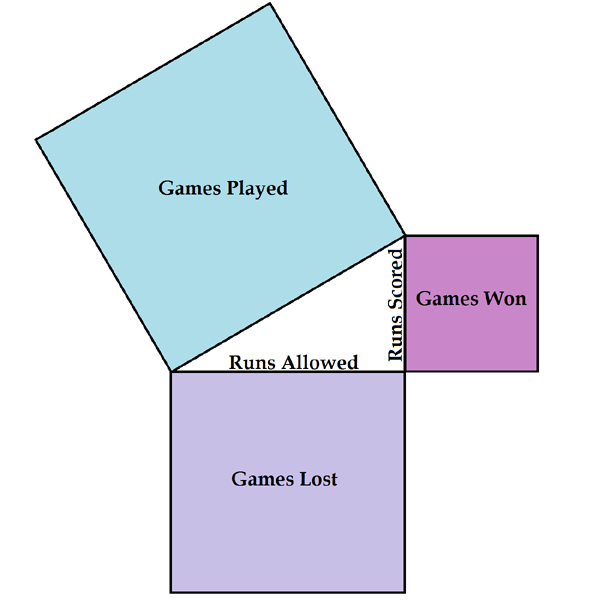
If the lengths of the two shorter sides represent runs scored and runs allowed, then the area of the squares represent the difference in wins to losses.
This relationship can be put into an equation: win% = runs scored2 / (runs scored2 + runs allowed2). For example, in 2019, the Washington Nationals scored 873 runs and allowed 724. Inputting those values into our equation (8732 / (8732 + 7242)) gives us an expected win% of .592 or an expected win-loss record of 96-66. That’s three games better than their actual win-loss record of 93-69!
Using the FanGraphs team leaderboards, find the number of runs scored and runs allowed for each team and determine their expected win-loss record in 2019. Which teams outperformed their expected win-loss record? Which teams underperformed? Why do you think teams outperform or underperform their expected win-loss record?
Additional resources:
- FanGraphs’ glossary entry on Pythagorean Win-Loss
Day 3
Now that a relationship between runs and wins is established, we can begin to see how it’s applied. It turns out, just about 10 additional runs scored or prevented is all it takes to win one additional game.
Check the math: suppose a team scored 800 runs and allowed 800 runs. Their expected win percentage would be 50%, or a 81-81 win-loss record. If we add 10 runs to their runs scored or subtract 10 runs from their runs allowed, their expected win percentage would be .506 or an 82-80 win-loss record.
Using what you’ve learned about the Pythagorean Expectation and the relationship between runs and wins, explain how a team could use this information to make decisions about which players to acquire.
Day 4
The idea that runs can be calculated for each play on the field, and in turn, for each player, underpins many modern baseball statistics. Based on years of historical data, we can say that a home run generally creates about 1.4 runs. Using the table below, we’ll estimate how many runs a player is projected to add to a team’s win total.
| Play | Run value |
|---|---|
| Single | 0.47 |
| Double | 0.76 |
| Triple | 1.06 |
| Home Run | 1.40 |
| Walk | 0.33 |
This offseason, the Los Angeles Angels signed Anthony Rendon to be their everyday third baseman in 2020. Last season, David Fletcher played third base for the Angels the majority of the time. Using the run values above, calculate how many more runs Rendon will add to the Angels total assuming he matches his production from last year. Remember to subtract the number of runs Fletcher produced in 2019 since Rendon is acting as a rough replacement in the coming season.
Using the RosterResource Offseason Tracker, find a few more examples and calculate the number of runs and wins a team added to their total by acquiring a particular player. Remember to find the player who is being replaced and subtract their run totals from the new player’s total.
Adaptations for a younger or older learners:
To increase complexity
- Skip the Pythagorean Theorem and get directly into the Pythagorean Expectation. If your student is already familiar with the geometry, you can just start with the baseball part of the unit.
- Add an exercise that introduces wOBA and wRC. Introducing wOBA is the next logical step after the relationship between runs and wins is established. The FanGraphs library contains a number of helpful articles explaining how and why using wOBA is foundational to understanding modern baseball statistics.
- Using both wOBA and wRC, calculating the number of runs a player is worth becomes much easier. Repeat the exercize from Day 4, but use wOBA and wRC instead.
To decrease complexity
- Spend more time learning about the Pythagorean Theorem. There are plenty of resources out there to help facilitate a deeper dive into this fundamental geometric principle, including several more from the Khan Academy.
- Preselect examples for the final activity. Instead of using the Offseason Tracker to find examples, provide some preselected examples for the student—either real-world or made up.
Jake Mailhot is a contributor to FanGraphs. A long-suffering Mariners fan, he also writes about them for Lookout Landing. Follow him on BlueSky @jakemailhot.
Love this series so much. Wonder if we can have all the kids bring questions for a live FG chat with writers or some kind of interactive sharing project at some point?