Fastballs Are Faster (and Rarer) Than Ever
The bottom of the eighth inning of last Wednesday’s Brewers-Angels game was, at first glance, fairly uneventful. Down 4-2, the Brewers called on converted starter Junior Guerra to keep the game in reach. He delivered — two strikeouts sandwiched a groundout, and the team went to the ninth down only two. Guerra is the fourth or fifth option out of the Brewers bullpen; he’s also a perfect embodiment of modern pitching. He threw 16 pitches in the inning, and less than half were heaters — six fastballs, four breaking balls, and six splitters. When he did throw fastballs, though, he put some mustard on them — two hit 96 on the gun, and he’s averaging about 95 mph so far this year.
These two trends — fewer and faster fastballs — are spreading like wildfire across the game. Sometimes it happens in jumps, like the Twins hiring a progressive pitching coach this offseason. Sometimes it happens organically, like Junior Guerra leaning on his splitter and slider a little more out of the bullpen. It’s a game-wide trend, though, and it seems likely to continue. This year, starters and relievers are both throwing their lowest share of fastballs since we’ve had pitch-level data. When they do throw fastballs, though, both groups are throwing them harder than ever before.
Without looking at a single piece of data, you could have convinced me that those two trends were likely true, but I wanted to look into the numbers to know for certain. First things first — we’ll need a consistent sample across years. Taking this year’s stats and comparing them to previous full-year averages won’t work, because pitchers consistently throw at lower velocities in March and April than they do in the year as a whole. In 2018, for example, March and April four-seamers were .2 mph slower than the year as a whole. Thus, we’re going to use data only through April 10th for every season to properly account for this systematic bias. Let’s take a look at that data, shall we? A quick methodological note: I’m excluding cut fastballs, as classification systems have real trouble differentiating them from sliders:
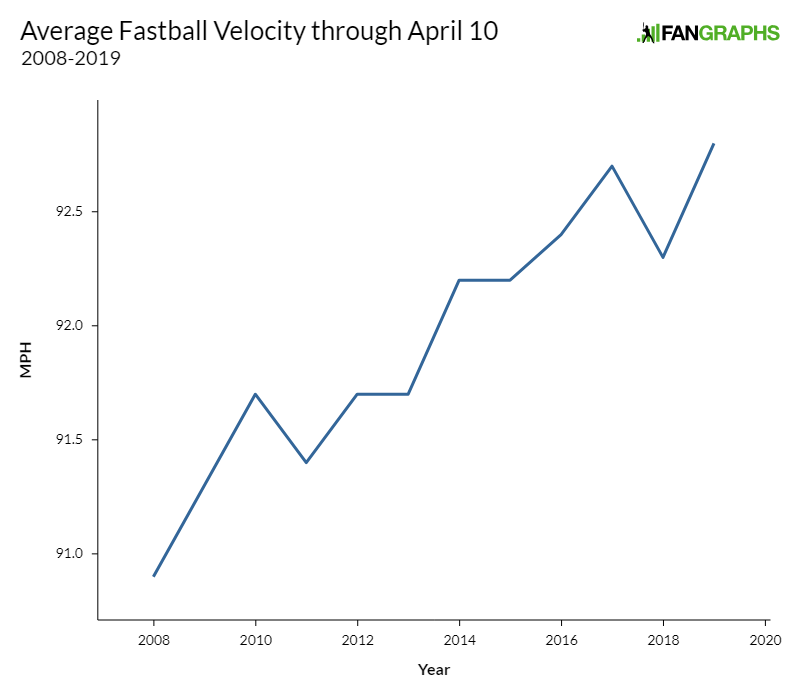
The data look relatively straightforward. It’s not a monotonic increase, but fastballs have been getting faster, and this year sports the fastest velocity on record. Ah, but wait, you might say. Relievers are pitching more innings than ever, and they throw harder than starters. Couldn’t that skew the sample? An excellent rejoinder, my friend. This year has seen the lowest percentage of pitches thrown by starters since 2008:
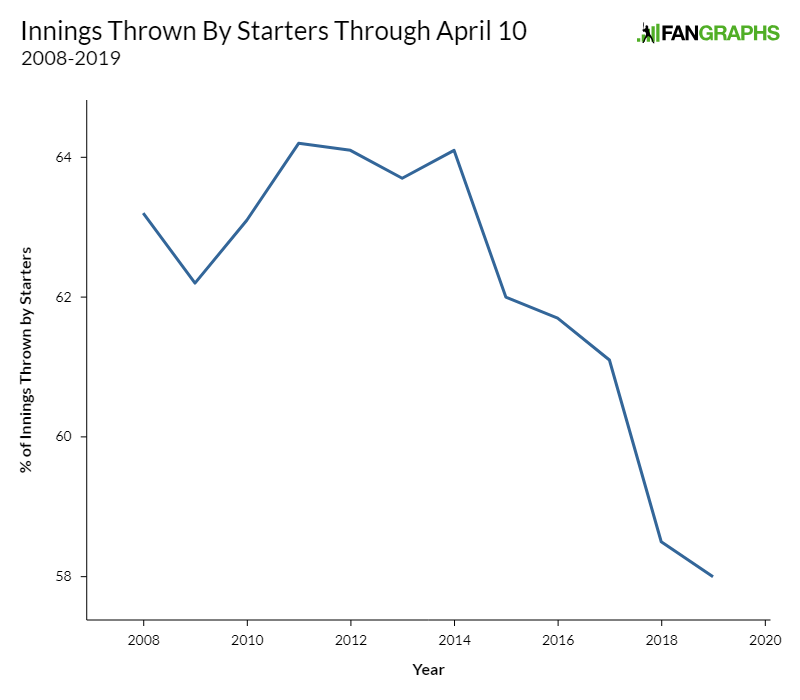
This pattern looks like the rough inverse of the average fastball velocity: generally declining, and at a low this year. To make sure the trend in fastballs isn’t simply caused by more relief innings, I split the data into two samples, starting pitcher fastball velocity and relief pitcher fastball velocity:
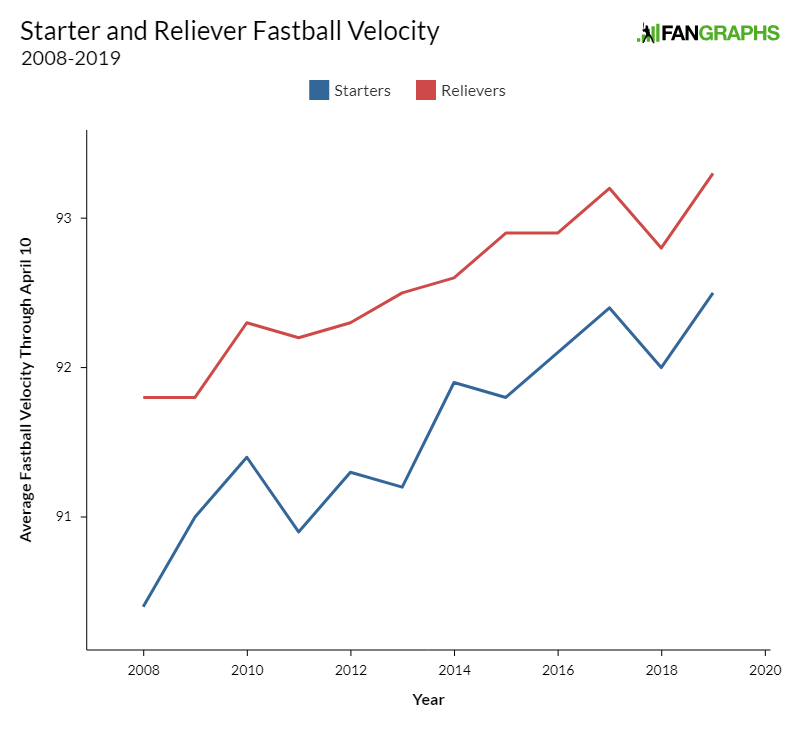
Well, what do you know? It looks like the trend is coming on both sides. Seeing it split out this way is instructive of how much baseball has changed in the last 10 years. 2008 and 2009 don’t feel that long ago, but the relief pitchers from those years threw slower than 2016-2019 starters. Want a more concrete example? Well, the top two starters in average fastball velocity in 2008 were Ubaldo Jimenez (96.1 mph) and Felix Hernandez (95.5 mph). This year, that would place them 10th and 14th among starters, and that’s with the 2019 pitchers experiencing the April velocity penalty. Let’s get really crazy — only three relievers in 2008 threw harder, on average, than Noah Syndergaard’s April 2019. It’s a jungle out there these days.
Okay, that trend was a gimme. Athletes are getting better at sports all the time; it’s no surprise that pitchers keep throwing harder. In addition, starters can throw with higher effort level on every pitch — as we saw above, they’re pitching fewer innings. As for relievers, teams aren’t making them throw longer outings — they’re simply using more pitchers per game, with the 13-man pitching staff becoming standard. In short, the trends towards faster fastballs makes broad sense. How about the trend towards fewer fastballs, though?
First things first — to keep the methodology constant, I tried using the same through-April-10th data that I did for velocities. This is more out of an abundance of caution than anything else — who’s to say whether pitchers change their pitch mix predictably from month to month? But if we have the sliced-up data, we might as well use it. Just as expected, both starters and relievers are throwing fewer fastballs than ever before, but the path to get there is significantly more confusing than it is for velocity:
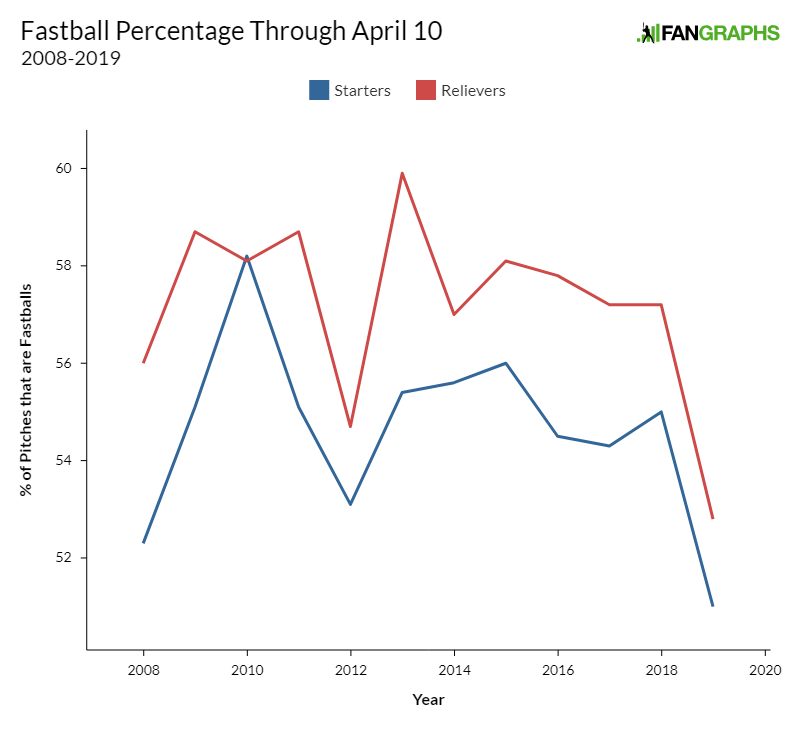
That’s a much less satisfying graph. 2019 is definitely the lowest, but somehow 2008 is the second-lowest! Maybe you can convince yourself of a trend, but the only thing I feel certain of is that we’re past peak fastball usage and heading lower. Still, though, I couldn’t shake the feeling that teams threw fewer fastballs last year than 2017 and certainly less than 2008, so I ran the full-season numbers. This is Bad Statistics, but it’s better than nothing. As you can see, this tracks with intuition much better:
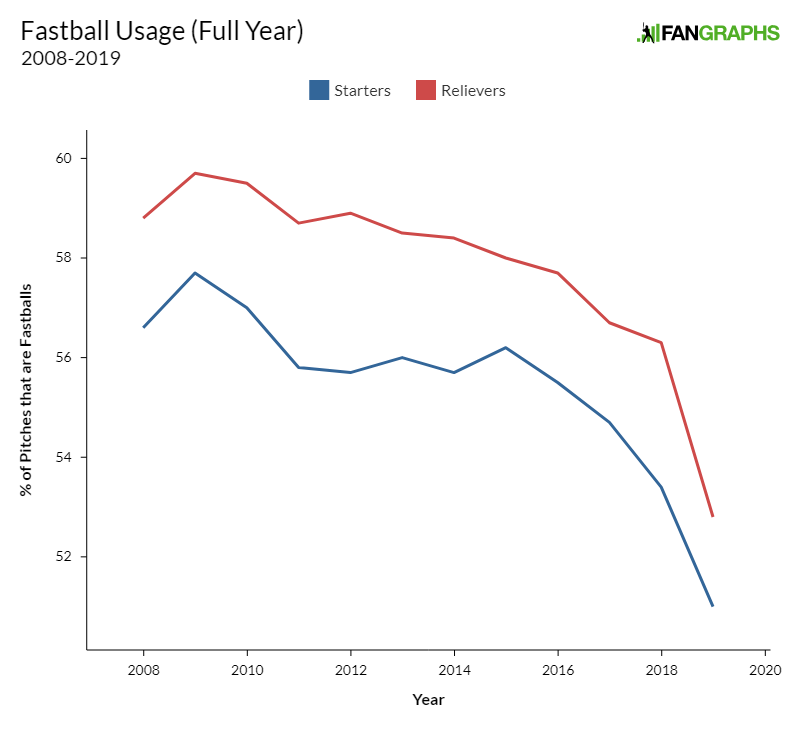
Gorgeous. In short, the full-season data shows what we’d expect. Teams are throwing fewer fastballs, and they’ve been cutting down on them increasingly quickly since 2015, when the home run surge started. This doesn’t have to be some grand, overarching plan across all thirty pitching coaches. To a large extent, it’s just self-preservation. Batters slugged .441 against fastballs in 2015 and .359 against everything else. When every little dinky fly ball starts turning into a home run, it’s only natural to start throwing a few more breaking pitches to put a little fear into the bats.
Even if the move away from fastballs started organically, though, it certainly looks like it’s becoming systematic now. Take a look at every team’s change in fastballs thrown from 2018 to 2019 — and remember that 2018 was already the lowest full-season fastball percentage on record:
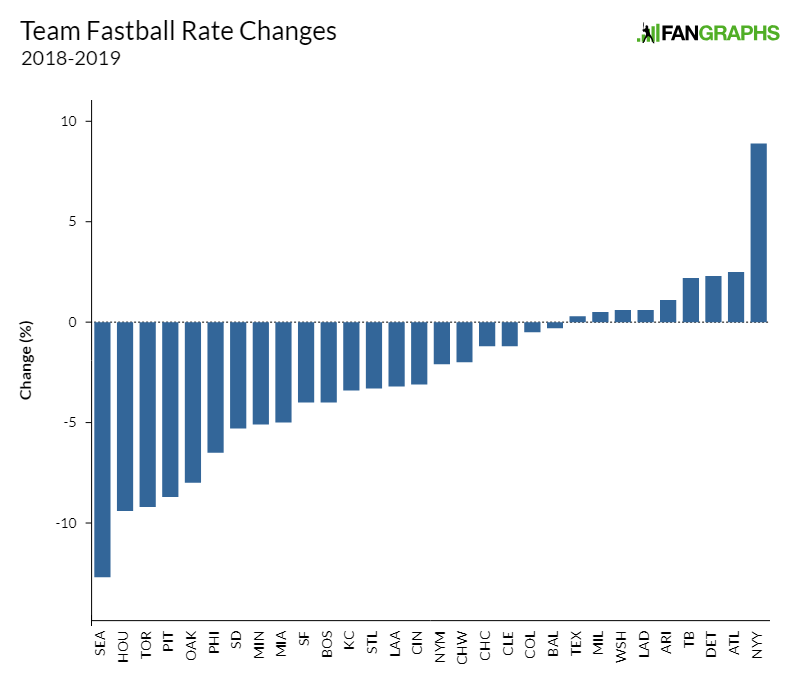
There are clearly still some sample-size jitters to work out at the team level, as some of these moves are enormous and probably unsustainable, but the overall trend is clear. Even as pitchers throw fewer and more explosive fastballs, however, batters continue to punish them. The average fastball is nearly one mph faster today than it was in 2015, and fastballs are thrown 5% less. Despite all that, however, batters have managed a .480 slugging percentage against them, against a measly .358 on everything else.
It’s always hard to extrapolate outside the bounds of existing data, but I feel safe saying that teams will continue to throw fewer fastballs in the months and years to come. There’s surely some equilibrium point where hitters can’t sit on fastballs anymore because there aren’t enough of them, but it seems that we haven’t reached that point yet. For now, it looks like we’re headed towards the 50% fastball mark, ever faster and ever less frequent.
Back in Anaheim, the Angels sent out Hansel Robles to lock down the game. Robles had been designated for assignment by the Mets last year — he’s the fifth option in the Angels bullpen. He got three outs in short order, using only 12 pitches to retire the side. In those 12 pitches, he went to his fastball five times, topping out at 97.5 mph. The new order of baseball rolled on.
Ben is a writer at FanGraphs. He can be found on Bluesky @benclemens.
Hader has singlehandedly put the Brewers over the threshold for fastballs thrown. Love it.
When the article opened on a Brewers anecdote I was just waiting for that to drop.
122 fastballs, 13 sliders, and 1 change.
For that matter, Freddy Peralta is also at 80% fastballs.
He was already up to 225 (to 10 changes, 45 curves) before last night’s game.