
Franmil Reyes Has Power Everywhere
Hitting the ball over the fence in San Diego can be difficult, though not quite as difficult as it used to be after the team changed the dimensions in 2013. Similarly, hitting the ball out of the park to center and the opposite field is generally a more difficult task for hitters. Around 60% of home runs this season are pulled by batters, while only 15% of dingers are hit to the opposite field. These difficulties have proved to be of little consequence for 23-year-old Franmil Reyes.
The young slugger’s statistics can leave you slightly underwhelmed when compared to his imposing figure and powerful bat. Reyes has a 120 wRC+, which is good but not great, and his defense in the outfield keeps his WAR at 0.8 on the season. Reyes doesn’t walk a ton, he strikes out a bit too much, and he doesn’t add anything on the basepaths, but he can do this:
Fourteen of Reyes’ 19 homers have gone out to center or the opposite field. That figure is the most in baseball and two clear of Christian Yelich and Peter Alonso, and includes five homers to the opposite field. Ten of those 14 homers have come in Petco Park, one of the more difficult stadiums for lefties to hit homers, and they have the advantage over Reyes in being able to pull the ball to right field. Trying to hit homers to the opposite field is generally not advisable, but for a man of Reyes’ size and power, it’s a worthwhile strategy. And when Reyes hits the ball in the air to center or the opposite field, he hits the ball harder than anyone in the game, per Baseball Savant:
| Player | Results | Avg Exit Velocity (mph) |
|---|---|---|
| Franmil Reyes | 63 | 97.4 |
| Javier Báez | 60 | 97.2 |
| Bryce Harper | 56 | 97.1 |
| Josh Bell | 66 | 97.0 |
| Yandy Diaz | 56 | 96.9 |
| Christian Yelich | 65 | 96.9 |
| Carlos Correa | 52 | 96.8 |
| Avisail Garcia | 62 | 96.2 |
| Christian Walker | 62 | 96.2 |
| Tommy Pham | 57 | 96.0 |
| Marcell Ozuna | 51 | 95.7 |
| Manny Machado | 55 | 95.6 |
| Buster Posey | 50 | 95.5 |
| Hunter Pence | 51 | 95.3 |
| Rafael Devers | 68 | 95.3 |
| Matt Chapman | 64 | 95.1 |
| Peter Alonso | 50 | 95.1 |
| J.D. Martinez | 70 | 94.9 |
| Jose Abreu | 66 | 94.8 |
| Brian Anderson | 68 | 94.8 |
It should come as no surprise then, that Reyes is one of the game’s leaders in wRC+ on balls hit to center or the opposite field:
| Name | Tm | PA | wRC+ |
|---|---|---|---|
| Javier Báez | CHC | 109 | 278 |
| Brandon Lowe | TBR | 75 | 238 |
| Christian Yelich | MIL | 107 | 236 |
| Josh Bell | PIT | 108 | 234 |
| Jorge Alfaro | MIA | 84 | 233 |
| David Dahl | COL | 95 | 230 |
| Avisail Garcia | TBR | 94 | 229 |
| Franmil Reyes | SDP | 94 | 229 |
| Joc Pederson | LAD | 72 | 226 |
| Bryan Reynolds | PIT | 74 | 220 |
| Luke Voit | NYY | 84 | 219 |
| Bryce Harper | PHI | 88 | 217 |
| Freddie Freeman | ATL | 120 | 216 |
| Willson Contreras | CHC | 76 | 215 |
| Clint Frazier | NYY | 73 | 214 |
| Tommy Pham | TBR | 105 | 210 |
| Peter Alonso | NYM | 85 | 207 |
| Carlos Correa | HOU | 84 | 206 |
| Austin Meadows | TBR | 85 | 205 |
| Anthony Rendon | WSN | 89 | 204 |
It’s not that Reyes doesn’t pull the ball. His spray chart from this season shows pulled homers and a whole lot of ground balls:
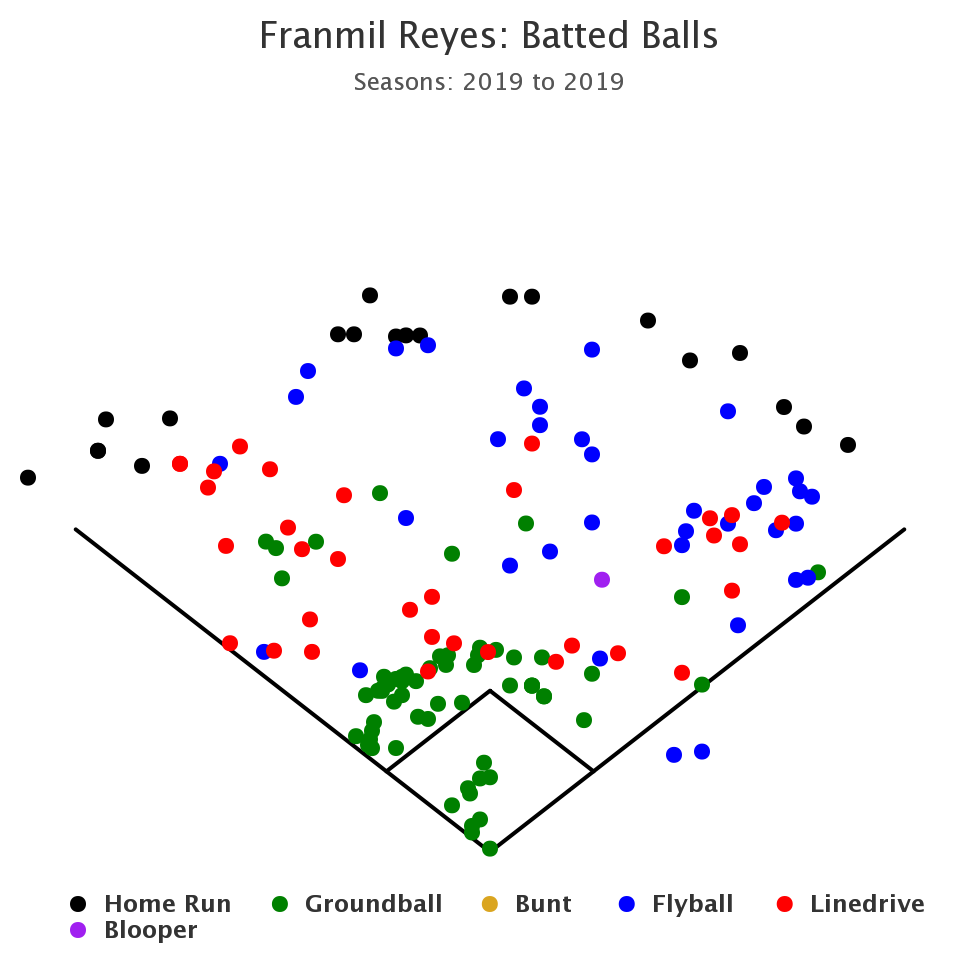
When we compare Reyes’ batted ball profile to last year’s, we might assume he’s pulling the ball less, but the number of balls he’s pulled has actually gone up over last season. When we split up groundballs and fly balls into the direction they are hit, we can see where Reyes has changed:
| Pulled GB% | Pulled FB% | Center GB% | Center FB% | Oppo GB% | Oppo FB% | |
|---|---|---|---|---|---|---|
| 2018 | 21.5% | 6.6% | 22.1% | 12.2% | 5.5% | 11.0% |
| 2019 | 21.6% | 5.4% | 15.5% | 15.5% | 2.7% | 15.6% |
When we look at the balls Reyes is pulling, we don’t see a difference from a year ago. Where he’s made changes is to balls to center and the opposite field. A year ago, groundballs up in the middle and to the opposite field made up around 28% of all his batted balls, while fly balls to the same locations accounted for 23% of batted balls. This season, grounders up the middle and to right are only 18% of his batted balls, while 31% are fly balls to center and right. He’s also hitting more line drives to left field. More fly balls to center and right plus more line drives to left have helped Reyes to his solid season thus far, though his overall hitting line is still below where he was last season.
In 2018, Reyes struggled for much of the year before turning it on in August and September. During the final two months of last season, Reyes hit .318/.385/.548 with a 155 wRC+. He took a walk 10% of the time and only struck out in 22% of his plate appearances. Reyes was hitting very well, but his line was supported by a .367 BABIP that wasn’t going to sustain itself, even if he did hit the ball hard. While Reyes ended the season with a 129 wRC+, Statcast’s xwOBA indicates Reyes might have been the benefit of some good luck as his .360 wOBA came with a .331 xwOBA, only slightly above average for a non-pitcher. This year, Reyes’ numbers have gone the opposite direction. While his .357 wOBA matches the results from last season, his xwOBA is .386, so Reyes might not be getting all of the benefits of his hard contact. In addition to those improvements, Reyes had pretty drastically changed his approach. His swing percentage on pitches out of the strike zone is similar to last season at a little over 30%, but his 15 percentage point jump on swings in the zone is the most dramatic leap in the game, as the graph below shows:
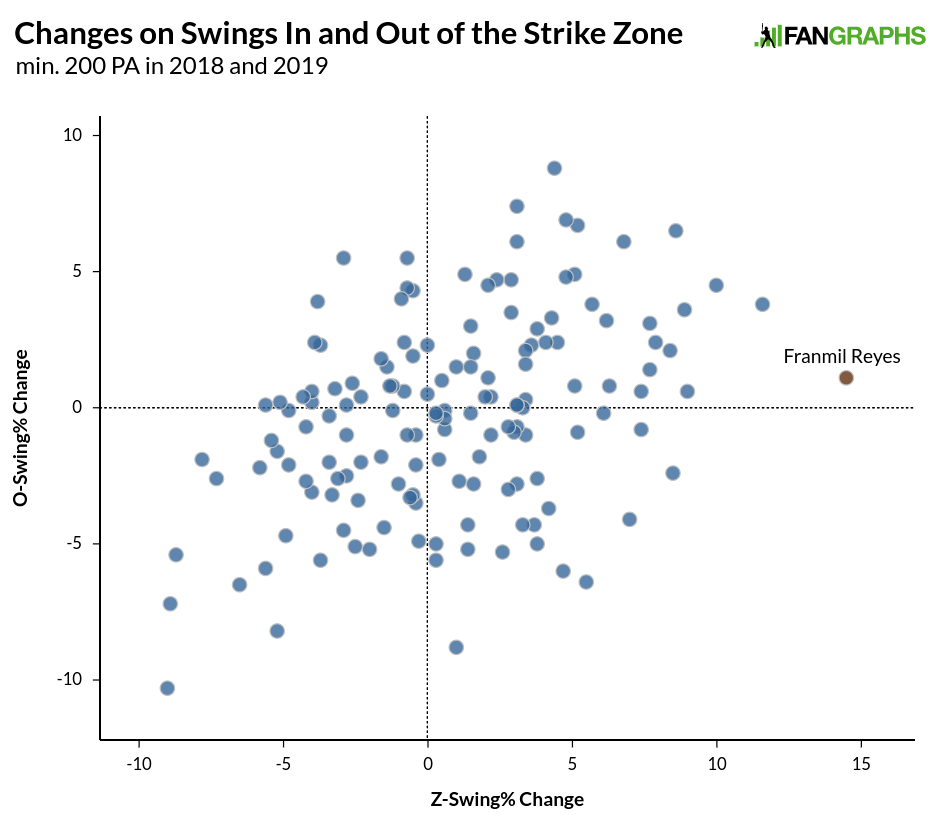
All those swings aren’t going to give him huge walk numbers, and he’s still going to strike out a fair amount, but swinging at strikes should allow him to get to his power, and no matter where he’s pitched, he’s hitting the ball hard and in the air when he makes contact. Reyes is putting himself in position to get to his power, which is his best attribute. In Reyes’ 500-plus career plate appearances, his lower-than-average walk totals combined with higher-than-average strikeout rates as well as prodigious power, a decent BABIP, and good overall numbers felt fairly unique. Using our +Stats section of the leaderboard, I looked for seasons since 1960 where a player was similar relative to the league, like Reyes has done so far. These were the players within 10 of Reyes in strikeouts, walks, ISO, BABIP, and wRC+:
| Season | Name | AGE | BB%+ | K%+ | ISO+ | BABIP+ | wRC+ | AVG DIST |
|---|---|---|---|---|---|---|---|---|
| 2012 | Corey Hart | 30 | 86 | 126 | 155 | 105 | 122 | 3.2 |
| 1969 | Bobby Murcer | 23 | 81 | 126 | 151 | 100 | 118 | 3.6 |
| 2012 | Alfonso Soriano | 36 | 87 | 130 | 155 | 100 | 117 | 3.8 |
| 1996 | Terry Steinbach | 34 | 90 | 129 | 153 | 94 | 117 | 4.2 |
| 1969 | Willie Horton | 26 | 93 | 126 | 157 | 98 | 118 | 4.4 |
| 1976 | Richie Zisk | 27 | 92 | 126 | 157 | 109 | 129 | 4.6 |
| 2003 | Andruw Jones | 26 | 89 | 118 | 145 | 98 | 118 | 4.8 |
| 1983 | Larry Parrish | 29 | 92 | 117 | 149 | 98 | 116 | 5.2 |
| 2018 | C.J. Cron | 28 | 80 | 119 | 144 | 100 | 122 | 5.4 |
| 2001 | Jose Cruz | 27 | 87 | 134 | 159 | 103 | 118 | 5.4 |
| 1995 | Jim Edmonds | 25 | 86 | 137 | 157 | 108 | 124 | 5.6 |
| 2003 | Preston Wilson | 28 | 91 | 130 | 157 | 104 | 111 | 5.8 |
| 2008 | Alfonso Soriano | 32 | 94 | 119 | 158 | 100 | 117 | 6 |
| 2010 | Corey Hart | 28 | 83 | 124 | 160 | 107 | 130 | 6 |
| 2010 | Alfonso Soriano | 34 | 93 | 122 | 158 | 98 | 114 | 6.2 |
| 1991 | Juan Gonzalez | 21 | 80 | 134 | 160 | 101 | 118 | 6.6 |
| 1976 | Amos Otis | 29 | 99 | 121 | 158 | 109 | 127 | 6.8 |
| 1999 | Eric Karros | 31 | 84 | 117 | 146 | 108 | 133 | 6.8 |
| 2011 | Nelson Cruz | 30 | 79 | 126 | 164 | 98 | 116 | 7.4 |
| 2018-2019 | Franmil Reyes | 23 | 89 | 127 | 150 | 101 | 125 | 0 |
What Reyes is doing now looks a lot like Alfonso Soriano’s Cubs’ years. Early in his career, his walk rates were considerably lower, which excluded those seasons from consideration. Only Murcer, Edmonds, and Gonzalez were 25 and under when they had their Reyes-like seasons. That’s a pretty good group to be comped with, though Murcer and Edmonds are both left-handed. Reyes has plenty of time to adjust and send his career on a higher trajectory. As he gets more dangerous, his walks are likely to rise, and he will have to continue working on his defense to be a more complete player. As for the homers, Greg Vaughn’s Padres record of 50 long balls in a season is probably safe, but it’s not entirely out of reach. Forty-two homers, which would put Reyes second on the Padres, seems very reachable, as he could join Phil Nevin, Ken Caminiti, and Adrian Gonzalez as the only Padres to hit at least 40 homers in a single campaign.
Craig Edwards can be found on twitter @craigjedwards.
23 years old and he’s averaging a homer every 12 PAs? And a 50% hard hit rate?
So, the guy has clear areas where he can improve and is already basically an average regular.
I still can’t believe he got passed over in the Rule 5 a few years ago.
At the time he was viewed as an incredibly raw kid with a body that limited his defensive abilities. He was also less than a month removed from surgery to address a broken hamate bone suffered in the Arizona Fall League. He healed very quickly and worked very hard that offseason to shed some pounds and improve his lower body flexibility and agility. Some mechanical tweaks to shorten his swing gave him a little more time to assess ball/strike and react to offspeed & breaking pitches. He put it all together in a remarkably fast time frame. He’s a smart guy and a very hard worker.
Tony Blengino on Petco Park (from “The Nuts And Bolts Of BIP-Based Park Factors”)
“Petco is the most misunderstood MLB park. Most still consider it to be a pitchers’ park, but the record disagrees. While it’s graded out as very hitter-friendly thus far in 2017 and in 2015 (116.9 overall park factor), it would be overly simplistic to deem it as strictly a hitters’ park. The marine layer is a huge factor in San Diego, and effects swing wildly from year to year.
In the air, you get pretty average results from 100-105 mph (56.9% homer rate), and there aren’t many cheap 90-95 mph homers to be had (1.1%). There is a sweet spot in between, however, with a 22.4% homer rate on 95-100 mph fly balls. There are some soft spots down both lines for homers to clear the fence.
More interesting is the inflationary effects the park routinely has on both liners (park factors of 116.5, 101.3 and 111.2 from 2015-17) and grounders (114.3, 123.3, 136.7). Balls scoot through the infield and the gaps here. Check out the 2015-17 line drive double (110, 113, 117) and triple (107, 129, 206) park factors.”
I’d like to point out that Franmil’s homers haven’t been coming in the “soft spots” down the lines, they’ve been mostly no-doubters that would clear any wall in the park. He has gotten a few wall-scraping line drives that look like they’ll hit the bottom of the wall but just never descend because he hits it so dang hard.
*Non-Pull Power Exit Velocity (2018-19)
Ohtani: 97.1 mph (116 BBE)
Reyes: 96.6 mph (124 BBE)
*Non-Pull wRC+ (2018-19)
Ohtani: 234 (199 PA)
Reyes: 229 (214 PA)
*Non-Pull xwOBA (2018-19)
1. Christian Yelich
2. Shohei Ohtani
3. J.D. Martinez
4. Joey Gallo
5. Khris Davis
–
–
–
–
–
–
–
11. Shin-Soo Choo
12. Franmil Reyes
I know it’s tangential to the main thrust of the article, but that scatterplot of change in O-Swing and Z-Swing is a thing of beauty. Such a simple way of identifying changes in approach / selectivity. Would love to know who some of the other outliers are!
The biggest total changes in a positive direction (Z-Swing change minus OSwing change) were Reyes, Miguel Rojas, Joc Pederson, Marwin Gonzalez, George Springer, Dansby Swanson, Cody Bellinger, Max Muncy, Christian Yelich, and Kris Bryant.
Biggest in a negative direction: Votto, Castellanos, Eduardo Escobar, Jose Iglesias, Joe Panik, Jonathan Lucroy, Javy Baez, Wilson Ramos, Starling Marte, Brian Anderson. Though I should note the positive ones ranged from 8 (Bryant) to 13.4 (Reyes) while the negative ones ranged from -8.4 (Votto) to -4.9 (Anderson) so the bigger swings occurred on the positive side.
So young and improving. Is Reyes’ ceiling Freddie Freeman with more pop? If so what are the odds he reaches that?
Its crazy to me how often Freeman gets tossed around as a comp. I don’t see any similarities in terms of the actual players. Freeman is a guy who went oppo with every ball in a HR derby and has a hit tool several grades above Reyes. From position, to handedness, to K rates to EV I don’t see any similarities. I put the likelihood at 0%. When I see Freeman tossed around as a comp I wonder if that person has ever seen Freeman hit – he is unique and I can’t think of a single player that is like him at all. In terms of OBP you are talking .300 v .400.
When you have 70-80 grade raw power, your ceiling is whatever your hit tool allows you to do. He’s not that far off of 2018 Giancarlo Stanton; 2017 Giancarlo Stanton is theoretically possible, although rather unlikely, since not even Giancarlo Stanton has done that more than once.
Not very likely unless he dramatically improves his plate discipline. Other than his initial cup of coffee in 2010, Freeman has never struck out more than 24.7% and has been under 21% in all but 2 years of his career. He also has only walked less than 10.3% of the time once and that was back in his rookie season. Freeman is also an extreme statistical outlier in his ability to hit an insanely high number of line drives on a consistent basis – 27.9% for his career with 3 separate seasons over 30%.
No, Reyes upside comp is clearly Stanton, and that’s the upside.
Reyes enjoys the best lineup protection in all of baseball for an unestablished player with mediocre on base skills. As disappointing as Manny Machado has been , he certainly forces the pitcher to give Reyes stuff to hit. I wonder if he could hit enough to hold a job if he hit in the bottom of the lineup. Everyone should be as lucky as Franmil.
Even if lineup protection matters that much (which the jury is very much out on), I’m pretty sure that Nomar Mazara is getting better “protection” from Joey Gallo. And Gregory Polanco is getting better “protection” from Josh Bell. And Dansby Swanson from Freddie Freeman. None of these guys get on base, and have much better hitters behind them. I have no idea why Franmil Reyes gets singled out over more established mediocrities, who certainly would benefit from the same thing at least as much as Reyes would.
great article, just curious how would one get the batted balls percentages table thats here in this article? is it just technical and difficult data manipulation or is it available on FanGraphs somewhere? I’m interested in looking into some of the other names listed in the prior tables
Manually combining batted ball data on the main player page and the directional splits in the batted ball section of a player’s splits page.
cool, thanks for the reply
He’s 23. Can you imagine how much we’d here about him if he played for the Yankees?
Hear would also work.
This kid is a virtual clone of Juan Gonzalez. Except for that whole “skill at driving in runs” thing 😉