What’s Up With Joey Votto?
On the heels of five straight losing seasons, the last four with at least 94 losses, the Reds are at least relevant and interesting again. Despite a 29-35 record entering Tuesday, their +33 run differential is the league’s fourth-best. Luis Castillo is showing signs of developing into an ace. Derek Dietrich is fighting off bees and retrograde broadcasters. Yasiel Puig is entertaining even when he’s not hitting, Michael Lorenzen sometimes plays the outfield when he’s not pitching, and top prospect Nick Senzel has arrived. And now, finally, Joey Votto is starting to heat up.
For the second season in a row, Votto has started slowly. On the heels of his 36-homer, 6.5-WAR 2017 season, a few frosty weeks to start 2018 (his age-34 season) could be easily dismissed, but the full-season lows Votto wound up setting in batting average (.284), slugging percentage (.419), wRC+ (131), home runs (12), and WAR (3.5) look considerably more ominous in light of his current line (.256/.347/.379, 5 HR, 93 wRC+, 0.2 WAR), which looks bad until you peep at his stats through May 10: .206/.333/.333 with three homers, an 80 wRC+, and -0.1 WAR.
As noted, the now-35-year-old Votto is showing signs of life. In his past 23 games and 106 PA, he’s batting .316/.377/.432 for a 115 wRC+, which isn’t exactly Votto-esque, but it’s a significant uptick within an offense managing just an 81 wRC+, the worst of any non-rebuilding team. Of his 15 multi-hit games this year, nine of them have taken place in that span, including all three of his three-hit games. This past weekend against the Phillies, he went 5-for-12 with a pair of walks, a homer — his first to the opposite field this year, off Zach Eflin — and a game-tying two-run single off Jose Alvarez in Sunday’s victory, Cincinnati’s only one of the three-game series. Here’s the homer:
As Votto noted after that shot, “I’ve been thinking my swing has been coming around since the beginning of May. I know I had some rough stretches, but it’s a very good sign. I haven’t done that yet this year.”
The signs that Votto has not been himself are manifest, and they go beyond the even-worse-than-last-year’s-career-worst slash stats and WAR. His swinging strike rate of 8.0%, while still good enough to place him in the 83rd percentile, is up two points from last year and would represent his highest rate since 2011. His 20.1% chase rate is his highest since 2016, which isn’t a big deal, but when he does swing at a pitch outside the zone, he usually connects; this year’s 64.8% contact rate on such pitches is down more than 13 points from last year and is his lowest mark since 2009. His 11.2% walk rate is down six points from last year and represents his lowest mark since 2008, while his 22.3% strikeout rate is a career high. Check out the progression of strikeout and walk rates relative to the league using our new “plus” stats:
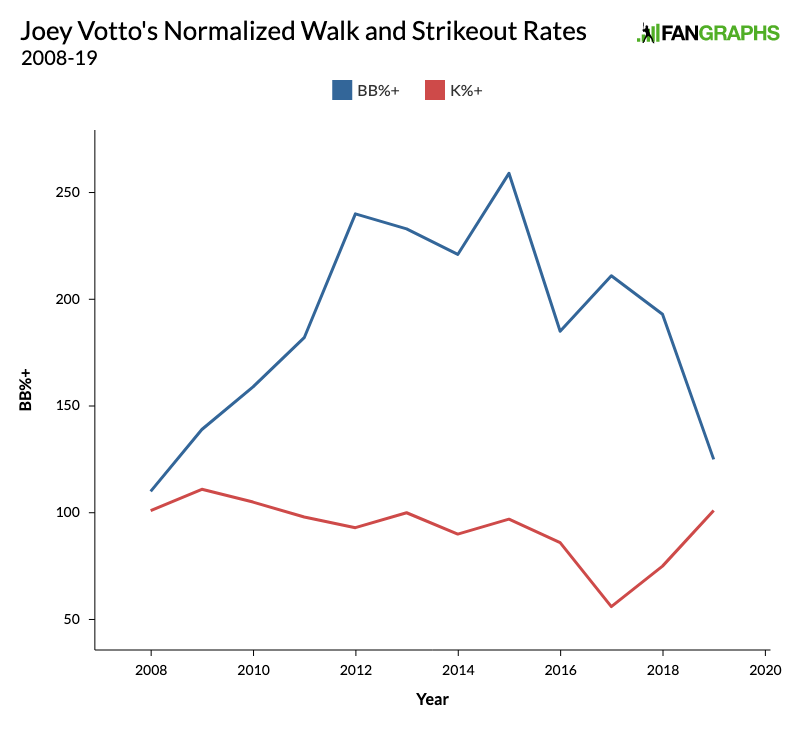
That graph, and the stroll through the stats in the paragraph above, are reminders that while Votto has been a legitimately great hitter since 2009 — when he hit for a 155 wRC+, his first of eight straight full seasons above 150 — it took a couple more years for him to begin carving up the strike zone with the efficiency we know and love. Still, it’s very weird and disorienting to see the decline.
As for his batted ball profile, everything is at one Statcast-era extreme or another:
| Year | GB/FB | GB% | FB% | Exit Velocity | Launch Angle | XWOBA |
|---|---|---|---|---|---|---|
| 2015 | 1.28 | 42.2% | 32.8% | 89.6 | 10.7 | .421 |
| 2016 | 1.45 | 43.0% | 29.7% | 89.6 | 11.6 | .404 |
| 2017 | 1.03 | 39.0% | 38.0% | 87.6 | 14.0 | .427 |
| 2018 | 1.21 | 37.5% | 31.1% | 88.1 | 13.3 | .395 |
| 2019 | 0.92 | 37.2% | 40.2% | 86.9 | 15.4 | .318 |
Votto’s current fly ball rate is his highest since his 2007 cup of coffee, up nine points from last year and about seven points ahead of his career norm. His ground-ball rate is his lowest since then, and his ratio is a career low, but like Corey Seager, hitting the ball in the air more often hasn’t been enough by itself to improve his performance. Check out his average fly ball distance according to Statcast:
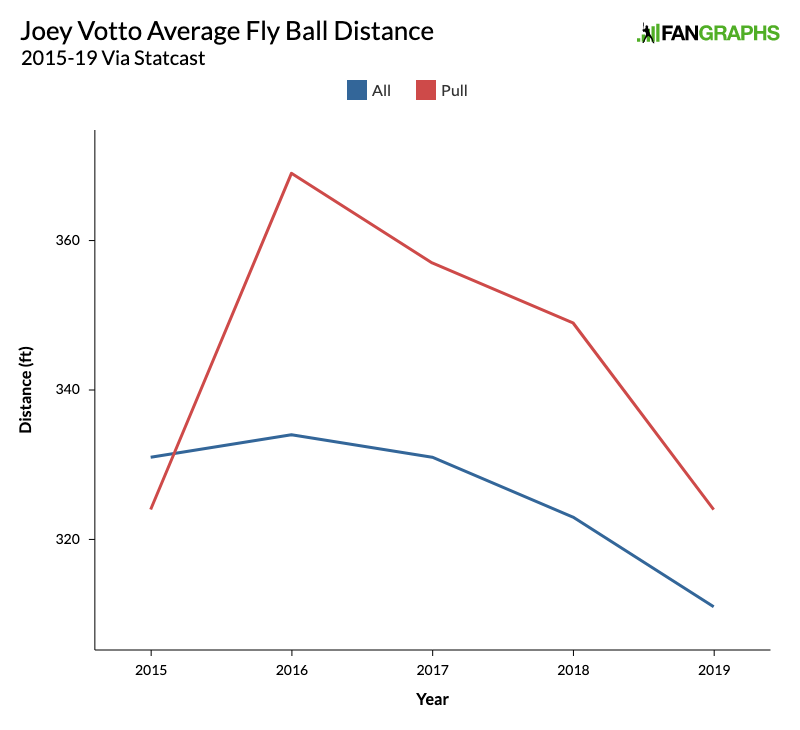
The scale on the Y axis is exaggerated, but whether we’re considering all of his fly balls or just the pulled ones, the effect of the fall-off on his slugging percentage is quite steep:
| Year | Dist All | SLG All | Pull% | Dist Pull | SLG Pull |
|---|---|---|---|---|---|
| 2015 | 331 | .950 | 15.7% | 324 | 1.200 |
| 2016 | 334 | 1.063 | 11.4% | 369 | 2.500 |
| 2017 | 331 | 1.065 | 15.8% | 357 | 2.565 |
| 2018 | 323 | .626 | 15.9% | 349 | 1.923 |
| 2019 | 311 | .589 | 13.6% | 324 | .571 |
Votto’s slugging percentage on all fly balls was in the 1.000 range from 2015-17, but he’s plummeted about 400 points since then. He’s pulling the ball in the air less frequently, and the drop in distance and slugging percentage on those balls is even more dramatic. Granted, we’re working with some small sample sizes at this end of the table, a maximum of 23 pulled fly balls in 2017, and a full-season minimum of eight in 2016. But where those eight produced 20 total bases that year, his seven pulled fly balls this year, which have traveled an average of 45 fewer feet, have produced just four total bases.
Contrary to what you might expect, Votto’s surge over the past month has not produced greater fly ball distances; using that May 10 date as a dividing line, he’s averaged just 300 feet on all fly balls since then, with a .571 slugging percentage, and has pulled just one of them. His rolling average exit velocity based on 50 batted balls is virtually unchanged (86.1 mph to 86.0) relative to that date, though if one uses his last 25 batted balls, it’s climbed from 85.0 mph to 88.9 mph. On the other hand, his rolling xwOBAs using either increment have fallen substantially since May 10, all of which is to say that I don’t think that particular date represents a true point of inflection when it comes to his performance.
Looking at Votto’s breakdowns by zone and by pitch, two other things stand out, albeit with the caveat that we’re dealing with even smaller sample sizes than the above, so it’s difficult to know how much weight to give them. First, he’s been pretty helpless against pitches in the upper third of the strike zone:
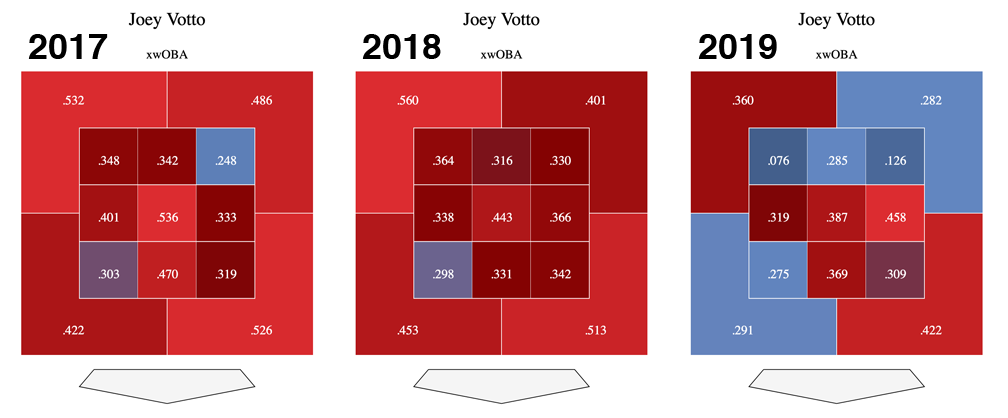
Brrrr, that’s frosty. According to Statcast, Votto had 34 hard-hit balls (exit velocities of 95 mph or higher) in that upper third in 2017. That total dropped to 20 last year, and 40% of the way through this season, it’s at five, a pace that would give him just 12 over a full season.
Second, Votto’s performance against all types of pitches except sinkers is down, but where it really stands out is against changeups. Via Pitch Info, in 2017 he hit .286/.304/.494 (115 wRC+) in 79 PA that ended with the changeup, and last year, he dipped to .260/.333/.380 (103 wRC+) in 57 PA. This year, he’s at .125/.200/.188 (15 wRC+) in 35 PA ending with the changeup. Meanwhile, his swinging strike rate on those pitches has risen from 8.4% to 9.7% to 14.7%, a much more dramatic spike than against other types of pitches. The league may be noticing, as the frequency with which he’s seeing the change has risen from 9.9% last year to 12.3% this year.
Taking all of this in, it’s a bit early to proclaim that Votto is out of the woods, and given his .276/.397/.407 (120 wRC+) performance in 874 PA since the start of the 2018 season, it’s difficult to believe that the guy capable of hitting .320 with 31 homers, 128 walks, and a 165 wRC+ — his averages from 2015-17 — is going to walk through that door. Maintaining a 120 wRC+ over his remaining four seasons under contract would still make for a useful, above-average player, but watching him decline further off his 2018-19 performance could be a grim spectacle.
This raises the question of what that could mean for his Hall of Fame case. From an advanced statistical perspective, Votto’s combination of good power, elite on-base skills (a career .309/.424/.524 line and 153 wRC+), and above-average defense (20.9 UZR, 49 DRS) has already produced 55.7 fWAR and 58.8 bWAR. Via the latter, he has already surpassed the seven-year peak standard of Hall first basemen (42.7) with a hefty 46.0 bWAR, good for 11th all-time, 0.5 below current candidate Todd Helton. His career WAR is eight wins below the Hall standard, and so his 52.4 JAWS is 2.4 points shy of the mark. He’s 17th in JAWS, ahead of just nine of the 21 enshrined first basemen, though if he maintains his hot streak, he should pass Hank Greenberg (52.6) in a matter of weeks. Maintaining his 2018-19 performance over the next 4.6 seasons extrapolates to another 12.6 WAR; even if it’s half that, his 55.0 JAWS would clear the current standard, though the election of Albert Pujols (80.9 JAWS, 0.5 below where it was entering 2017, ahem) will raise the bar a bit.
Sticking around for four more years would inevitably push Votto pass the 2,000-hit and 300-homer milestones (he’s at 1,785 and 274, respectively). His ZiPS projections through 2021 (including rest-of-season projections for this year) put him at 2,090 hits, 311 homers, and 65.9 bWAR. Padding that a bit to cover his final two seasons, let’s assume he gets to 2,300 hits, 325 homers, and 68.0 bWAR. At first glance, the counting stats don’t look like Hall of Fame numbers, but the advanced stats, and the widespread appreciation of the aforementioned elite on-base skills, should push him past.
Still, it’s worth contemplating what a prolonged and unspectacular denouement could mean. Via the Play Index, I identified 154 position players who accumulated at least 50 WAR through their age-34 seasons, then weeded out not-yet eligible players and those who gave voters a clear reason to vote for them or not, either by attaining major milestones (3,000 hits, 500 home runs), failing a PED test, getting banned for life, or dying of Lou Gehrig’s Disease. I also ruled out players whose primary position was catcher and those whose careers were shortened by the color line, since either of those has historically prevented any attainment of the aforementioned milestones. After a first run through those results, I also ruled out players who lost significant time to military service, since that distorted the low-end cutoffs, and those who fell short of 2,000 hits, a de facto cutoff for the post-1960 expansion era. All of that winnowed the field to 74 players, of whom 43 have been enshrined.
From there, I examined what that pool of 74 players did from age 35 onward, ruling out those who played fewer than 400 games over the remainder of their careers, an admittedly arbitrary cutoff but one that Votto’s highly incentivized to clear given four more seasons and about $120 million remaining on his contract ($25 million per year through 2023, plus a $7 million buyout for 2024). That trimmed the pool to 25 players, of which 17 have been elected, a manageable enough total to evaluate. Once I realized that seven of the eight outsiders hailed from the post-1960 expansion era (all except Bill Dahlen), I decided to consider only players from that period (could have saved myself a couple hours, sigh). That yielded a group of 15 comparables:
| Player | H/34 | HR/34 | WAR/34 | H/35+ | HR/35+ | WAR/35+ | H | HR | WAR | HOF |
|---|---|---|---|---|---|---|---|---|---|---|
| Joe Morgan | 1906 | 204 | 82.2 | 611 | 64 | 18.4 | 2517 | 268 | 100.6 | YES |
| Chipper Jones | 1944 | 357 | 60.3 | 782 | 111 | 24.9 | 2726 | 468 | 85.2 | YES |
| Brooks Robinson | 2259 | 234 | 65.2 | 589 | 34 | 13.2 | 2848 | 268 | 78.4 | YES |
| Ozzie Smith | 1668 | 18 | 57.1 | 792 | 10 | 19.8 | 2460 | 28 | 76.9 | YES |
| Barry Larkin | 1713 | 156 | 61.1 | 627 | 42 | 9.4 | 2340 | 198 | 70.4 | YES |
| Tim Raines | 2152 | 134 | 63.7 | 453 | 36 | 5.7 | 2605 | 170 | 69.4 | YES |
| Andre Dawson | 2037 | 319 | 59.2 | 737 | 119 | 5.6 | 2774 | 438 | 64.8 | YES |
| Billy Williams | 2231 | 356 | 58.0 | 480 | 70 | 5.8 | 2711 | 426 | 63.7 | YES |
| Lou Whitaker | 1962 | 190 | 62.3 | 407 | 54 | 12.8 | 2369 | 244 | 75.1 | NO |
| Larry Walker | 1702 | 309 | 57.1 | 458 | 74 | 15.6 | 2160 | 383 | 72.7 | NO |
| Kenny Lofton | 1642 | 92 | 52.8 | 786 | 38 | 15.5 | 2428 | 130 | 68.3 | NO |
| Graig Nettles | 1509 | 264 | 55.5 | 716 | 126 | 12.4 | 2225 | 390 | 68.0 | NO |
| Dwight Evans | 1785 | 291 | 54.5 | 661 | 94 | 12.6 | 2446 | 385 | 67.1 | NO |
| Todd Helton | 1957 | 310 | 55.7 | 562 | 59 | 5.5 | 2519 | 369 | 61.2 | NO |
| Bernie Williams | 1950 | 241 | 50.6 | 386 | 46 | -1.0 | 2336 | 287 | 49.6 | NO |
You can play with the table, as the columns are sortable. Using my rough estimate of 2,300 hits as Votto’s final total, the two players who failed to reach that mark (Nettles and Walker) have yet to be elected, and in fact, six of the eight players who fell short of 2,500 — the exceptions being shortstops Smith and Larkin — have been stopped short (sorry) of the Cooperstown podium. Four of the six players who failed to total 569 hits (the number Votto needed at the outset of this season) over that final leg of their careers are on the outside, namely Helton, Walker, Whitaker, and Bernie Williams. All of which is to say that continued progress in collecting base hits would seem to be important to Votto’s case, but even that may not be enough.
Given my rough estimate of Votto finishing at 68.0 bWAR, four of the six who matched that or fell short (Nettles, Evans, Helton, and Bernie Williams) are on the outside, but so are are two players who got up into the 70s, namely Whitaker and Walker. Of the six players who failed to accumulate at least 10 WAR over this final leg, four (Larkin, Billy Williams, Raines, and Dawson) were elected, while Helton and Bernie have not been.
Here’s a breakdown of the averages of the Hall of Famers and non-Hall of Famers, along with our projected Votto:
| Player | H/34 | HR/34 | WAR/34 | H/35+ | HR/35+ | WAR/35+ | H | HR | WAR |
|---|---|---|---|---|---|---|---|---|---|
| HOFers | 1989 | 222 | 63.4 | 634 | 61 | 12.9 | 2623 | 283 | 76.2 |
| Non-HOFers | 1787 | 242 | 55.5 | 568 | 70 | 10.5 | 2355 | 313 | 66.0 |
| Votto | 1731 | 269 | 58.6 | 569 | 42 | 9.4 | 2300 | 311 | 68.0 |
Votto appears to be on the light side of both groups except when it comes to his current and final home run totals (a product of his era, at least in part) and WAR. That’s not terribly reassuring, but I do think that as the electorate turns over and becomes more comfortable with the incorporation of advanced statistics into Hall arguments — and we’ve come a long way in the past five years — he’ll be fine. Still, it would be a whole lot cooler if what appears to be the start of a significant decline phase was just a blip on the radar.
Brooklyn-based Jay Jaffe is a senior writer for FanGraphs, the author of The Cooperstown Casebook (Thomas Dunne Books, 2017) and the creator of the JAWS (Jaffe WAR Score) metric for Hall of Fame analysis. He founded the Futility Infielder website (2001), was a columnist for Baseball Prospectus (2005-2012) and a contributing writer for Sports Illustrated (2012-2018). He has been a recurring guest on MLB Network and a member of the BBWAA since 2011, and a Hall of Fame voter since 2021. Follow him on BlueSky @jayjaffe.bsky.social.
Go Joey go! By the way, how is it possible that Mike Trout, in terms of JAWS, is already the 6th best CF of all time and breathing down Griffey’s neck?
He’s really good?