Gerrit Cole and Adam Wainwright and Curveballs
The other day, in one of my chats, someone asked if I could design a dream starting pitcher, throwing any four pitches of my choosing. Of the pitches, I wanted a curveball, and of all the curveballs, I settled on Adam Wainwright‘s. There are a host of excellent curveballs out there — Clayton Kershaw‘s is famous, and Jose Fernandez’s will be — but Wainwright’s is spectacular, and I was also dealing with recency bias after Wainwright’s start against the Pirates in which his curve flat-out dominated. That curve was fresh in my mind, and the worst thing about Wainwright’s game ending was that I wouldn’t be able to watch that curveball anymore.
A funny thing happened on an earlier tour through the Baseball Prospectus PITCHf/x leaderboards. I was looking at 2013 starting pitchers, and I was looking at curveballs, and almost by accident, I noticed that Wainwright’s curve generated a good whiff rate, but Gerrit Cole’s generated an excellent whiff rate. Cole — Wainwright’s opponent in just a couple hours in Game 5 of that series. This was originally slated to be a matchup between two great curves. Now it looks like a matchup between one of those great curves, and another, also great curve. There are a few things we can take away from this.
To put numbers to it, a little over a third of all swings at Wainwright’s curve this season missed. For Cole, it was more like three out of seven. There were 104 starters who threw at least 200 curves according to this source, and Cole’s generated the fourth-best whiff rate, behind Yu Darvish, Ivan Nova, and Roy Halladay. We can also go beyond just swings and misses. Here is a pitch-value leaderboard for 2013, on a per-100-pitch basis. I never really use these leaderboards, but just to establish the point, you see Wainwright’s name, and then the very next name on the list is Cole’s. Against Cole’s curve, batters hit .121 with no power. Against Wainwright’s curve, batters hit .169 with no power. By some of the numbers, they match up very well. By some of the numbers, Cole’s curve looks better.
One of the points: Cole’s curve is good. It works for him, as a part of his repertoire. Used to be Cole was known for his fastball velocity and for his slider, and his curve was almost an afterthought. It got better, with some help from the guy whose start Cole just took:
“I started playing with it last year towards the end of the year,” Cole said. “I think my second day here, this guy [gesturing to Burnett] got ahold of me and started talking to me about it. I use a similar grip as A.J., but I don’t quite have as big hands as he does, so I can’t really get around it as much as he can, but that’s what I pretty much try to do, is copy him.”
Take my word for it that Cole was talking about his curveball in that paragraph. The pitch has gotten better, and Cole has increased confidence in using it. Through September 3, he never threw it more than 14 times in a game. Since then, over five starts, he’s thrown it 16, 21, 16, 21, and 14 times. It’s not that Cole is throwing more curves instead of sliders; he’s throwing more breaking balls instead of fastballs, and he’s been getting more strikeouts. Recent Cole looks more like a phenom than initial Cole, and recent Cole is the Cole who earned this very playoff start.
But, at least when it comes to Cole’s curve versus Wainwright’s curve, there’s another important point: Cole, overall, has thrown his about 12% of the time. Wainwright has thrown his about 27% of the time. Wainwright is known as being in possession of a terrifying curveball. Cole’s still known more for his heat, and he doesn’t lean on his curve to nearly the same extent. Subjectively, it feels like Wainwright’s curve is better, and it has generated similar results while being thrown twice as often. This gets into the game-theory aspect of pitching, and evaluating pitchers.
My favorite example is that, while he was still active, Tim Wakefield threw, statistically, one of baseball’s most effective fastballs. What he actually had was maybe baseball’s worst fastball, but no one ever expected it because of the other thing, so his fastball worked as a surprise. Game theory is about optimizing usage rates — usage rates and randomness — and it’s meaningful that Wainwright’s curve has done what it’s done at that frequency, while Cole’s has done what it’s done at a lower frequency. We can’t say whether or not Wainwright or Cole have optimized their usage rates, but if Cole threw his curve as often as Wainwright does, odds are it wouldn’t look as good. We can’t actually know that, but it’s the probability. Cole’s curve, probably, can only generate Wainwright-like statistics when it’s thrown less frequently. Maybe I’m being too stubborn in insisting that Wainwright has the better curveball, but presuming he has the better curveball, Cole’s would do worse if he used it more.
And this is all why it’s virtually impossible to evaluate any single pitch or pitch type. The results generated by a pitch are generated by both that pitch, and by all the other pitches. Cole’s curve works as a part of his repertoire, which includes other pitches. Wainwright’s curve is the same way. Cole’s curve has gotten a lot of whiffs, but that’s at least in part because of his heater, so where should that credit go? Pitches are not thrown independently of other pitches, even if, on paper, that’s exactly the case. And because they’re all connected, they can’t be stripped of context. You can try, and you can talk about the best and worst pitches in the league, but that’s just going to be misleading. A pitch that gets a ton of whiffs or a lot of bad contact isn’t necessarily the best pitch in baseball. It’s just a pitch that should probably be thrown more often, until everything’s more or less in equilibrium. In theory, the numbers for that pitch would get worse, but the numbers for the other pitches would get better, even though the pitch itself wouldn’t be changing anywhere but in usage frequency.
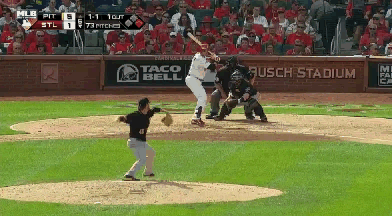
We have a good sense that Game 5 between the Cardinals and Pirates will feature a couple good curveballs. Here is a glimpse of what they look like:

Gerrit Cole’s curve, statistically, has been every bit as good as Adam Wainwright’s. But Wainwright probably still throws the better curveball between the two, because Wainwright’s is probably one of the best curves in the world. There’s a lot of stuff that can be thought about, here. A few baseball lessons that are crucially important to understand. Alternatively, you can just skip the reading and the thinking and wait for the pretty pictures of curveballs in the game itself. There should be lots of them, and I couldn’t be more excited. Well, that isn’t true, but I am excited though.
Jeff made Lookout Landing a thing, but he does not still write there about the Mariners. He does write here, sometimes about the Mariners, but usually not.
Looking at Brooksbaseball, It appears he is somewhat “merging” the pitches lately.
He is throwing the slider softer, in the upper 80’s and the curve faster in 84mph range, while his slider was in the 90’s earlier, taking vertical movement off his slider and adding horizontal movement.
The batter sees a 86mph pitch. Before could be a slider, change-up. he has to predict how it is going to break. He has change the curve to give them another pitch to guess at. Especially if he hides his delivery well.
http://brooksbaseball.net/velo.php?player=543037&b_hand=-1&gFilt=&pFilt=FA|SI|FC|CU|SL|CS|KN|CH|FS|SB&time=game&minmax=ci&var=mph&s_type=2&startDate=03/30/2007&endDate=10/09/2013