Groundballs and Home Run Rates
Yesterday, I looked at balls hit on the ground versus balls hit in the air and their relative weights of offensive levels. The conclusion that arose from that was that ground balls are far less harmful to pitchers than fly balls. I do not think that should come as a shock to anyone, though the magnitude of difference might have been surprising.
Of course, pitching is not isolated. In order to get more strikeouts, pitchers generally have to pitch more out of the zone and thus risk more walks as well. Pitchers that seek ground balls tend to pitch lower in the strike zone, and one theory that has been prevalent is that ground-ball pitchers allow home runs more often on their fly balls since their “mistake pitches” are elevated into the hitting sweet spot. In other words, when they aim low and miss high, watch out. It makes some sense, but does the data bear this out? I went looking at figures from both leagues over the 2007 through 2009 seasons.
Looking only at batted balls classified as fly balls (no line drives or pop ups), as a pitcher’s ground ball rate increases does a pitcher’s home runs allowed via fly ball per fly ball increase?
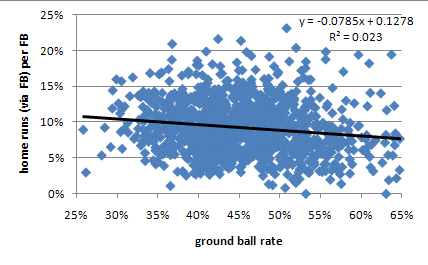
No. In fact, it goes down a little. This might be surprising to some, but I expected something close to this result as it is something I have looked at a couple different times over the past few years and continually end up with the same answer. This look was slightly different as I restricted the home runs in question to only those coming off fly balls. I usually find a trend line that is close to horizontal if I include all types of home runs. Either way, nothing close to a positive trend.
What about line drives? Looking only at batted balls classified as line drives, as a pitcher’s ground-ball rate increases does a pitcher’s home runs allowed via line drive per line drive increase?
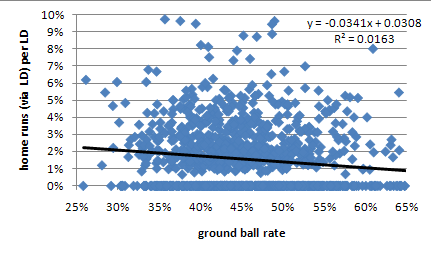
Also no. I was genuinely surprised by this. Even if you restrict the data to pitchers that allowed a line-drive home run (to get rid of the influence of all those zero values) the slope is still negative. Line drives are the squarest form of contact by the hitter and I did buy into the theory of more damagingly placed mistake pitches from ground-ball pitchers at least a little.
It turns out that while ground-ball pitchers are expected to allow more line drives, on a rate basis, than fly ball pitchers, the line drives themselves are less likely to leave the yard. My guess is that this would be due to some fuzziness in the distinction between hard hit ground balls and line drives and that ground-ball pitchers see a greater share of line drives credited against them that have no chance of clearing the fence.
Combining the previous two questions, as a pitcher’s ground-ball rate increases does a pitcher’s home runs allowed per non-ground ball increase? No. Less surprising now given the answer to the two previous looks, but worth mentioning for completeness. Also worth noting is that on all of these the R^2 values are incredibly low and the slopes are not dramatic. The best rule of thumb I can state from this look is that a pitcher’s ground ball rate has no impact on his various rates of yielding home runs and what impact there is might actually be negative.
Matthew Carruth is a software engineer who has been fascinated with baseball statistics since age five. When not dissecting baseball, he is watching hockey or playing soccer.
BP ran a nice article about this last year, but without the nice looking charts. GB pitchers rule!
Not so fast. It would be more accurate to say “good pitchers rule”.
If you read Matthew’s earlier post, he specifically mentions that he’s not addressing whether it’s better to be a groundball pitcher or flyball pitcher. He’s just looking at one certain aspect.