How Many Swings Does It Take to Change a Zone Rate?

Opening Day is tomorrow, but not everyone has their legs under them just yet. Take Miguel Vargas, whom I wrote about a couple of weeks ago — he wasn’t even allowed to swing for a quarter of his spring training plate appearances. While he’s swatted three doubles and a homer since taking the bat off his shoulder, he probably wouldn’t have minded at least a handful of extra reps.
And it seems like he isn’t alone. Teams have dealt with the usual rash of injuries this spring, and a sizable portion of Opening Day bats will take the field without the benefit of a full slate of spring training plate appearances. For his part, when Vargas broke his finger, the Dodgers were able to get him some semblance of in-game experience by having him track pitches without swinging.
But for players whose teams opted to sit them out entirely for some stretch during the last few weeks, only to roll them out on Opening Day, they might still get their in-game tracking in — it will just have to come during games that actually matter. I found that last year, there were far more no-swing streaks of at least 10 pitches in April compared to every other month, especially considering that the season got off to a late start (and a late end, hence the extra streaks for September/October):
| Start Month | No. of Streaks | Swing% |
|---|---|---|
| April | 59 | 46.8 |
| May | 38 | 47.8 |
| June | 41 | 47.6 |
| July | 40 | 47.6 |
| August | 37 | 48.1 |
| September/October | 50 | 48.1 |
League-wide swing rates, relatedly, were also at their lowest in April last year. Did that have any effect on swing streaks? The most 10-pitch swing streaks occurred in early summer:
| Start Month | No. of Streaks | Swing% |
|---|---|---|
| April | 12 | 46.8 |
| May | 16 | 47.8 |
| June | 24 | 47.6 |
| July | 19 | 47.6 |
| August | 10 | 48.1 |
| September/October | 19 | 48.1 |
Now, there is a smaller sample size here, but it looks like April wouldn’t have yielded the most swing streaks even if there was an extra week of games. At the same time, considering the time of year during which they’re most likely to occur is just a first step in comparing the two kinds of streaks. Let’s take a look at the longest swing streaks of 2022, just as I did with the longest no-swing streaks when I wrote about Vargas:
| Player | Streak Length | Swing% Rank |
|---|---|---|
| Yadier Molina | 16 | 1* |
| Hunter Renfroe | 16 | T-68 |
| Ryan Mountcastle | 15 | 2 |
| Hanser Alberto | 14 | 1* |
| Rafael Devers | 14 | T-8 |
| Edmundo Sosa | 14 | 2* |
| Christian Arroyo | 13 | 1* |
| J.D. Davis | 13 | T-26* |
| Jorge Mateo | 13 | T-13 |
| Tomás Nido | 13 | 1* |
| Travis d’Arnaud | 13 | 16* |
| *Indicates would-be rank, if player had qualified. There were 130 qualifiers. | ||
Yadi’s retirement party had him swinging out of his shoes, making this list even more ridiculous than the no-swing list: four of these guys would have edged the top-ranked qualifier (Nick Castellanos) if they had enough plate appearances. But the relationship between the Zone% needed to entice a swing streak and the batter in question’s overall Swing% wasn’t major and it was similar to its no-swing analogue, with the same R-squared value and direction of the relationship:
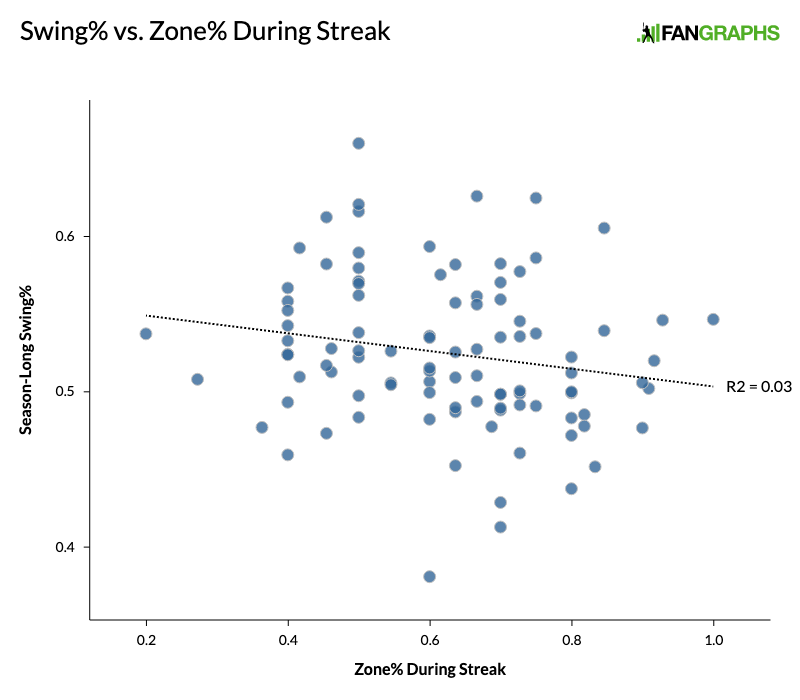
For no-swing streaks, the higher a hitter’s Swing%, the lower the pitchers’ Zone% had to be to get them to keep the bat on their shoulder. Similarly, for swing streaks, lower zone rates could still prompt a streak for high swing rate hitters.
But as with no-swing streaks, the importance of pitcher zone rate went beyond this relationship. In terms of the months of the year, zone rate didn’t have a major effect, as it peaked at 50.6% in March/April and May and reached a nadir of 50.2% in June; there’s simply not enough variation there. Yet, it fluctuated meaningfully between the first five and next five pitches in swing and no-swing streaks spanning at least 10 total tosses:
| Zone% | Pitcher Zone% | Balls | Strikes | |
|---|---|---|---|---|
| First Five NS | 23.9 | 48.0 | 1.32 | 0.63 |
| Next Five NS | 29.4 | 48.2 | 1.38 | 0.62 |
| Difference | -5.5 | -0.2 | -0.06 | 0.01 |
| First Five S | 65.1 | 49.2 | 0.59 | 1.08 |
| Next Five S | 60.4 | 49.2 | 0.06 | 1.06 |
| Difference | 4.7 | 0.0 | 0.53 | 0.02 |
Here, “NS” indicates no-swing and “S” indicates swing. As I found with no-swing streaks (the first three rows in the table are taken from my previous piece), hurlers seemingly began to adjust five pitches into a swing streak, this time throwing fewer strikes. This dip in Zone% was about the same magnitude as the Zone% increase for no-swing streaks, though proportionally it was a much smaller change due to the high starting point for swing streaks (which does make sense — swing streaks should occur when pitchers are throwing more strikes).
Additionally, for no-swing streaks, the average number of balls and strikes (i.e., the count) for each pitch in the first five was nearly identical to each in the next five. Yet, for swing streaks, there were significantly fewer balls in the count for the next five pitches. Because these streaks often spanned at-bats, there were entire at-bats where the hitters did nothing but swing or take. In the case of the swing streaks, this would often mean the next five pitches would only include these sorts of at-bats where the count would always be zero-something.
Pitchers tend to throw more strikes when they’re behind in the count. How much of the decrease in Zone% during swing streaks was because after a swing, which always leads to a strike (or at least a do-over), pitchers’ standing improved?
To answer this question, I ran two logistic regressions on a binary variable indicating whether a pitch was in the strike zone or not. The predictors were: the number of strikes prior to release, the number of balls, and whether the pitch was part of the first five or next five in a no-swing or swing streak. The latter variable (let’s call it “pitch number”) was statistically significant for no-swing streaks, but not for swing streaks, though it did still improve the model’s performance in terms of AIC, a measurement of goodness of fit.
There were only 100 swing streaks spanning at least 10 pitches, far fewer than the 265 no-swing streaks, rendering it more difficult to perform analysis on streaks that occurred only within one game or against the same pitcher as I did with no-swing streaks. For no-swing streaks, the pitch number variable was still significant when looking at streaks that occurred only within one game, but for streaks against only one pitcher, the variable didn’t even improve the model.
This just goes to show that the effects I’m looking at here are small, can be obscured by related variables, and may only truly manifest in large samples; when I pared down the no-swing dataset, the pitch number variable lost its statistical significance. Such is the plight of a post-Moneyball baseball analyst — much of the low-hanging fruit has already been picked.
Yet, whether due to changes in count or pitcher adjustments, the Zone% differences are real and something for a hitter mired in a streak to potentially be aware of. At the same time, I understand that hitters need all of the headspace they can get to hit a round ball with a square bat, especially when said ball is coming at them faster than ever. So, if this article is just for fun, I’m here for that too.
Alex is a FanGraphs contributor. His work has also appeared at Pinstripe Alley, Pitcher List, and Sports Info Solutions. He is especially interested in how and why players make decisions, something he struggles with in daily life. You can find him on Twitter @Mind_OverBatter.
This was a fun read. It must of gotten buried somewhere!