How Shortened Seasons Affect Future Projections
Unusual situations create interesting problems for analysts to solve. While it’s still not clear just what the 2020 season will look like — if indeed there is a 2020 season — the one thing that’s guaranteed is that baseball this year will probably look very different than any season in living memory. (Incidentally, I won’t say all-time: 19th century baseball saw a team disband during warmups because no one was in attendance and some of the home squad left with the visiting team.)
Interesting challenges are usually fun to tackle, though admittedly I much prefer those that don’t involve a lack of baseball. The general belief around the game is that we will get some baseball this year, making the challenge of the moment figuring out what a shortened season will mean for the projections; regardless of what form this season takes, come 2021, I’ll have to churn out ZiPS projections, which should prove to be a trickier-than-typical offseason task.
The natural hypothesis is that in the short-term, the projections will be worse than usual, due to greater uncertainty and simply fewer games played by the players in question. If the season opens in late June or early July, it’s likely that teams will play somewhere in the neighborhood of 100 games. The good news is that while we haven’t had a lost season, we have two strike-shortened seasons, in 1981 and 1994, that can help guide us. They’re not 100% comparable — 1981’s strike was in the middle of the season and 1995 was slightly shorter as well — but they’re the main historical comps we have to look at.
ZiPS projections didn’t exist during these seasons, as I was in high school in 1994 and was just figuring out how to use a toilet in 1981. So to get an idea, I ran some very simplified projections, using only the basic data and simple aging, a stripped-down projection that’s similar to Tom Tango’s Marcel the Monkey forecasting system.
ZiPS is designed to take shorter seasons for players less seriously than usual, but does that approach actually work for this particular problem? I went into this analysis suspecting worse performances in the 1982 and 1995 projections, with those effects moderating quickly in subsequent seasons.
Here are hitter wRC+ baseline projections vs. the actual statistics for the years 1972-2019, using root mean square error to measure accuracy. For the player pool, the results are weighted by a player’s actual plate appearances or batters faced for pitchers. I’ve highlighted the three years after the shortened seasons in red:
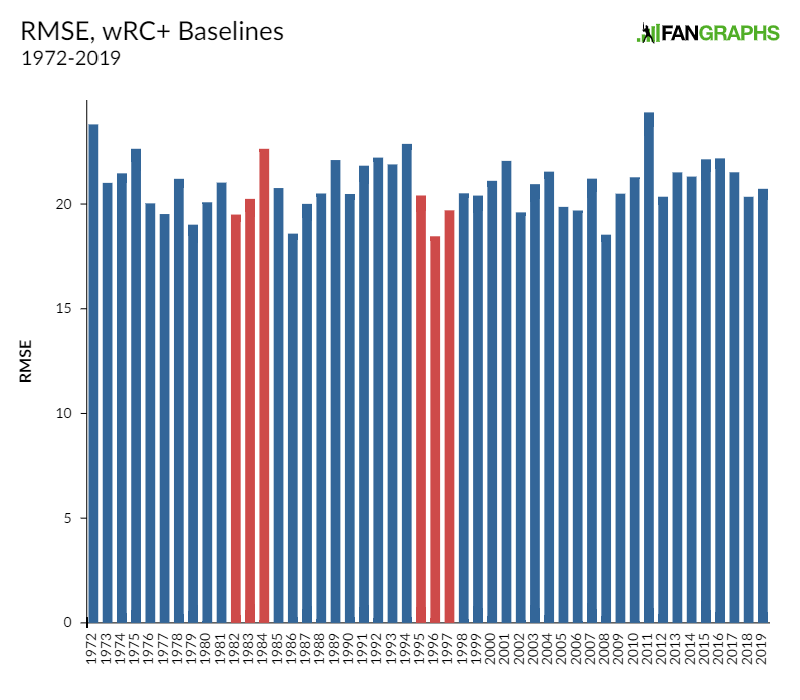
I was legitimately surprised by the results. Having less data ought to result in worse projections but it just didn’t happen in the cases we have to examine. In fact, the basic 1996 wRC+ projections were the most accurate despite nearly a half-season of games over 1994 and 1995 evaporating into the ether. I’ve spent three solid days trying to figure out why the results aren’t notably worse than expected, something other than the rather unsatisfying answer of “the sources of errors in projections are so large they dwarf any accuracy loss due to missing games.”
I re-tested projections vs. reality for all the basic offensive components and got similar results. For example, here’s how batting average projections fared against reality.
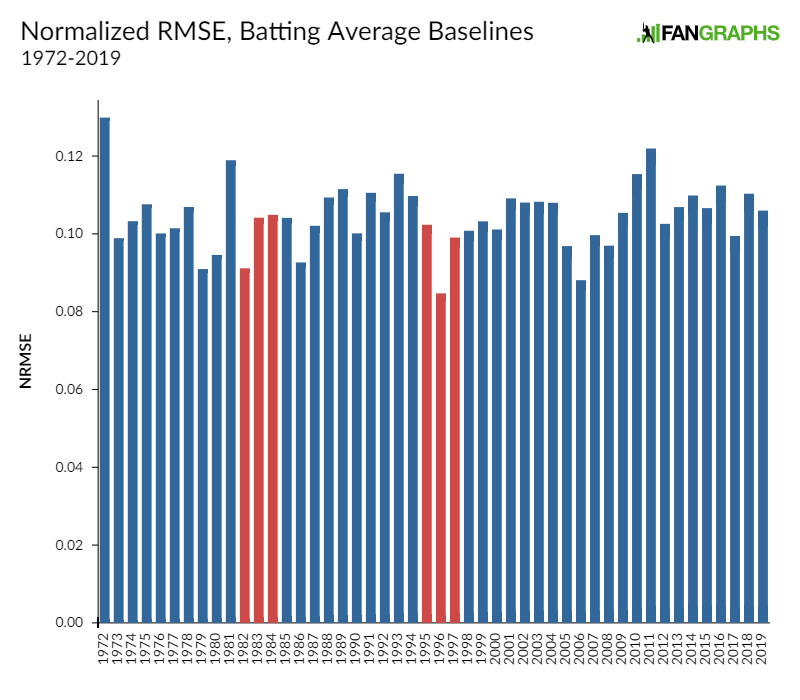
There’s nothing that makes me more suspicious than completely unexpected good news. Hopefully, the pitching projections over those same years will disappoint me to my satisfaction.
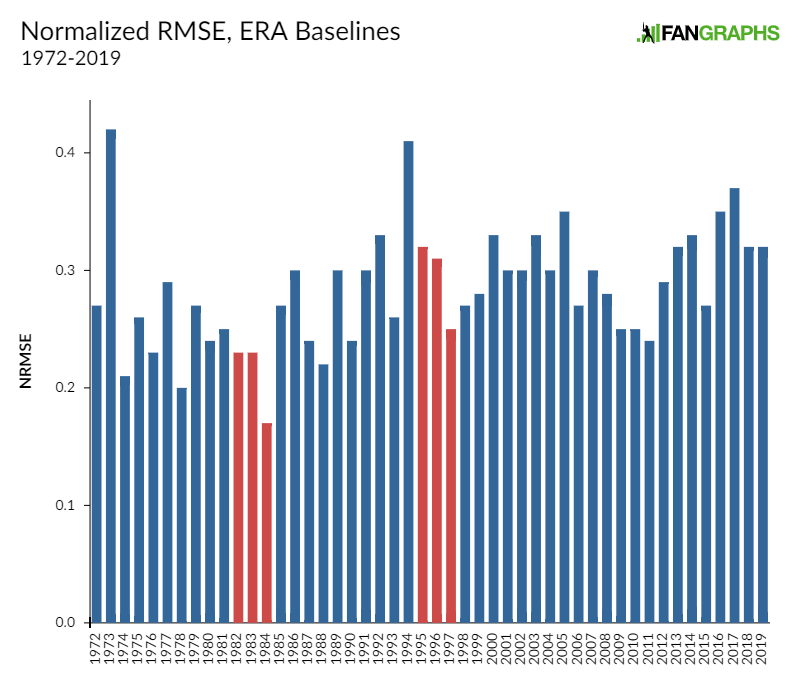
ERA was the same story. Of the summary stats, ERA is one of the noisier ones, so I also evaluated the accuracy of FIP projections.
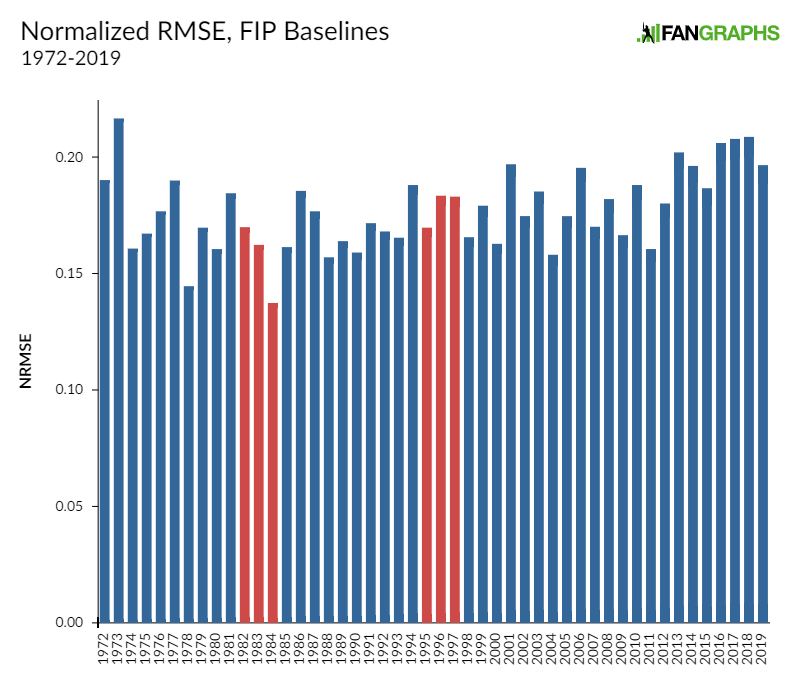
FIP tends to be a more accurate projector than ERA simply because its components are less volatile, but both stats are on the same boat here. Projections after shortened seasons had no tendency to be less accurate.
One interesting side note is that there’s a slight worsening trend for baseline FIP projections. ZiPS does a lot more than make simple baseline projections, of course, but it may be interesting to delve into this further in a future piece. Are teams simply learning enough about fielder-hitter interactions to better identify pitchers who can beat FIP?
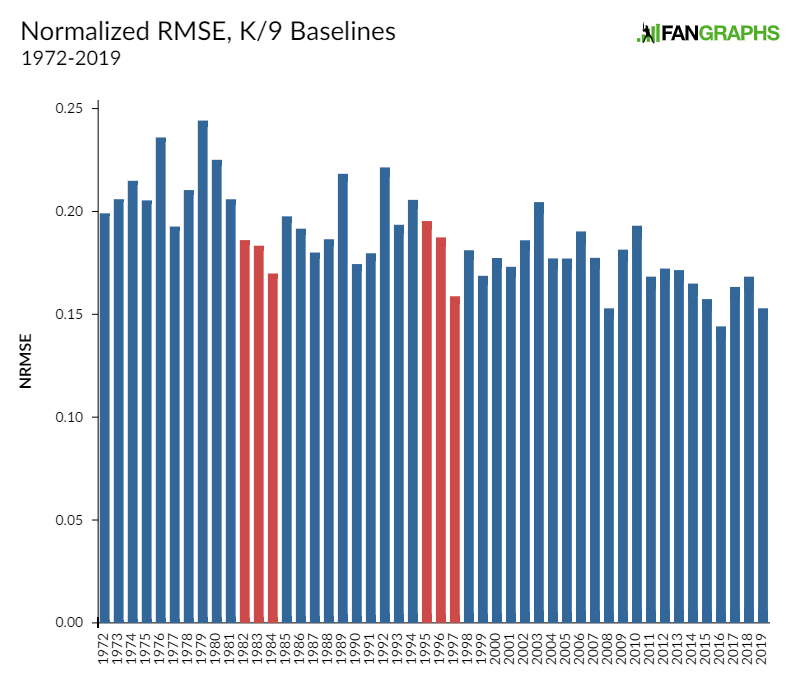
Strikeout rates tend to be pretty stable, and it’s a similar story. While there’s a long-term trend towards slightly improved accuracy in baseline projections here, there’s no marked deficiency in post-shortened seasons.
Just to make sure we didn’t have a methodology issue, I went back and used the Marcel projections themselves and got similar results.
So, what does this mean, and is it good news or bad news? A little bit of both, I’d say. One could say it’s bad news in the sense that it’s a reminder that projecting the future comes with inherently gigantic error bars, to the point that something like significant chunks of missing games might simply get lost in the margin of error. But it’s good news in the sense that there’s no obvious problem projecting players based on shortened seasons. For a less equivocal answer, consult me in 18 months!
Dan Szymborski is a senior writer for FanGraphs and the developer of the ZiPS projection system. He was a writer for ESPN.com from 2010-2018, a regular guest on a number of radio shows and podcasts, and a voting BBWAA member. He also maintains a terrible Twitter account at @DSzymborski.
Where I think it does matter, is in counting stats, no? PAs and IP would be down, along with all the others. So, a SP maybe throws 135-150 innings, instead of 200. So, maybe his FIP and other metrics are in line with his projection, but pitchers’ innings would be down across the board. Same goes for hitters.
Please tell me if I’m wrong on this.
You’re wrong on this.
Make me think that without the benefit of practice and training at team facilities as part of a normal off-season/spring, players are less likely to have new gains in a new season that projections can’t account for. And if they are not training as hard perhaps there are less injuries.
Regarding the improving FIP projections, it may be that teams are dumping guys who massively outperform their FIP. In the past these guys would get a spot on the roster and ZiPS would rightly pan them. Now you don’t get a chance to repeat the outperformance.
I’m wondering if something that might be missed by projecting a short season is players who typically struggle to stay healthy for 140-150 games may play better than anticipated over a short season, because their normally is expected nagging injuries associated with 100+ games are gone. I can’t figure out how to account for that unknown in a projection, but should be hella interesting (assuming any games are played).
I’d like to see which players benefit most from shortened seasons because of nagging injuries. Does Stanton see a higher relative increase in value? Same for Kershaw
That’s honestly pretty flabbergasting. I’d be interested in seeing a comparison of actual shortened seasons with artificial ones. That is, what does the model look like if we take a few randomly chosen years and just lop off the second half of the season? Is it the case that ~110 games just aren’t much less predictive than 162 or is there something about the shortened seasons themselves that counteract the deleterious effects of smaller sample size (fewer injuries? Less non-acute wear and tear? More rest and recovery time? A fourth item that’s just another riff on that theme because I can’t really think of another possibility at the moment?),