In 2019, Team Payroll and Wins Are Closely Linked

Over the last decade, we’ve seen a change in the demographics of baseball, with playing time shifting away from older, declining veterans toward younger players still in their prime. There’s a good reason for that, as each new generation of player entering the majors has been getting better and better relative to their older peers. Baseball’s owners have capitalized on this development — those younger, better players are also much cheaper. And teams have not reinvested those gains elsewhere on their rosters, as major league payrolls have stagnated the last few seasons while amateur talent expenditures have become hard-capped. Given the emphasis on younger players, it might be reasonable to believe that when it comes to fielding a winning team, payroll matters less than ever. But that hasn’t been the case this season.
This piece marks the fifth season during which I’ve taken a look at the standings in August and compared them to Opening Day payrolls (2015, 2016, 2017, 2018) and for the most part, the relationship between Opening Day payrolls and wins has been relatively low. I’ve used the Pearson correlation coefficient “r” to track the strength of the relationship between the two and from the end of the strike through 2011, the average correlation per year was .45. In the last seven seasons heading into this season, though, the correlation coefficient between the two was higher than .31 only once, when it was a high .62 back in 2016.
In past years, I’ve noted that while individual season correlations have remained low, looking at either sustained spending or using Forbes franchise valuations to gauge a team’s overall financial might tends to show that the relationship between spending, wealth, and winning remains strong. That logic remains for this season, and indeed, the relationship between wins and payroll trails only that of 2016 season this decade:
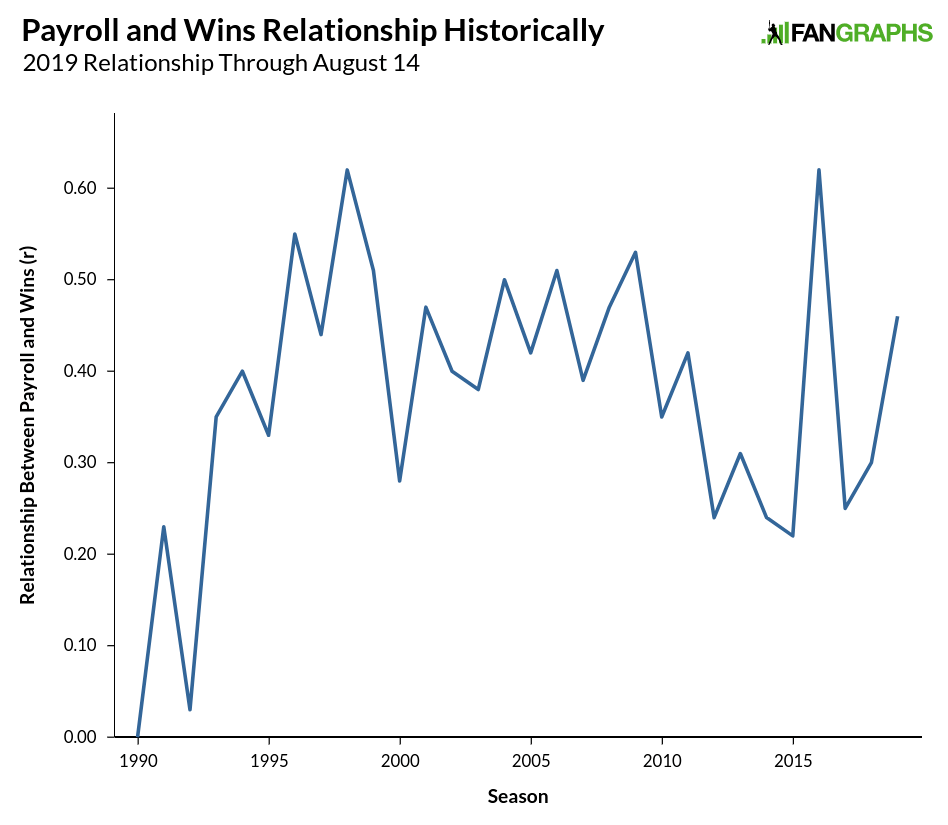
While it’s possible that relationship could dip back down next season, or could even drop some by the end of this season, this year looks a lot more like the late-90s and early 2000s than the rest of the current decade. Two years ago, I wondered if the leveling of the front office playing field resulting from more teams becoming analytically-minded might lead to money playing a bigger role:
The biggest correlation with wins is always going to be talent, and there are a lot of ways to amass talent, but it certainly seems possible that, as teams reach a sort of analytical parity, that money can help be a deciding factor.
At the time, I also believed that increased salaries would mean more teams approaching the luxury tax threshold, which would result in an even more level playing field. But the leveling off of all salaries has still meant a disparity between teams. One standard deviation among major league Opening Day payrolls this season was $44 million, which is no different than it was back in 2013 and 2014. Perhaps because payrolls have remained so far apart, even with declining salaries and a greater emphasis on analytics in the front office, we are seeing money play a bigger factor in wins and losses.
This is what the scatter plot of wins and payroll for this season looks like:
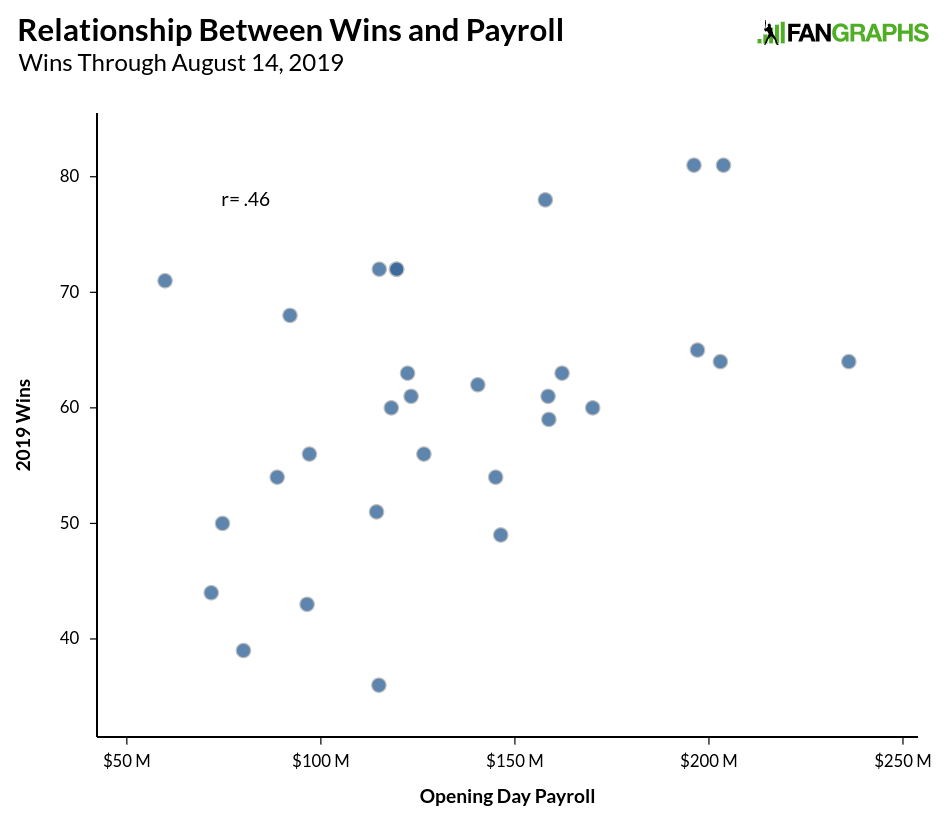
With only 30 data points, it might be hard to make out, but there’s a general trajectory up and to the right. To put a greater emphasis on these data points, I’ll take the same plot and highlight two squares. One highlighted square will be teams at roughly a .500 or better winning percentage and a higher than average payroll. The second square will have teams under .500 with a below average payroll. If money matters, we’d expect more data points in the highlighted squares and fewer outliers outside of the boxes:
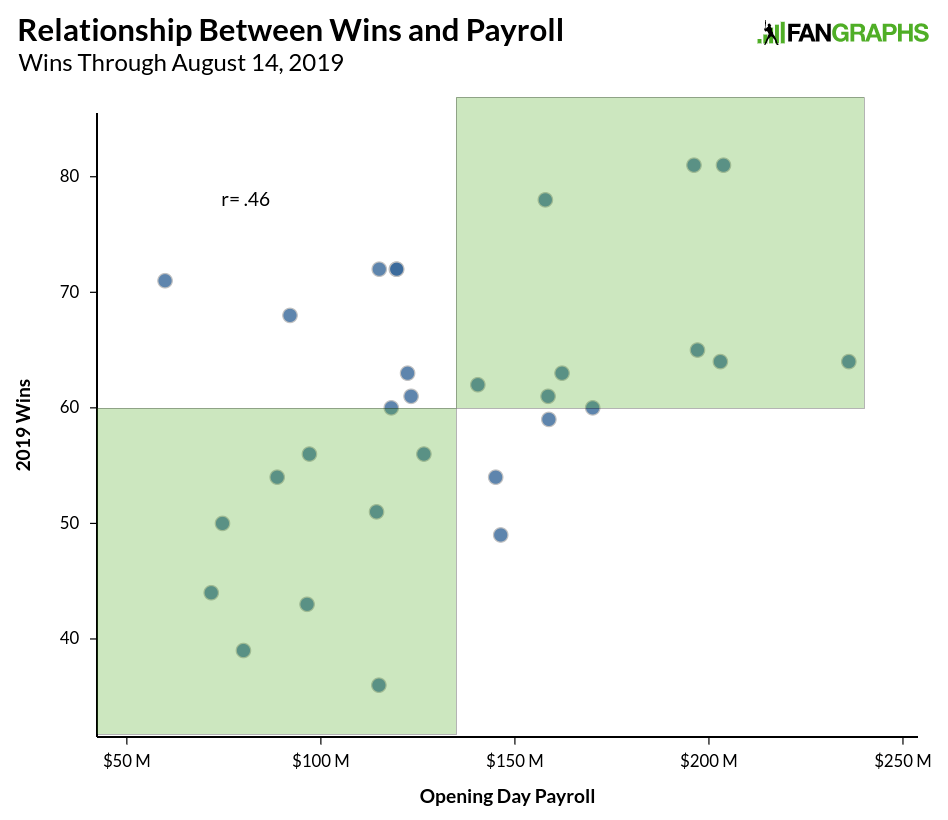
There are 18 points in the squares, 10 outside the squares (Minnesota and Cleveland overlap each other), and two that are on the line. What’s interesting here is that there are a decent number of good teams with low payrolls; teams don’t have to spend money to win. Tampa Bay, Oakland, and Cleveland are all pretty good examples of this. The outliers in the upper left are the teams the Commissioner points to when he tries to claim that payroll doesn’t matter. But when we look at the bottom right portion of the graph, that argument rings a little hollow. If money didn’t matter, shouldn’t there be a lot more bad teams spending money? Of the 13 teams with payrolls above average, only two are actually bad this year (Seattle and Colorado), and they are only a little above the average. Every other above-average spender has put together an at least average team. You might not need to spend money to win in the current environment, but it is hard to spend money and lose.
When we look at the trends over the past few years, the relationship between payroll and wins is even more apparent:
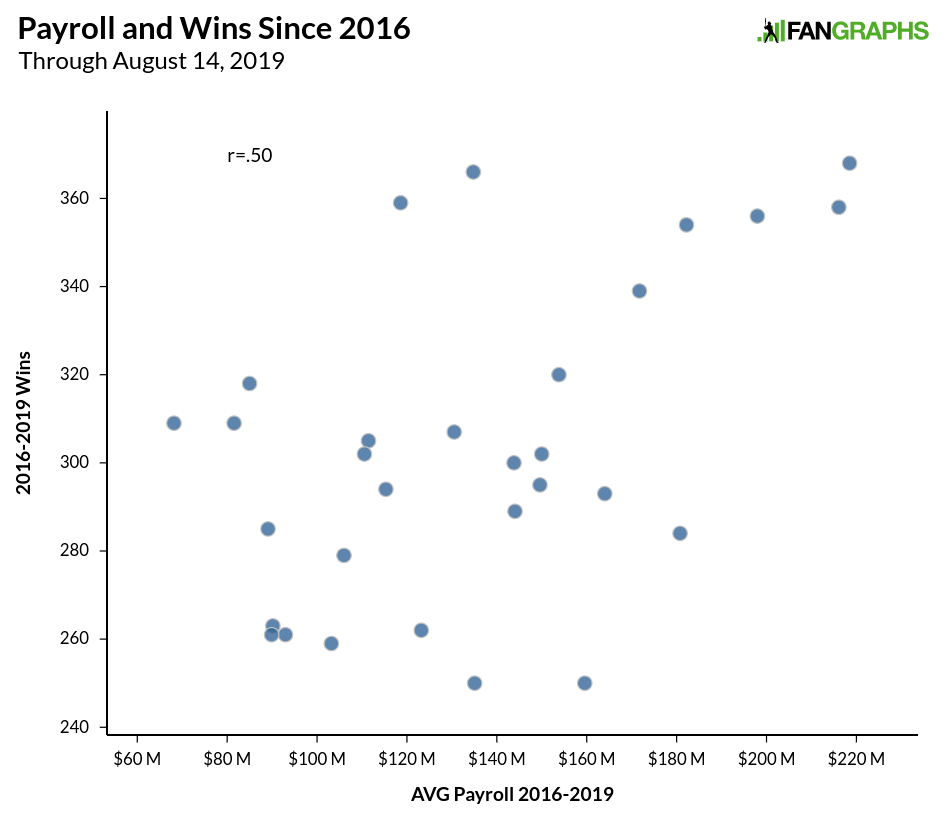
Over the last four years, there are seven franchises that have continually fielded very good teams. Six of those seven have had above-average payrolls, and five of those teams are among the top six spenders in the game. There are 17 teams above that have averaged under $140 million in payroll over the last four seasons. Two of those teams were good, another eight were in the 76-86 win-range, and seven teams were bad-to-terrible during those years. Of the 13 teams with payrolls above $140 million, five were good, seven were in that 76-86 win-range, and only the Tigers were awful.
The data looks the same when we factor in Forbes’ franchise valuations:
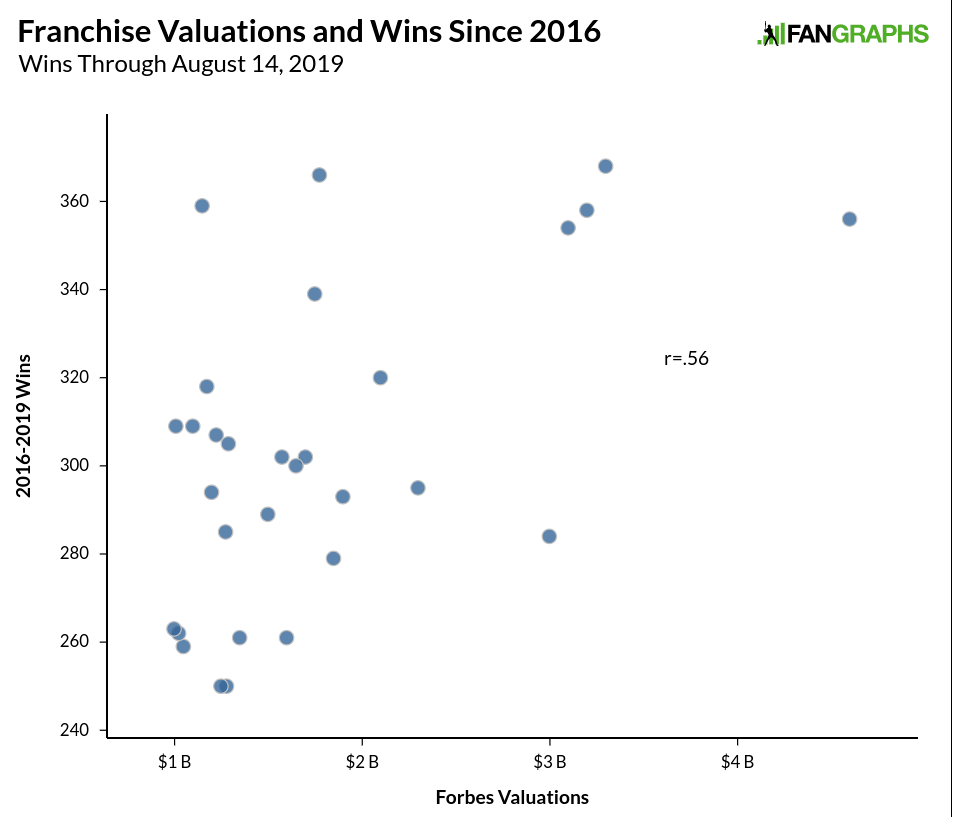
The most valuable franchises in the sport comprise four of the six top spots when it comes to wins over the last four years. The valuations are a bit jumbled in the middle with so may teams in the $1 billion to $2 billion range, but the overall relationship is present. The information above isn’t meant to pit smaller market teams against bigger market teams. With teams like the Yankees, Dodgers, and Cubs all artificially lowering their spending to the competitive balance tax threshold or around it, the great middle class of teams easily could have increased their spending to get closer to the tax amount and win more games. We’ve seen Houston sustaining their success by increasing payroll while Philadelphia is winning more games in part because they’ve increased payroll back to the levels where they were nearly a decade ago.
Most teams have opted to stay in their same spending zone relative to the top spenders. It is harder to find good players in free agency, but teams that are successful in free agency win more games than those that avoid it. Whatever the reasons behind a team spending or not spending money, the teams that spend more win more, and that’s been more true this season than in nearly every year this decade despite the rise of more young and inexpensive talent.
Craig Edwards can be found on twitter @craigjedwards.
Are the Astros great because they spend money or do they spend more money because they are great? My guess is both are factors. It takes a lot of money to make a substantial difference in wins. For teams outside the largest markets, I expect they’ll try to spend less in down years and buy wins when they have better teams. As such, I’m not surprised by the correlation in wins and payroll.
I’d be more interested in knowing, though have no idea how to do this, would be to try to figure out how much payroll is affected by winning and vice versa.
100% this. I also think this is more pronounced because teams are hesitant to give out long term contracts (so easier to spend less in down years and more in good years) and teams being more willing to tank given the Cubs and Astros success.
They really should raise the minimum salary and limit revenue sharing if a team is both consistently bad and also profitable.
I don’t think limits should be placed on revenue sharing other than raising minimum salaries and arbitration contracts. Teams should be profitable. If Tigers decided to increase payroll by $50M next season and the year after that, what are odds that either season is above 70 wins?
I’m fine if teams want to go the roller coaster route of trying for high peaks and low valleys like the Tigers. Sometimes things don’t work out, and you have a longer low than normal.
I’m fine if teams try to play the middle like the Pirates. [Looks at standing] That strategy doesn’t always work out either.
I have 0 problem with profitability. My comment is really just directed at the Marlins. It shouldn’t be a sustainable business model to not care about winning, run an extremely low payroll, and still be profitable off revenue sharing + national tv money. The MLBPA filed a grievance about it last year:
https://www.sbnation.com/mlb/2018/1/26/16937030/mlbpa-marlins-pirates-investigation-revenue-sharing
TL/DR…Marlins are messed up and all Jeter’s men could put them back together again.
Marlins were something like $400M in debt when sold. I don’t think current ownership group has recovered/paid off the debt Marlins had. Also, Forbes has Marlins as having an operating income of -22M. I don’t think Forbes is perfect, but at best Marlins are still paying off debt if not still losing money.
Marlins are a team that cared about winning a lot more than it could afford with the talent they had in the front office. Marlins look like they are going to have financial hardship for 5-10 years based on things done many years/decades ago. Cutting off revenue sharing would kill that team. Not sure what the Miami fans did to deserve that if it happened.
Regarding MLBPA, maybe they should have former members help cover the debt costs. They didn’t have a problem with the Marlins racking up a debt paying players more than they can afford. Highly doubt MLBPA can do anything, but whine as long as Marlins are losing money and/or in debt because they ran too high of payrolls in the past for their revenue (debt payments related to performance are okay for revenue sharing).
MLB should not punish Marlins for screwed up mess they are in. Being in a screwed up mess is punishment enough.
What Miami fans?
It’s tough because on the one hand, you want teams to prioritize winning, and have incentives align to do that. On the other hand, winning takes money (either to sustain it or to start it, depending on where you start). So you don’t want to take away revenue sharing from teams like the Royals, but it would make sense to penalize the Marlins. I can’t think of a single metric that is a foolproof measure because in part payrolls should expand and contract based on competitive windows, but it if there was one it would be great to tie it to revenue sharing.
To an extent, the franchise valuation correlation is also a chicken/egg thing.
Yes, the Yankees are always going to be worth more than the Marlins, but winning generates interest, sells tickets and merch, raises profiles, and all that increases values. So just like with spending, teams outside the biggest or worst markets could have their valuation swing a lot based on how successful they are.
Is there any way to test this? The closest any owner sold after a World Series win was Wayne Huizenga selling the Marlins for $150M in 1998 after claiming the Marlins lost $34M in their World Series year of 1997. Granted, MLB economics have changed a lot in 20 years and Miami doesn’t seem to be a great baseball market, but how much of a spike should a middle-market team owner expect in team value after a deep playoff run?
I remember reading that the value of stock in the St. Louis Cardinals tripled after they won their first World Series in 1926.
This is a great point, I suspect there is another, potentially more useful, way to break it down–which is by the franchise valuation that Craig references near the end of the article.
With respect to keeping the band together: The more common thing is that smart teams either have money and can spend to keep the band together (Yankees, Dodgers) or they don’t have money (or pretend they don’t, in some cases) and are constantly churning over the roster (Cleveland, Tampa Bay, Oakland).
With respect to “buying” wins by taking on big contracts or splurging in free agency, there are teams that have more resources and less, and the ones with more resources are the ones more likely to do this. Philadelphia, Boston, and the Mets are the obvious examples, but the Angels did this a lot a few years ago too, and the Yankees and Dodgers certainly aren’t immune to this either. Here, we have a similar situation, where resources matter a lot. Teams like Cleveland, Tampa Bay, and Oakland virtually never do this.
In both cases, we see that high-resource teams should spend more when they win more, and win more when they spend. The overall ability to spend money is something that affects the ability to spend money, which is then locked in a cycle of sorts with winning.
You can see this with some smaller market teams that do similar things, but probably just can’t do it for as long. The Brewers do something similar, although on a smaller scale; so did the Royals. But it’s harder for teams like the Brewers and Royals to do this simply because they have less money to spend. The Astros have more resources than either, but those three teams should not be able to keep their competitive windows open for longer, simply because they can’t afford to (the Astros have a huge pipeline of talent and have more resources than Milwaukee/KC so their window will be open for a while, but imagine what they could do if they had the Dodgers’ resources).
There are some interesting outliers. The Cardinals spend a lot of money overall to keep a consistent product on the field, despite having mid-level resources. The Padres splurged, despite being not close to contention, probably to get fans excited. But generally speaking it seems like resources are the underlying issue here, and for many teams the question of “spending money” is a bit of a distraction.
The padres still have a small payroll overall, its like 100mil.
I think the Astros are great because in the early 2010’s, they committed to being really, really terrible. In 2010, the Astros went 76-86. From 2011-2013, the Astros averaged 108 losses per year, never losing fewer than 105 games.
For three years, they averaged 108 losses, or a .333 winning percentage. For four years, they averaged 102.5 losses per season. The Astros were also 74-88 in 2009, so for five consecutive seasons, the Astros were completely out of contention and averaged 99.2 losses per season.
Five straight seasons where they averaged 63-99, three of those seasons they averaged 108 losses.
During this time, they cut ties with everyone who commanded any money, so they were able to stockpile their farm system with players they drafted or signed at a young age, and were able to acquire other teams’ top talent by trading off all their veterans.
That allowed them to build their nucleus of really talented young players: Altuve, Keuchel, Correa, Springer, Bregman, etc… Because they had these players locked-up at cost control, they were able to spend more assets in terms of both money and prospects to acquire Verlander, Brantley, and Greinke, and other key veterans that put them over the top.
The Astros are riding the crest of the wave, but in order to get here and stay here, they had to have five seasons of disappointment, and three seasons of complete and total failure.
Winning provides extra revenue, and now that they have the team together, there’s more pressure to keep it together and keep them at a championship caliber. The downside is that once some pieces begin to go into decline, or you lose a player or two to free agency, there aren’t quality prospects to step in and fill their shoes.
Some teams can manage to keep a decent farm system going even while in a competitive window, which allows that window to last a very long time with even just mid-level resources as long as they don’t go overboard in selling the farm to improve the team with too many blockbuster trades. It’s not easy to do, but it can be done.
I agree with your points, except the part about market size. Iirc Houston is the 3rd largest market, behind only NYC and LA.
I think Chicago is larger.
“Hi.”
~ Chicago
Chicago, Dallas, Philadelphia, DC
There was an article a few years ago (probably here) that tested this. They averaged payrolls with team performance based on the previous year, both improved records and worse, to see where spending went. I think it also factored in # of pre-arb, arb-eligible, and FA age players for each team to help measure whether a dramatic improvement was due to an influx of controllable guys hitting their prime vs paying Mike Hampton.