
Mets-Royals Team Comparison Dashboard
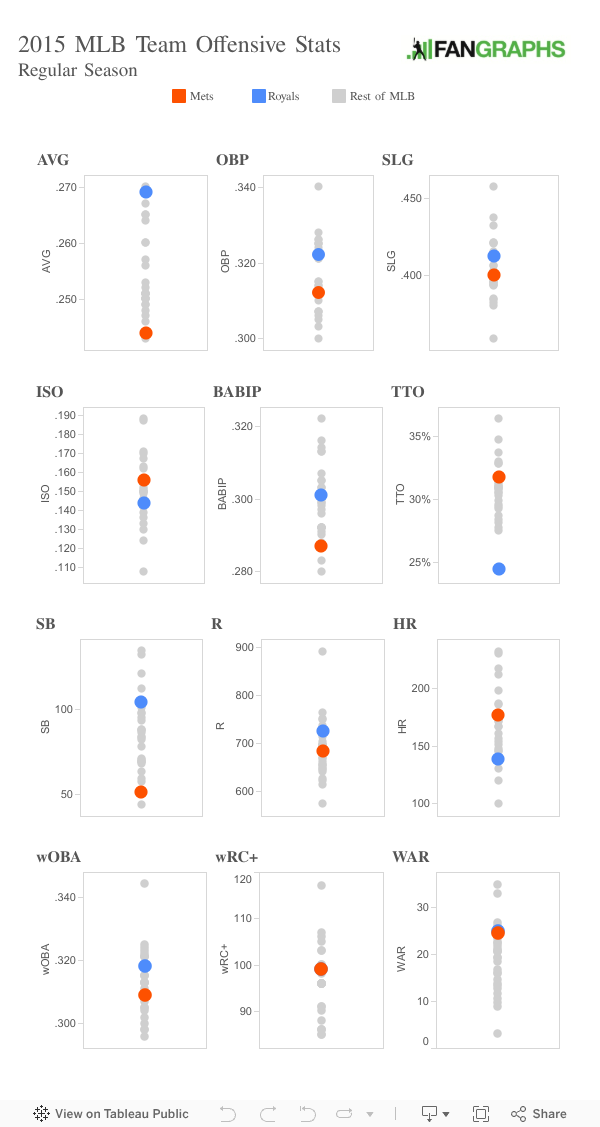
Building off of Eno’s comparison between the Mets and Royals, I built a quick dashboard that shows team offensive and pitching stats for all 30 teams, calling out the two World Series participants. This is just a visual representation of some of the most popular stats on our leaderboards. There are a few interesting extremes such as the three true outcomes (TTO), which Eno looked at yesterday, and batting average.
These plots are box plots without the boxes, so the location of the dot on the y-axis represents the team’s stat in that particular category. A dot’s size and color are just for call out purposes. They are also interactive so you can explore where other teams fall.
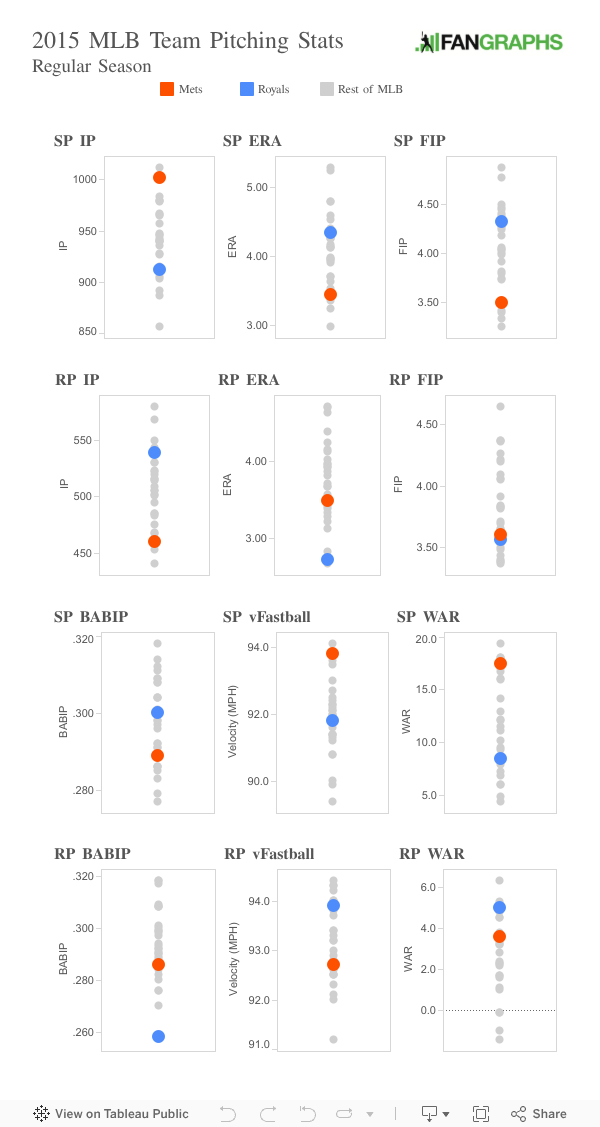
On to pitching. I’ve put the starting pitching next to the relievers so you are able to compare the different strengths of each team’s pitching corps. vFastball denotes the team’s average fastball velocity per PITCHf/x.
I build things here.
Would you be able to include the Mets offense after the all-star break? I believe that Eno had drawn a strong comparison between the Mets season overall and the Mets season following this period.
Oh, is the author taking Mets fan requests? Can you redo your entire article that’s already been posted and only include second half ops for most our hitters except granderson and duda. You can keep their whole season stats. And could you only count daniel murphy’s postseason into the batting average stat but you can use his yearly homerun total, heck you could actually include his ops. And can mets starters era be only for the cubs series please, figure looks a little high when you use the season total. Thanks.
Man, the comments around here get worthless in the postseason.
Cubs fan?
Uugh, my bad? I just figured since this was a visualization of an Eno article, and that said article included a last 30 days category, it might be useful visual aid to include a post-break data point.
It’s actually a good question, and something I thought about. Building the splits in would have taken more time than I had to make it. I basically simplified Eno’s concept and looked at the most popular stats from our leaderboards.
Great graphs.
One thing that struck me was that despite lagging in almost all offensive categories, the 2 teams have nearly identical WAR. That seems really bizarre. I’m sure it’s right, but it’s hard to see why.
wOBA and wRC+, which effectively make up the largest part of Position Player WAR, are about the same. wRC+ and WAR are park adjusted and league adjusted. So it’s lost in a lot of that math. In absolute terms, their wOBAs are closer than you might think given the disparities.
I was going to suggest defense, but the Mets were +39.7, Royals +38.7. So much for that lazy narrative.
It’s worth noting that the Royals have a huge lead in offensive categories that don’t have a huge effect on overall offense (avg and SB’s), and a fun stat that’s about process rather than performance (TTO). Meanwhile, the Mets have a huge lead in HR’s, which is a much more significant stat. Everything else is fairly close.
Overall, the Royals have a modest but significant lead in the overall offensive stats (wOBA and runs scored). Once you make a park/leage adjustment, the Royals’ lead evaporates.
I’m just not seeing the Mets Offensive WAR being so high. Forget about compared to the Royals, compared to everyone.
I hope it’s not additive and including postseason games – that would skew the results in the Mets favor.
First off, it’s not “offensive WAR”; it includes defense. And it doesn’t include the playoffs (pet peeve: postseason stats can be found nowhere on FG).
You’re right that the Mets raw batting numbers are mediocre(#20 in wOBA). But then add in a park adjustment (#2 in MLB), baserunning (#8 in MLB), defense (#7 in MLB). That brings them up to #7 in position player WAR.
Which part of that seems inaccurate to you?
The graph labeled WAR is under the heading “Team Offensive Stats”. That’s why I assumed it was “offensive WAR”.
If you say it includes defense, then that’s the ( legitimate ) source of my confusion.
Mets 2H numbers are irrelevant since they were playing AA level teams in that division.
Mets 1H numbers are irrelevant since they fielded a AAA lineup.
But they were benefiting from your shoes all season, Jerry. Where is the dashboard for that? Where is the dashboard for that!?
Good stuff! If you could invert the ERA and FIP charts, though, it would keep a consistent high = good, low = bad theme going.
Thanks, I’ll keep that in mind. I erred on the side of higher/lower rather than good/bad. But for a dashboard, your suggestion would work better.
Please let me be over with so Mike Moustakas’ can get some fresh gum and Mets fans can get back to not caring about baseball.
Sweet. Very interesting playing around with that. I’m fascinated by how the Cubs and Royals are on the extremes for TTO. And I know the Mets bat a pitcher, but that’s still interesting the Royals had a higher overall team OBP. Also interesting that three of the top four offenses by wRC+ were in the playoffs this year and got knocked out by the Mets and Royals.