The 2020 ZiPS Playoff Probabilities Are Live!

After a successful initial run — during which I managed not to break FanGraphs beyond repair — the ZiPS playoff probabilities have returned for the 2020 postseason. Again, they are not a replacement for the site’s existing playoff odds, which combine ZiPS and Steamer, but rather serve as a supplemental option with a slightly different methodology. These projections are arrived at similarly to how ZiPS does its roster strength projections during the regular season, only with roster constructions that reflect the very different ways players are used during the playoffs:
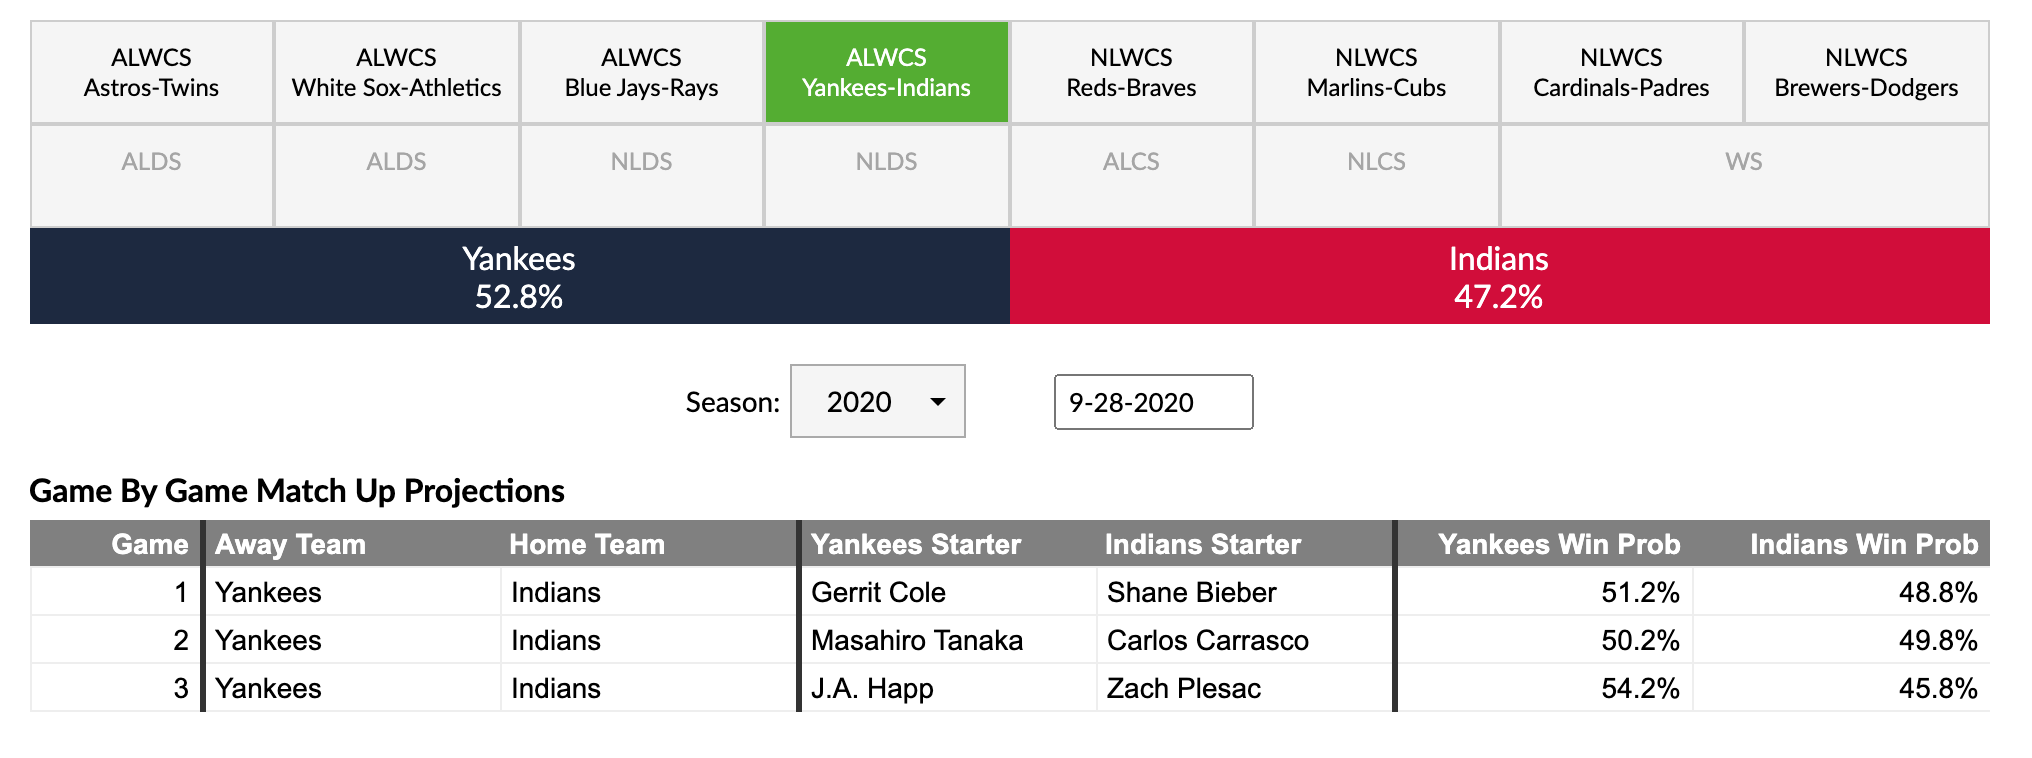
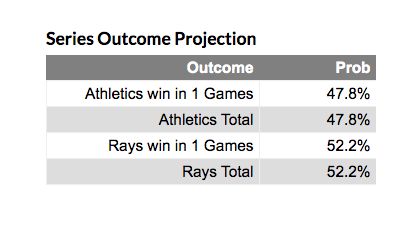
These odds will be updated continually as we get closer to first pitch in each round and each game’s starters become clear. Projections for the Division Series that will be played between the various Wild Card Series’ winners will populate after those series have concluded. For the moment, you’ll see their tabs grayed out. In addition to game-by-game projections, you’ll also find series odds, which will update as each series progresses.
The general methodology remains the same this year, though the mathematics-based shenanigans are slightly more robust. To aid in modeling these probabilities, the full ZiPS model is used, which includes updated platoon projections to (hopefully!) enhance accuracy. In situations where the starting pitcher has yet to be named, you will see the starter listed as “TBD,” which represents a weighting of different pitchers who could theoretically start the game in question. In addition, I’ve modified the model for bullpen quality somewhat to better simulate the mix of pitchers used in high- and low-leverage situations.
One final variable to consider is the effect of the playoff bubble. Home field advantage was larger in 2020 than is typical (teams are usually between .510 and .530 at home, but were .557 this year), but it’s hard to tell how much of that was due to the comfort of playing at home in what was arguably the most stressful season of players’ careers. So, how do we estimate home field advantage in a situation where the comfort and familiarity are no longer present, with no team having a true home park? It would be unsatisfying to simply say that home field advantage is completely gone since there does appear to be some small tactical advantage to hitting second. To estimate this, I looked at historical player home/road splits compared to actual record in a rough attempt to try to isolate decision-making rather than ability as an advantage. It’s unfortunate that teams have never alternated between hitting first and hitting second for a season so that we have data to go through! In the end, my estimate is that home field advantage in this situation is worth about 12 points of winning percentage:
Since FanGraphs offers a handful of projection tools, I’ve summarized in table form three of the most relevant for the postseason: the FanGraphs Game Odds, the FanGraphs Playoff Odds, and the ZiPS Game-By-Game:
| Feature | FG Game Odds | FG Playoff Odds | ZiPS Game-By-Game |
|---|---|---|---|
| Projects Game Results | YES | NO | YES |
| Projects Post Season Series Results | NO | YES | YES |
| Projects Future Post Season Rounds | NO | YES | NO |
| Lineup / Roster | Game Lineup | Projected Overall Playing Time |
Projected Game Lineup |
| Accounts for Starting Pitcher | YES | NO | YES |
| Base Projection System | Steamer/ZiPS | Steamer/ZiPS | ZiPS Only |
| Updates | Before/during game | Shortly after game ends | Nightly |
Let us know in the comments what other stuff you might be interested in seeing regarding playoff projections!
Dan Szymborski is a senior writer for FanGraphs and the developer of the ZiPS projection system. He was a writer for ESPN.com from 2010-2018, a regular guest on a number of radio shows and podcasts, and a voting BBWAA member. He also maintains a terrible Twitter account at @DSzymborski.
This looks very good – but are some of the NL odds for the WC round not adding up to 100%? For example, Cubs have a 54.3% chance of winning the WC and Marlins have a 41.0% chance of winning.
Is the remaining 4.7% that the series ends in an alien attack? Given that this is 2020, I don’t disagree with those odds if that was intentional.
Maybe that got fixed, because what I see at this moment is Cubs 62.7%, Marlins 37.3%.
Thanks. Yes, it does appear that the odds were updated.