What’s the Best That Could Happen in 60 Games?
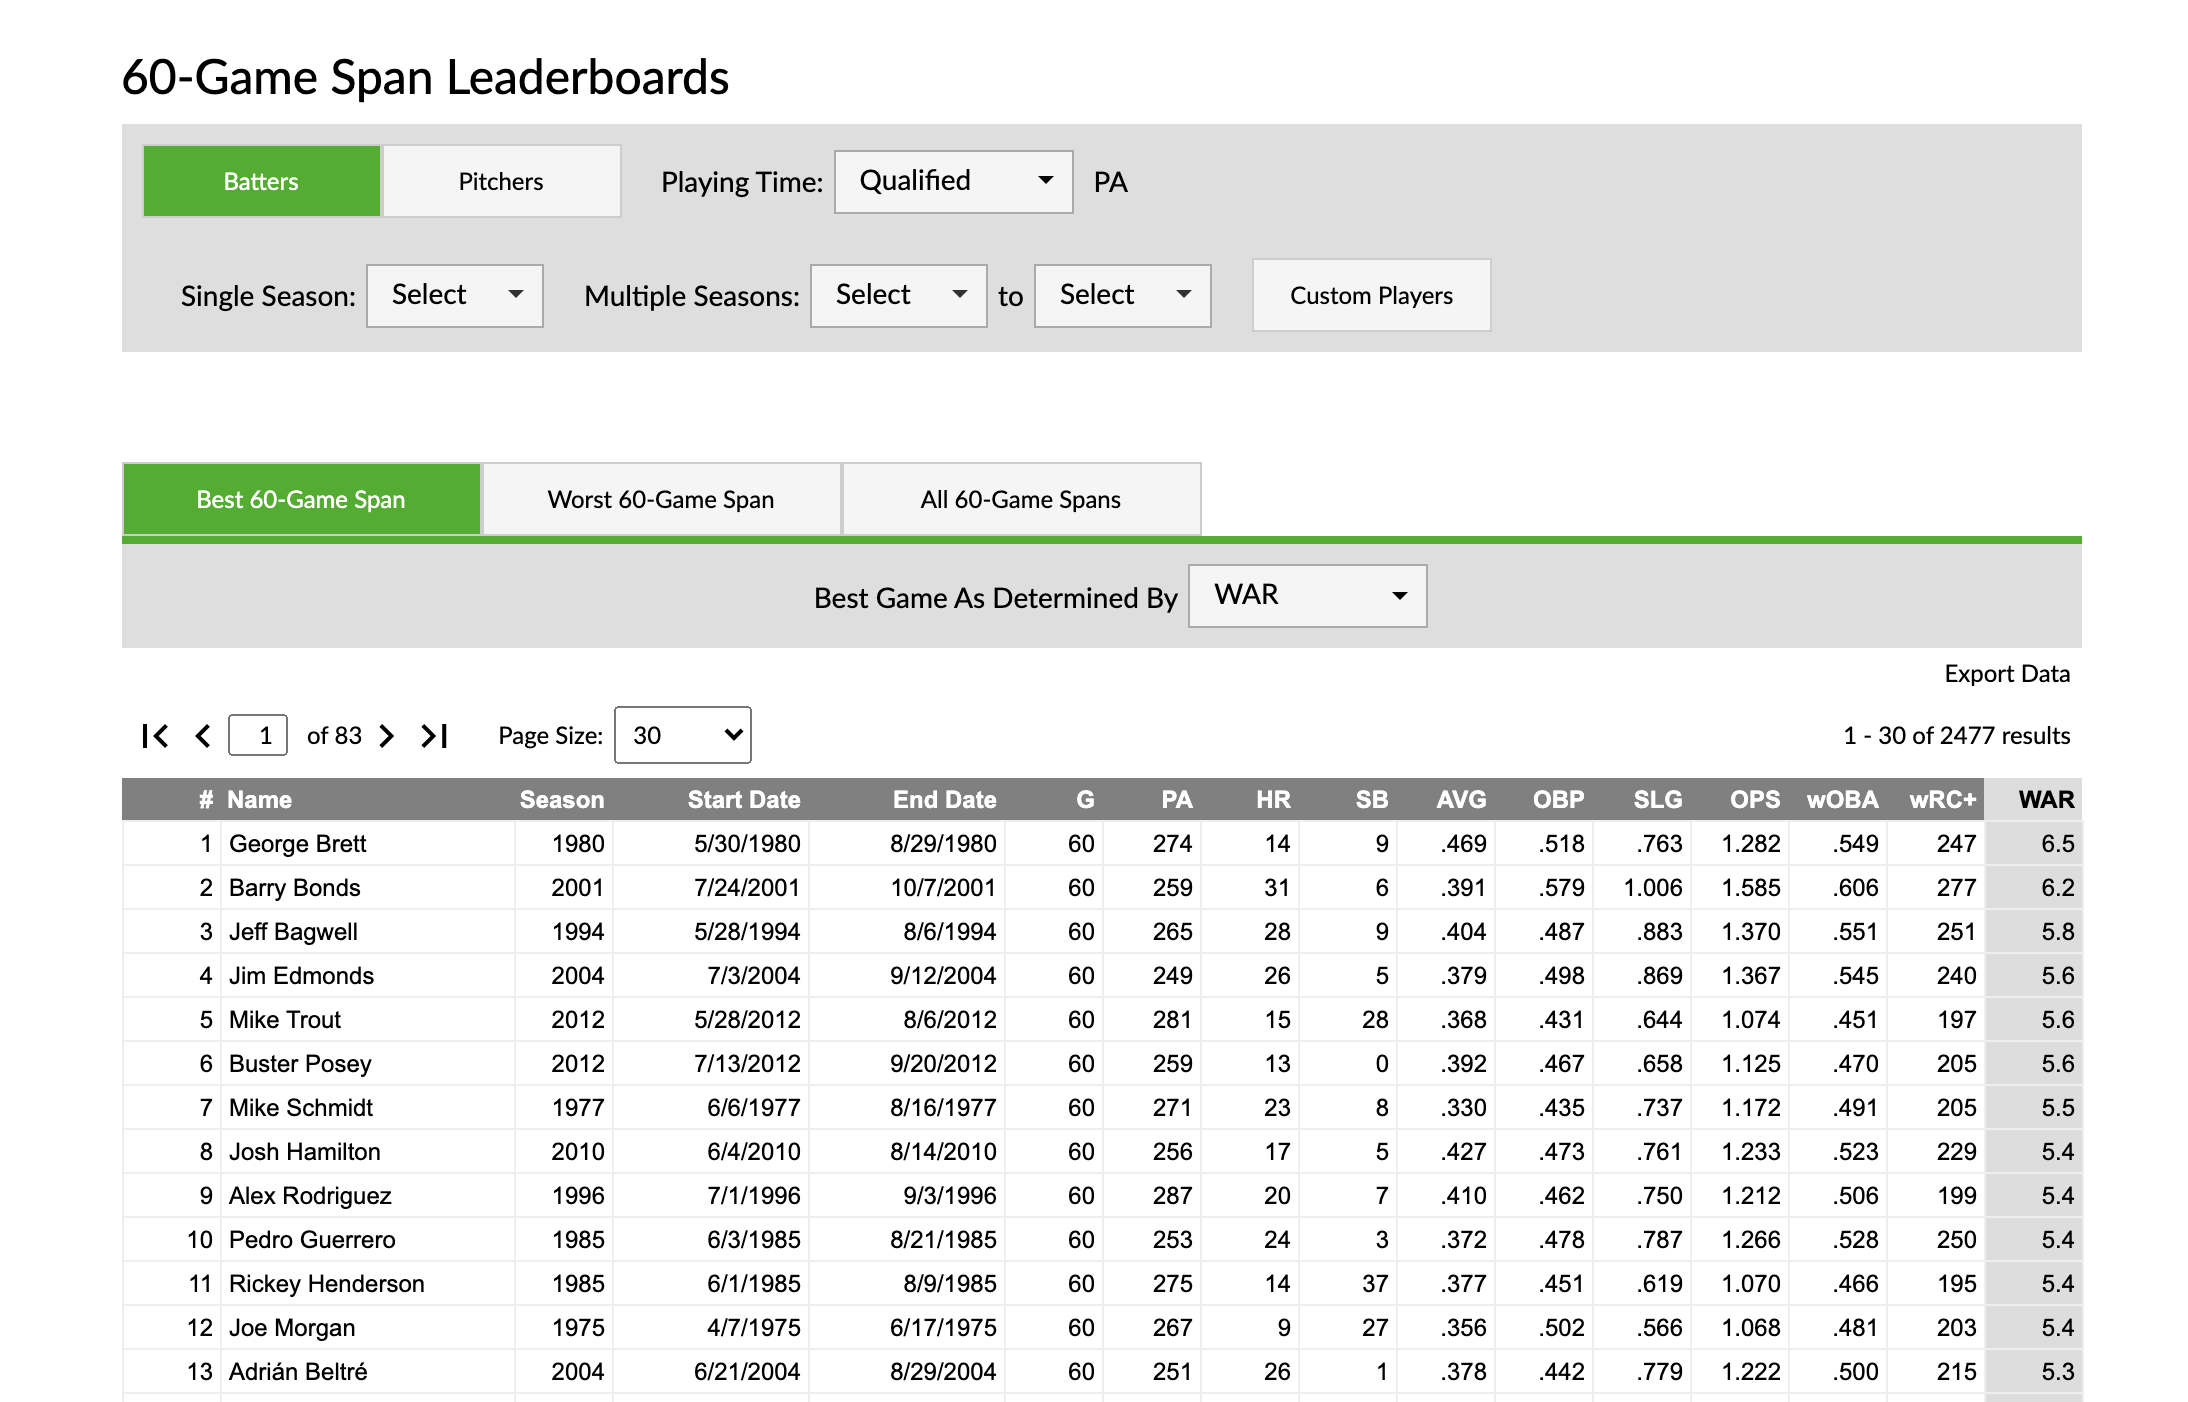
While researching his latest article, Ben Lindbergh of Effectively Wild and The Ringer asked me and David Appelman if we had data for the most WAR accrued over any given 60-game stretch for a player since 2002 (Hint: It’s Barry Bonds). One question begets others, like who had the worst WAR over 60-games since 2002 (poor Ryan Doumit). The next thing we knew, we had literally millions rows of data, so we decided to make a leaderboard out of them so you can use the data we found.
Creating a quirky leaderboard for this equally quirky baseball season takes database resources and developer time. Your continued support and Membership allows us to afford those resources and create a leaderboard you won’t find anywhere else. If you haven’t already, please consider becoming a FanGraphs Member or donating to the site, so that we can continue to create awesome tools to answer your (and Ben’s) baseball questions.
The Basics
- We have 60-game rolling stats for batters.
- We have 12-game rolling stats for pitchers. By default we only show 12-game spans that have all been starts.
- The rolling stats are delineated by season, so each span of games occurs within the same season.
- This is an extension of the data engine behind our rolling graphs on the player pages, except pivoted into a leaderboard.
- Unfortunately, the length of the rolling stats are fixed to 60 or 12 games, and can’t be changed to other values.
- Since these are rolling stats, you can have spans that have fewer than 60 or 12 games. This typically happens at the beginning of the season or if a player didn’t play enough games over the course of the entire season.
- We include data from 1974 to 2019.
Data Views
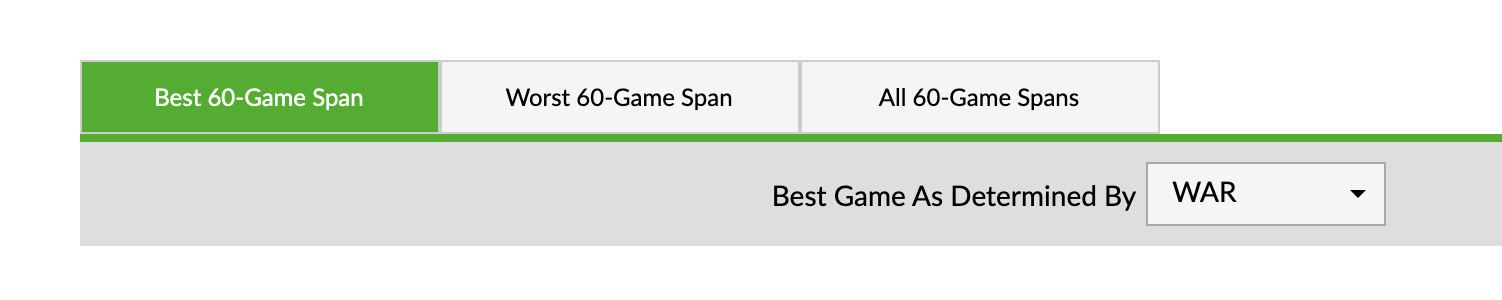
- We have three different data “views”: Best Span, Worst Span, and All Spans.
- The Best Span option finds a player’s best 60- or, if you’re interested in pitchers, 12-game span for that particular stat.
- The Worst Span option does the opposite.
- When using one of these views, you have to use the drop down menu to change the stat. Simply clicking to sort won’t recalculate the player’s best or worst span; it will just sort with the current data set.
- Sometimes different time spans will have the same value for a given stat — if this happens, we report the most recent occurrence.
- The All Spans option has the underlying data for all of this. If you wanted to see all the other 60- or 12-game spans for a given player, this is the place to find that.
- We disabled data exports for All Spans, because the data set is too large for download.
Options
- If you click on either the start date or end date in a given row, it will take you to the player’s game logs for that time span.
- You can set the season time frame you want to look at by using either the single season selector or multiple season selector.
- By default we are filtering out any spans that do not have enough PA or IP to qualify for the batting title or ERA title.
- You can use the Custom Players button to create a custom set of players. This is especially useful to cut down the number of rows on the All Spans view.
- For pitchers, you can choose “Limit to Only SP” to limit the results to spans where the pitcher has only made starts. Any span that contains a relief appearance will be discarded.
If you notice any issues or have any suggestions, please let us know in the comments!
I build things here.
Wow, Adam Moore had his whole worst-60-game stretch in one season (-2.8 WAR in 2010).