Jack Flaherty Is Reaching His High Expectations
Before the season started, expectations for Jack Flaherty were pretty high. After posting a 3.86 FIP, a 3.34 ERA, and 2.4 WAR in 151 innings in his first full season in 2018, projections expected Flaherty to be even better with a 3.74 FIP. After a rough start in Seattle on July 2 in which Flaherty failed to make it out of the fifth inning by walking four and giving up four runs including a homer, the season looked to be a step back rather than a step forward. With a 4.82 FIP and 4.90 ERA on the year, Flaherty’s stats represented a half season of below-average numbers.
Since then, he’s been one of the best pitchers in baseball.
| Name | IP | K% | BB% | HR/9 | BABIP | LOB% | ERA | FIP | WAR |
|---|---|---|---|---|---|---|---|---|---|
| Justin Verlander | 31 | 44.9 % | 5.1 % | 0.9 | .286 | 91.4 % | 1.45 | 1.64 | 1.7 |
| Noah Syndergaard | 35.1 | 27.9 % | 5.7 % | 0.0 | .293 | 75.0 % | 1.78 | 1.77 | 1.6 |
| Jack Flaherty | 38.1 | 34.3 % | 7.0 % | 0.5 | .210 | 95.6 % | 0.94 | 2.20 | 1.6 |
| Jacob deGrom | 33 | 34.4 % | 7.8 % | 0.3 | .301 | 91.8 % | 1.09 | 1.85 | 1.5 |
| Lance Lynn | 40 | 33.7 % | 7.4 % | 0.9 | .319 | 79.2 % | 2.70 | 2.74 | 1.5 |
| Patrick Corbin | 35.1 | 31.3 % | 7.5 % | 0.5 | .364 | 78.2 % | 3.06 | 2.28 | 1.3 |
| Shane Bieber | 37 | 28.7 % | 4.9 % | 0.5 | .278 | 73.1 % | 2.92 | 2.51 | 1.3 |
| Charlie Morton | 36 | 28.2 % | 5.4 % | 0.8 | .333 | 69.6 % | 4.00 | 2.63 | 1.3 |
| Reynaldo Lopez | 31.2 | 25.4 % | 8.2 % | 0.3 | .291 | 77.1 % | 2.56 | 2.71 | 1.2 |
| Gerrit Cole | 40 | 37.1 % | 6.0 % | 1.6 | .228 | 99.2 % | 2.25 | 3.37 | 1.1 |
| Clayton Kershaw | 31 | 32.3 % | 9.7 % | 0.6 | .243 | 88.7 % | 1.74 | 2.64 | 1.1 |
| Matthew Boyd | 31 | 34.9 % | 7.8 % | 1.2 | .319 | 73.3 % | 4.06 | 3.06 | 1 |
| Yu Darvish | 29 | 33.9 % | 1.8 % | 0.9 | .273 | 87.2 % | 2.17 | 2.46 | 1 |
As for what happened, here’s a brief comparison of his numbers over the last month versus the first three months of the season.
| IP | K% | BB% | HR/9 | HR/FB | BABIP | LOB% | P/PA | ERA | FIP | |
|---|---|---|---|---|---|---|---|---|---|---|
| Through 7/2 | 90 | 26.4% | 8.1% | 1.9 | 20.9% | .288 | 74.4% | 4.22 | 4.90 | 4.82 |
| 7/7-8/7 | 38.1 | 34.3% | 7.0% | 0.5 | 5.7% | .210 | 95.6% | 4.01 | 0.94 | 2.20 |
We can see from the BABIP and LOB% that there’s probably some luck going on here with the sub-1.00 ERA, and even if there’s a little bit of luck on the home run rate, his 2.20 FIP wouldn’t be impacted that much. A decrease in homers might be luck evening out, but a big increase in strikeouts while seeing the walks go down shows that there’s clearly more than chance that’s pushing Flaherty to great results. It’s not the opponents either, as two of his six starts have come against the two best offenses in the game in the Astros and Dodgers, with the Cubs boasting a top-six offense as well. The biggest change is more fully embracing his best pitch, the slider.
Over at the Community Blog, Nat Brown discussed Flaherty’s struggles in the first half of the season, noting that Flaherty had struggled mightily against lefties this year after getting good results in 2018. At the time, Brown suggested Flaherty might be using his curve too often against lefties and that he might be better served going to his signature slider more. While the July 7 start overlaps into both Brown’s numbers and the one’s I’m using, we can get a pretty good idea about whether Flaherty might have agreed with Brown’s analysis.
| v L | FA | SL | FT | CU |
|---|---|---|---|---|
| Through 7/2 | 51.6% | 17.4% | 4.5% | 21.2% |
| 7/7-8/7 | 46.6% | 24.8% | 9.2% | 14.9% |
| Difference | -5.0% | 7.4% | 4.7% | -6.3% |
Flaherty did increase his slider usage at the expense of his curve. He also shifted some his four-seamers to a two-seamer that runs away from left-handed hitters. As for the results:
| v L | K% | BB% | FIP | HR/FB | Pull |
|---|---|---|---|---|---|
| Through 7/2 | 20.9% | 8.7% | 6.09 | 21.6% | 42.1% |
| 7/7-8/7 | 27.8% | 9.7% | 2.9 | 5.3% | 35.6% |
| Difference | 6.9% | 1.0% | -3.19 | -16.3% | -6.5% |
The shift in approach seemed to work. While the HR/FB rate might not be sustainable, the drop in pull rate suggests that batters weren’t squaring the ball up quite like they used to. Using more sliders to lefties, while beneficial, isn’t quite enough to make up the difference between Flaherty’s numbers in the first and second halves. His change in pitch mix against righties isn’t quite as dramatic.
| v R | FA | SL | FT | CU |
|---|---|---|---|---|
| Through 7/2 | 45.3% | 33.5% | 14.8% | 3.9% |
| 7/7-8/7 | 50.5% | 34.8% | 8.6% | 5.8% |
| Difference | 5.2% | 1.3% | -6.2% | 1.9% |
He went to his four-seamer more and his sinker less, the exact opposite of his approach against left-handers, while slightly increasing the use of his slider. Here’s the results against righties.
| v R | K% | BB% | FIP | HR/FB | Pull |
|---|---|---|---|---|---|
| Through 7/2 | 31.5% | 7.4% | 3.76 | 20.0% | 42.6% |
| 7/7-8/7 | 40.8% | 4.2% | 1.54 | 6.3% | 23.7% |
| Difference | 9.3% | -3.2% | -2.22 | -13.7% | -18.9% |
Flaherty went from doing pretty well against righties to utterly dominating them. Overall, Flaherty’s swinging strikes have gone from 12.2% to 15.5% with much of the success coming on batters swinging out of the zone more often. Flaherty has been criticized in the past for not attacking hitters given his very good stuff, but attacking doesn’t have to mean throwing the ball in the strike zone. For Flaherty, that might just mean using his best pitch more often, and throwing it out of the zone is perfectly acceptable. When Flaherty is ahead or gets to two strikes, he’s upped his slider usage considerably.
| Ahead | Two Strikes | |
|---|---|---|
| Through 7/2 | 24.2% | 29.7% |
| 7/7-8/7 | 32.4% | 34.4% |
His swinging strike rate on the slider was a very good 23.7% through July 2, but since then, it has been a great 35.6% during his great run. Flaherty is using the slider more often and making it less hittable. The heatmaps below show where Flaherty has been throwing his slider over the last month (on the right) compared to where the pitch was going earlier in the season when he tried to put batters away (on the left).
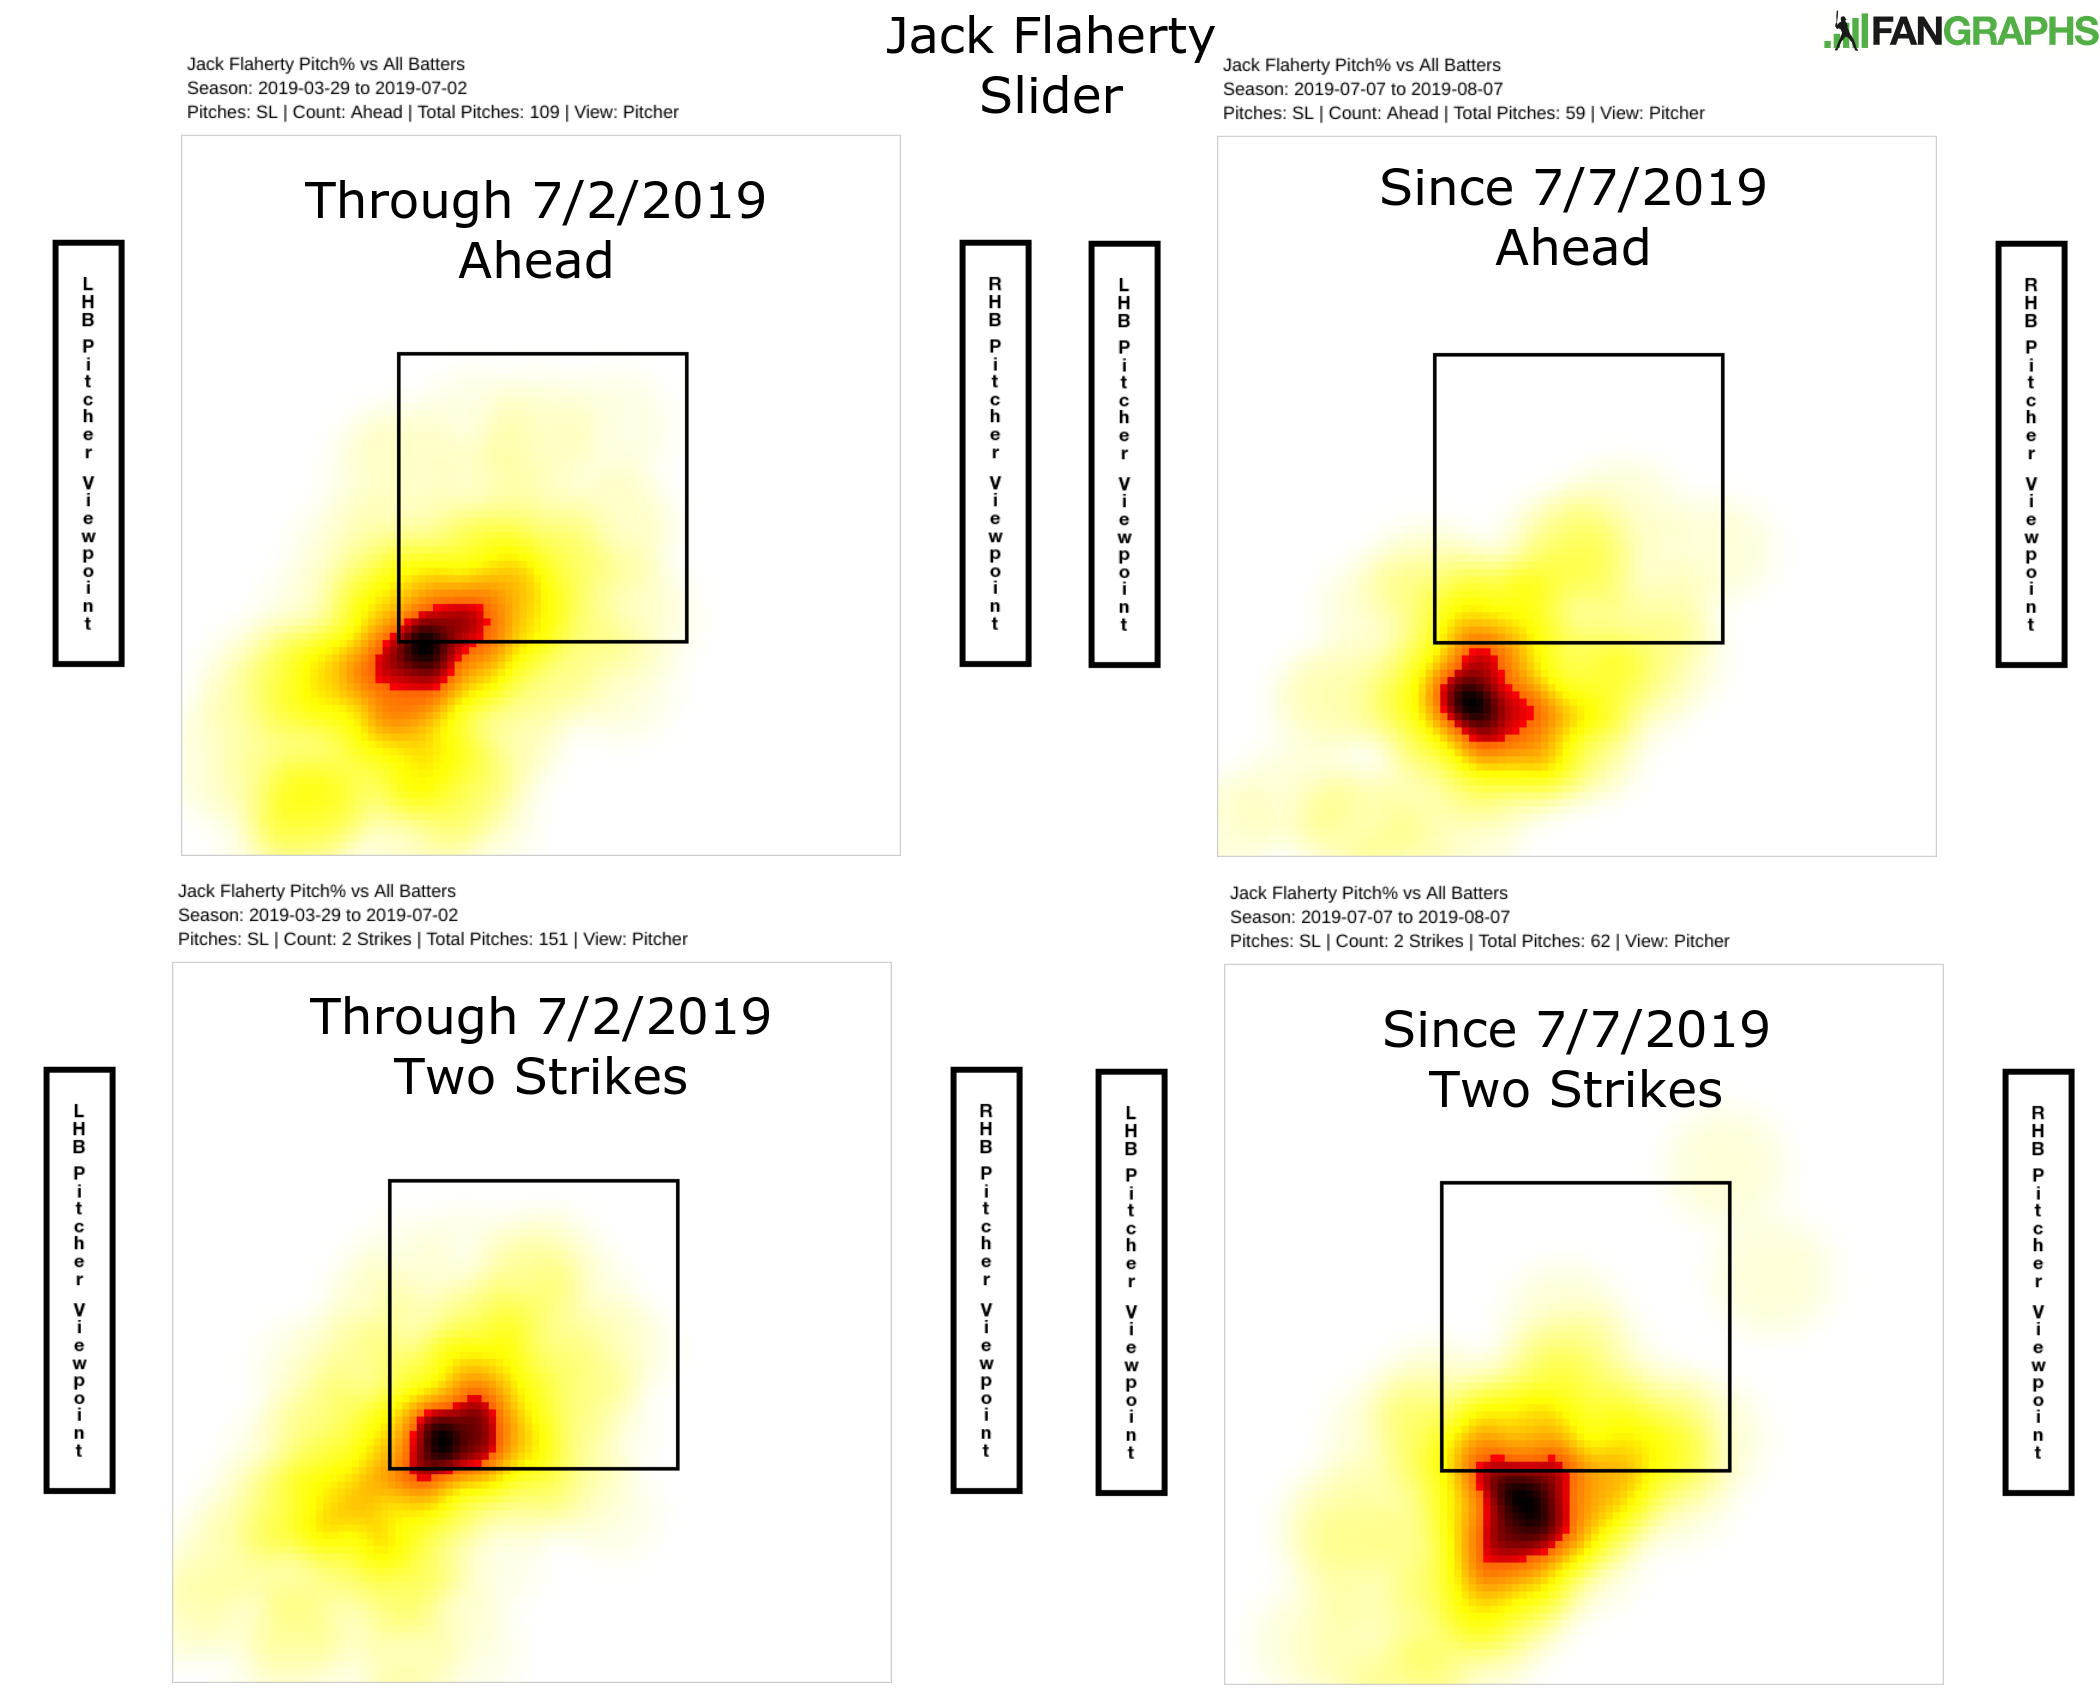
The ball is going a little bit more over the plate on occasion, but it is hitting below the zone. That might make the ball slightly more enticing but not easier to hit. Here’s one such slider to Javier Báez.
The pitch still works on the more traditional outside corner, as seen here with Alex Bregman.
Even throwing it way out of the zone can frustrate a sleeveless Yasiel Puig.
As for how the pitch can work against lefties, here’s an example against Jeff McNeil, who has struck out just 13% of the time against right-handers this year.
Flaherty has put together some good stretches in his career, but nothing ever this good.
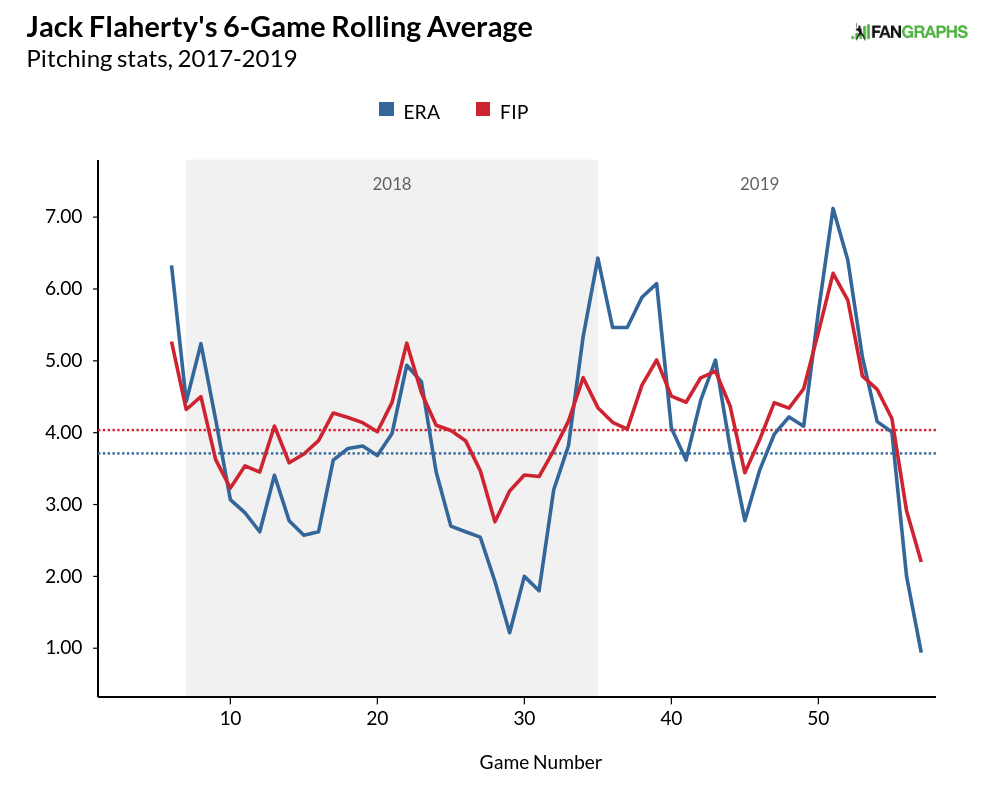
In looking at his overall 4.04 FIP and 3.72 ERA, it might be tempting to look at last year’s 3.86 FIP and 3.34 ERA and think Flaherty’s season has been worse, but don’t do that. The new run environment means that Flaherty’s FIP- is 93 compared to last year’s 96 and his ERA- this year is 86 nearly identical to last season’s 85. In just six starts, Flaherty has completely wiped out the disappointing half-season that started the 2019 campaign and has now nearly equaled his 2.4 WAR total from a year ago in five fewer games. While the season once looked like a step back for Flaherty, a solid finish will mean a step forward for the 23-year-old as he looks to establish himself in the upper echelon of pitchers.
Craig Edwards can be found on twitter @craigjedwards.
Great article, but I know you know that luck doesn’t “even out”, so don’t write that. The sentence makes its point without those two words.
It’s certainly a very informative an insightful article
Logically, it is true that luck does not “even out.” However, I came here to post that the author should not have written this article until after the season because I really need Flaherty to pitch well the rest of the season for my fantasy team’s pennant chase, and this will jinx him. Logically, it is also true that articles do not jinx baseball players. It is a matter of faith. 😉
Better yet, there literally is no such thing as “luck”. Baseball is entirely Newtonian physics. If his BABIP has decreased, there’s a reason for it. A look at the statcast data might help
how bout Darvish going from walking everyone to no one
Darvish’s K to BB ratio with Victor Caratini as his catcher (half of his starts) is a comical 84 to 11.
In the same number of starts (and fewer innings) with Contreras and Taylor Davis serving as his catchers, it’s 74 to 40.
Two words: Shane. Bieber. That is all.
That’s actually five words, but here are four words about Shane Bieber: irrelevant to this article.
Stop it! I was hoping he would be cheap next year and this isn’t helping.
Jack finally stopped Jacking off.
Thanks to that initial table, I now want to know how JV has been striking out 44% of batters over the last month, dear lord.
Renaldo Lopez!!!! I thought his Era was over 6 earlier this season. Huh! I wonder how he turned it around?
One can easily make the case that he has been the best lately. Plus the Cards aren’t scoring any runs for him which makes for more high pressure outings. Cards are going to have to have him continue if they hope to overtake the Cubs. But right now nobody wants to face him in a one game play-off.
There are lots of sp that people would not want to face in a single game.