The Rarity of Walker Buehler
Last Saturday night against the Padres in Los Angeles, five days past his 25th birthday, Walker Buehler authored the most dominant start of his young career. With a fastball that touched 99 mph and a slider and cutter that continually befuddled hitters, the Dodgers righty faced 31 batters, struck out 15 of them, walked none, and yielded just five hits. Only one of those hits was of consequence, namely Manuel Margot’s eighth-inning pinch-homer, which kept Buehler from throwing a complete-game shutout; he and the Dodgers had to settle for a 4-1 win. Even allowing for the fact that the Padres own the majors’ highest strikeout rate (26.0%) and weren’t fielding a modern day Murderer’s Row, Buehler’s performance was a thing to behold.
So, behold!
While the major league strikeout rate is again at an all-time high (22.8%), Buehler’s start was just the sixth of the season in which a pitcher struck out 15 batters. He’s the only pitcher with multiple 15-K games, as he whiffed 16 but allowed two solo homers (from among just three hits) against the Rockies on June 21; he didn’t need more than 111 pitches in either start. Here’s the complete set:
| Pitcher | Date | Team | Opp | IP | H | R | ER | BB | SO | HR | Pit |
|---|---|---|---|---|---|---|---|---|---|---|---|
| Chris Sale | 5/14/19 | Red Sox | Rockies | 7 | 3 | 2 | 2 | 0 | 17 | 1 | 108 |
| Shane Bieber | 5/19/19 | Indians | Orioles | 9 | 5 | 0 | 0 | 0 | 15 | 0 | 107 |
| Max Scherzer | 6/2/19 | Nationals | Reds | 8 | 3 | 1 | 1 | 1 | 15 | 0 | 120 |
| Justin Verlander | 6/12/19 | Astros | Brewers | 7 | 4 | 3 | 3 | 0 | 15 | 3 | 100 |
| Walker Buehler | 6/21/19 | Dodgers | Rockies | 9 | 3 | 2 | 2 | 0 | 16 | 2 | 111 |
| Walker Buehler | 8/3/19 | Dodgers | Padres | 9 | 5 | 1 | 1 | 0 | 15 | 1 | 110 |
If that isn’t impressive enough, consider that Buehler and Scherzer are the only pitchers with multiple such games in a single season since 2002:
| Pitcher | Team | Year | 15-K Games |
|---|---|---|---|
| Pedro Martinez | Red Sox | 1999 | 6 |
| Randy Johnson | Mariners | 1997 | 5 |
| Randy Johnson | Mariners/Astros | 1998 | 4 |
| Randy Johnson | Diamondbacks | 2002 | 4 |
| Randy Johnson | Mariners | 1995 | 3 |
| Roger Clemens | Blue Jays | 1998 | 3 |
| Pedro Martinez | Red Sox | 2000 | 3 |
| Randy Johnson | Diamondbacks | 2001 | 3 |
| Curt Schilling | Phillies | 1997 | 2 |
| Kerry Wood | Cubs | 1998 | 2 |
| Randy Johnson | Diamondbacks | 1999 | 2 |
| Mike Mussina | Orioles | 2000 | 2 |
| Max Scherzer | Nationals | 2015 | 2 |
| Walker Buehler | Dodgers | 2019 | 2 |
“Oh, hey guys! Just hanging out with a bunch of Hall of Famers and multiple Cy Young award winners, no big deal…”
As several Play Index power users pointed out in the immediate aftermath of Buehler’s gem, only two other pitchers have thrown multiple 15-strikeout, zero-walk starts in the same season, namely Martinez in both 1999 and 2000 — two of the most dominant seasons ever turned in by a pitcher — and Dwight Gooden in 1984. As with the other lists above, that’s some outstanding company, even if Buehler’s spot among them is aided by the league-wide rise in strikeout rates.
It’s easy to forget for a moment that this is Buehler’s first full major league season. The 2015 first-round pick of the Dodgers out of Vanderbilt, who underwent Tommy John surgery shortly after being drafted, had just 93.2 professional innings under his belt before making his major league debut on September 7, 2017, as part of the Dodgers’ unsuccessful plan to groom him for their postseason roster. He made three starts at Triple-A to begin last season before joining the Dodgers’ rotation on April 23, and with time off for a rib fracture and a workload slowdown, made 23 starts and one relief appearance totaling 137.1 innings in the regular season, finishing with a 2.62 ERA, 3.04 FIP, and 3.1 WAR. He added four more starts in the postseason, capped by a dominant Game 3 start in the World Series against the Red Sox, when he spun seven scoreless frames of two-hit ball in an effort that was obscured by the game lasting another 11 innings.
Buehler’s 2019 season has been very good so far, but he’s not yet in Cy Young territory. Among the 38 qualified NL starters through Wednesday, his 2.99 FIP is fourth, his 3.22 ERA is ninth, and his 3.6 WAR tied for sixth. With a 29.0% strikeout rate (sixth) and 3.8% walk rate (third), he owns the league’s top strikeout-to-walk ratio (7.6) and third-best strikeout-walk differential (25.3%) behind Scherzer (30.7%) and Jacob deGrom (25.5%). His 1.1 homers per nine allowed is a more modest 15th in the league.
Because he threw a total of 177 innings between the majors, minors, and postseason, the Dodgers brought Buehler along slowly this spring. He didn’t make his Cactus League debut until March 18, and he was rusty when the season began, allowing 11 runs in 12 innings over his first three starts, finishing the month with a 5.22 ERA. Since May 1, he owns a 2.66 ERA, 2.84 FIP, 31.7% strikeout rate, and 2.7% walk rate, numbers that respectively rank sixth, fifth, third, and first among NL qualifiers. Not too shabby.
While Buehler’s overall numbers resemble those of last year, under the hood there are a few differences. His BABIP has climbed from .248 to .284, his ground-ball rate has dropped from 50% to 43.5%, and his homer rate has risen from 0.79 per nine to 1.10. He has dramatically decreased the use of his sinker in favor of his four-seamer:
| Season | FA% | FC% | SI% | CH% | SL% | CU% |
|---|---|---|---|---|---|---|
| 2018 | 41.5% | 12.0% | 18.1% | 3.7% | 11.2% | 13.5% |
| 2019 | 54.5% | 14.1% | 6.3% | 0.5% | 12.4% | 12.2% |
Cutting back on his sinker has been one reason for the drop in Buehler’s ground-ball rate; 55.0% of those put into play last year were grounders, whereas just 37.3% of this year’s four-seamers have been. He’s getting far fewer grounders on his curve as well (73.3% last year, 55.3% this year), even though he’s been working further down in — and outside — the strike zone with the pitch:
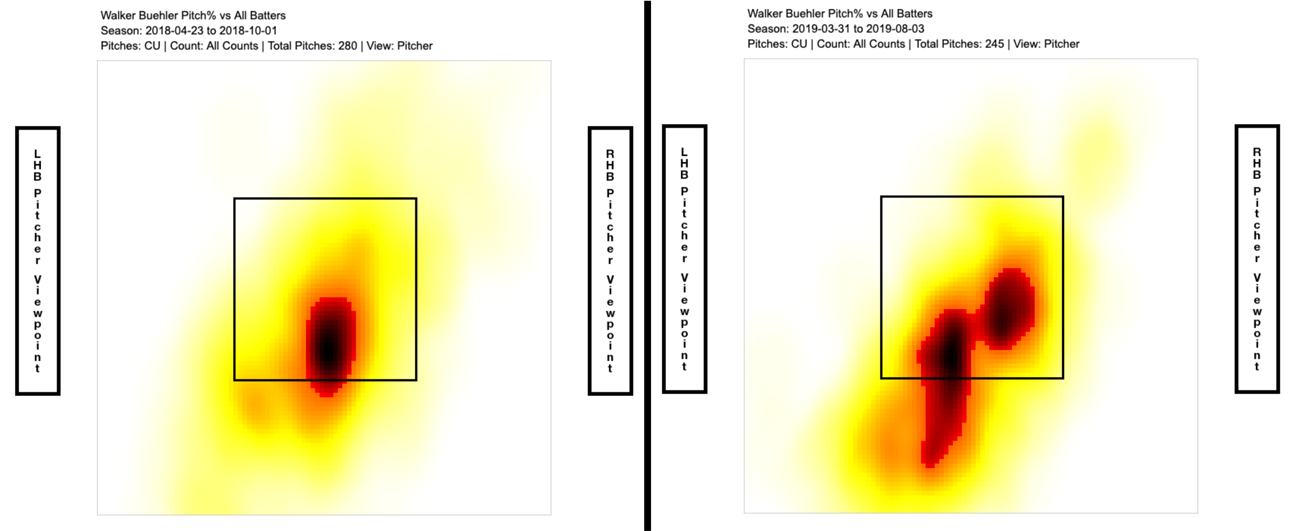
Continuing a pattern from last year, Buehler throws the curve more often to lefties (14.9%) than righties (9.0%). He’s induced batters to increase their rate of swinging at curves outside the zone from 27.8% to 38.1%, and his overall swinging strike rate on the pitch has climbed from 10.3% to 18.8%. Likewise, he’s been working lower and more outside the zone with the slider, which he throws more often to righties (15.6%, versus 10.9% for lefties):
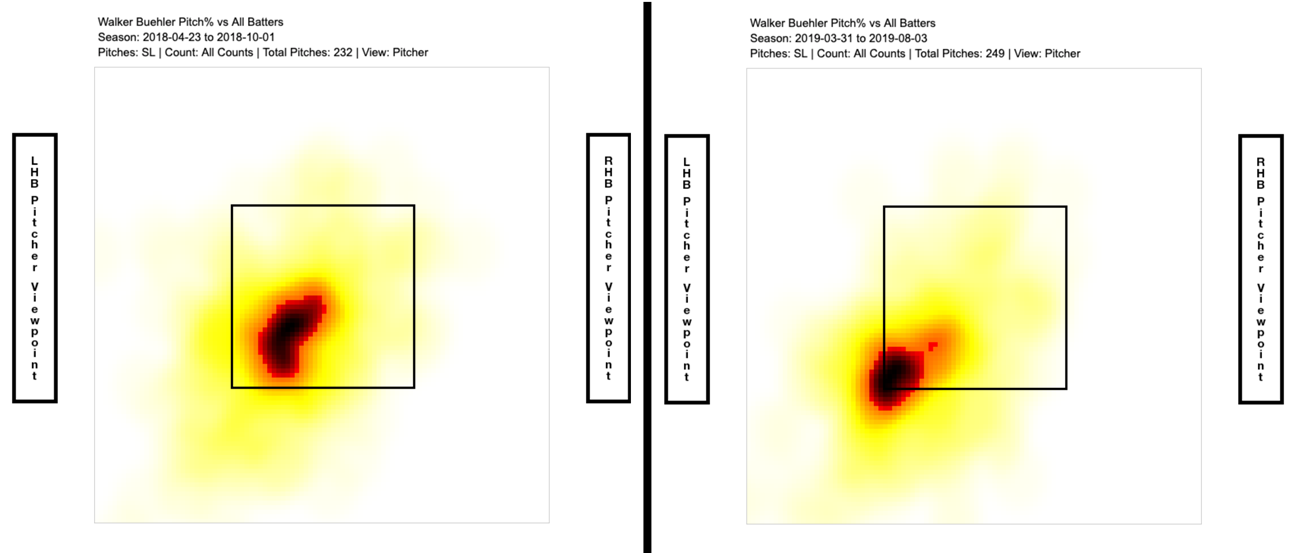
Batters’ rate of chasing sliders outside the zone has climbed from 39.1% to 50.0%, and Buehler’s swinging strike rate on the pitch has jumped from 14.6% to 20.5%.
Now, not many pitchers can generate high swinging strike rates on both their curve and their slider. Via Baseball Savant, I found just eight others from among those who have thrown at least 200 of each this year: Buehler, Shane Bieber, Anthony DeSclafani, Max Fried, Kyle Gibson, Clayton Kershaw, German Márquez, Robbie Ray, and Noah Syndergaard. While not uniform in quality, that’s a pretty darn good group of pitchers. Throw in the fact that Buehler is also generating a 14.9% swinging strike rate with his cutter… and well, that got me even more curious.
Using that 200 pitch cutoff, I examined pitchers’ swinging strike rates on curves, sliders, cutters, splitters, and changeups — everything but four-seamers and sinkers. Even using just a 10% swinging strike rate cutoff, I found only eight pitchers above that rate on three pitches, including one who’s doing so with four pitches (note that these rates might differ from the Pitch Info-based ones I’ve reported above for Buehler, and that Baseball Savant classifies his pitch as a knuckle curve):
| Pitcher | Team | SwStr% SL | SwStr% CU | SwStr% FC | SwStr% CH | SwStr% All |
|---|---|---|---|---|---|---|
| Kyle Gibson | Twins | 28.1% | 15.8% | — | 20.7% | 22.7% |
| Noah Syndergaard | Mets | 20.0% | 19.4% | — | 17.5% | 18.8% |
| Walker Buehler | Dodgers | 20.8% | 19.9% | 14.9% | — | 18.5% |
| Sandy Alcantara | Marlins | 14.6% | 10.9% | — | 17.7% | 14.6% |
| Trevor Bauer | Indians/Reds | 18.8% | 13.6% | 12.8% | 12.0% | 14.5% |
| Zack Greinke | Diamondbacks/Astros | 13.8% | 16.9% | — | 13.0% | 14.4% |
| Mike Minor | Rangers | 12.2% | 11.8% | — | 15.8% | 13.6% |
| Zack Wheeler | Mets | 11.7% | 10.3% | — | 12.8% | 11.6% |
That’s an even more interesting group, with seven of the eight (all but Alcantara) ranking among the majors’ top 30 in WAR. Gibson (who has the highest swinging strike rate from among these pitches), Syndergaard, and Buehler are the only pitchers above 14% in all three, while Bauer is the only pitcher above 10% in all four. All but Alcantara, Gibson, and Greinke also have swinging strike rates above 10% on their four-seamers, and while Buehler’s 10.8% is the lowest of the remaining quintet, he and Syndergaard (11.7%) are the only two pitchers who overlap with the 3×14% group. In other words, that’s a lot of weapons.
I went looking to find pitchers who fit the bill over the previous four seasons and came up with just four who did it a total of six times: Kershaw (2015), Corey Kluber and Madison Bumgarner (2015 and ’16), and Ray (2017). Here’s the list of those with 10% swinging strike rates on the fastball as well as three other pitches:
| Player | Team | Year | Sw% SL | Sw% CU | Sw% CH | Sw% FC | Sw% SF | Sw% All | Sw% FF |
|---|---|---|---|---|---|---|---|---|---|
| Corey Kluber | Indians | 2016 | 17.0% | 27.7% | 27.7% | — | — | 23.5% | 11.0% |
| Clayton Kershaw | Dodgers | 2015 | 26.2% | 19.6% | 19.6% | — | — | 22.4% | 11.2% |
| Robbie Ray | D-backs | 2017 | 25.2% | 18.3% | 18.3% | — | — | 20.7% | 11.0% |
| Corey Kluber | Indians | 2015 | 22.4% | 19.3% | 19.3% | — | — | 20.7% | 11.3% |
| Noah Syndergaard | Mets | 2019 | 20.0% | 19.4% | 17.5% | — | — | 18.8% | 11.7% |
| Walker Buehler | Dodgers | 2019 | 20.8% | 19.9% | — | 14.9% | — | 18.5% | 10.8% |
| Madison Bumgarner | Giants | 2015 | 15.7% | 17.3% | 17.3% | — | — | 16.5% | 12.1% |
| Matt Harvey | Mets | 2015 | 18.5% | 14.8% | 14.8% | — | — | 16.2% | 12.0% |
| Nick Pivetta | Phillies | 2018 | 17.0% | 15.9% | 15.9% | — | — | 16.2% | 12.0% |
| Madison Bumgarner | Giants | 2016 | 13.5% | 18.8% | 18.8% | — | — | 16.2% | 10.1% |
| Jimmy Nelson | Brewers | 2017 | 19.1% | 14.7% | 14.7% | — | — | 16.0% | 12.7% |
| Justin Verlander | Astros | 2018 | 19.8% | 12.9% | 12.9% | — | — | 15.9% | 15.8% |
| Jake Arrieta | Cubs | 2016 | 13.4% | 16.9% | 16.9% | — | — | 15.4% | 11.9% |
| Gerrit Cole | Astros | 2018 | 19.2% | 13.3% | 13.3% | — | — | 15.3% | 15.3% |
| Jacob deGrom | Mets | 2017 | 13.4% | 15.8% | 15.8% | — | — | 14.5% | 16.5% |
| Trevor Bauer | Inds/Reds | 2019 | 18.8% | 13.6% | 12.0% | 12.8% | — | 14.5% | 11.4% |
| Jameson Taillon | Pirates | 2018 | 14.5% | 14.1% | 14.1% | — | — | 14.2% | 11.9% |
| Jimmy Nelson | Brewers | 2015 | 19.9% | 10.8% | 10.8% | — | — | 14.0% | 10.6% |
| Zack Wheeler | Mets | 2018 | 12.8% | 14.5% | 14.5% | — | 15.5% | 13.7% | 11.5% |
| Mike Minor | Rangers | 2018 | 12.2% | 11.8% | — | — | 15.8% | 13.6% | 11.1% |
| Jeff Samardzija | White Sox | 2015 | 11.9% | — | — | 12.6% | 15.3% | 12.9% | 10.1% |
| Zack Wheeler | Mets | 2019 | 11.7% | 10.3% | 12.8% | — | — | 11.6% | 13.4% |
| Rick Porcello | Red Sox | 2018 | 12.2% | 11.5% | 11.5% | — | — | 11.8% | 13.7% |
| Stephen Strasburg | Nationals | 2016 | 11.9% | 10.3% | 10.3% | — | — | 10.9% | 10.8% |
Again, those weren’t uniformly great seasons, but that’s some good company. I’m not claiming this to be the be-all and end-all of statistical distinctions; it’s worth noting that Buehler’s overall 12.2% swinging strike rate is 21st in the majors, very good but not elite. I do think it’s noteworthy that he’s got so many weapons with which to miss bats, and that he keeps appearing on these short lists among Cy Young winners and other frontline starters. He’s already proven himself to be among the latter, and within the next few years, it would hardly be a surprise if he joins the former group.
Brooklyn-based Jay Jaffe is a senior writer for FanGraphs, the author of The Cooperstown Casebook (Thomas Dunne Books, 2017) and the creator of the JAWS (Jaffe WAR Score) metric for Hall of Fame analysis. He founded the Futility Infielder website (2001), was a columnist for Baseball Prospectus (2005-2012) and a contributing writer for Sports Illustrated (2012-2018). He has been a recurring guest on MLB Network and a member of the BBWAA since 2011, and a Hall of Fame voter since 2021. Follow him on BlueSky @jayjaffe.bsky.social.
Great piece. What all the stats don’t capture is his mental game. After watching him for a few starts you get the impression that he has an extra level of competitiveness, is not shook by the big moments, and really studies the game.
Wouldn’t the stats capture that? If he performs better in big moments that will be reflected by the stats.
For what it’s worth, he shoved in Game 3 of the WS.
I’m not doubting that he’s terrific lol. I’m saying he’s a stud and the stats show that he’s a stud, so there’s no need to appeal to intangibles.
Not appealing, just making note of another intangible that he possesses.
the stats that capture that would comprise samples too small to be reliable, so we wouldn’t bother to look at them.
Maybe a better way of saying it is that the stats don’t do the best job quantifying his mental strength. Yeah sure some if it will be reflected in the stat line but there is more to a player’s brain than just their clutch rating.
Not arguing with you, but how would stats (i.e. numbers) not quantify (i.e. put into numbers) his mental game? He’s a competitor and a student of the game, and it should show in his performance. To the extent it doesn’t, then does it really matter?
They don’t quantify how much being a student of the game and mentally strong help his stat line. Yes, some of it will be reflected in his stat line but how much of his performance is because of it? I.E. how much of his K-BB% or his swinging strike % is attributable to his average fastball velo or spin rate vs the time he spends studying his hitters? I’m under the impression that being mentally tough and a student of the game should help performance but I think it’d be hard to find a strong correlation through quantitative analysis. How would one conduct such a study? We have studies that show velocity and spin rate correlate to better overall numbers but do we have studies that quantify the effects of mental attributes?